

Abstract
Mitochondrial calcium uniporters (MCUs) (TC no. 1.A.77) are oligomeric channel proteins found in the mitochondrial inner membrane. MCUs have two well-conserved transmembrane segments (TMSs), connected by a linker, similar to bacterial MCU homologues. These proteins and chlamydial IncA proteins (of unknown function; TC no. 9.B.159) are homologous to prokaryotic Mg2+ transporters, AtpI and AtpZ, based on comparison scores of up to 14.5 sds. A phylogenetic tree containing all of these proteins showed that the AtpZ proteins cluster coherently as a subset within the large and diverse AtpI cluster, which branches separately from the MCUs and IncAs, both of which cluster coherently. The MCUs and AtpZs share the same two TMS topology, but the AtpIs have four TMSs, and IncAs can have either two (most frequent) or four (less frequent) TMSs. Binary alignments, comparison scores and motif analyses showed that TMSs 1 and 2 align with TMSs 3 and 4 of the AtpIs, suggesting that the four TMS AtpI proteins arose via an intragenic duplication event. These findings establish an evolutionary link interconnecting eukaryotic and prokaryotic Ca2+ and Mg2+ transporters with chlamydial IncAs, and lead us to suggest that all members of the MCU superfamily, including IncAs, function as divalent cation channels.
Introduction
Mitochondrial Ca2+ homeostasis plays a critical role in aerobic metabolism and cell survival in eukaryotes, and an overload of Ca2+ in the organelle is considered the fundamental trigger for cell death (apoptosis) (Marchi & Pinton, 2013). A recently discovered two transmembrane segment (TMS) channel protein, named the mitochondrial calcium uniporter (MCU), shares tissue distribution with MICU1 (also known as CBARA1) (Baughman et al., 2011; De Stefani et al., 2011), which is a recently characterized uniporter regulator found in organisms that demonstrate mitochondrial Ca2+ uptake. When placed in a planar lipid bilayer, purified MCU proteins showed channel activity (De Stefani et al., 2011). Silencing of MCU reduced Ca2+ uptake, while overproduction gave rise to increased Ca2+ within the mitochondrial matrix. The two predicted TMSs of MCU are separated by a well-conserved linker region that faces the intermembrane space. The acidic residues within this linker region are required for full activity. An S259A point mutant retained function but conferred resistance to ruthenium red-360 (Ru360), a specific mitochondrial calcium uptake inhibitor, demonstrating that MCU is responsible for Ru360-sensitive mitochondrial Ca2+ uptake (Baughman et al., 2011).
MCU physically interacts with MICU1 (TC no. 8.A.44), as well as the essential EMRE protein (TC no. 8.A.45), forming heterooligomers in the mitochondrial inner membrane (Sancak et al., 2013). These proteins and several others reside in a high molecular mass complex (Marchi & Pinton, 2014). MICU1 regulates MCU-mediated Ca2+ uptake by preventing the Ca2+ overload that triggers autophagy (Mallilankaraman et al., 2012), and the interaction between MCU and MICU1 requires EMRE (Sancak et al., 2013). MCU homologues and their regulatory protein partners, the MICU proteins, are present in most eukaryotes (Marchi & Pinton, 2014). However, putative bacterial MCU homologues have been identified (Bick et al., 2012). The presence of prokaryotic calcium channel homologues suggests that MCU may have been an early feature in mitochondria, and that these proteins are ancient, of prokaryotic origin.
Another protein that shares the same two TMS topology is encoded by the atpZ gene, which overlaps the atpI gene that encodes a four TMS membrane protein within the atp operon of Bacillus pseudofirmus OF4. This operon contains the eight structural genes that encode the F-ATPase (ATP synthase), and these genes are preceded by the atpI and atpZ genes (Liu et al., 2013). Deletion of either or both of these two genes in B. pseudofirmus OF4 resulted in an increased Mg2+ requirement for cell growth at pH 7.5 (Hicks et al., 2003). In a mutant Escherichia coli strain defective for Ca2+ and Na+ efflux, AtpI and AtpZ, separately and together, increased Mg2+-sensitive vesicular Ca2+ uptake. Thus, it was hypothesized that AtpZ and AtpI are Mg2+ and/or Ca2+ homooligomeric or heterooligomeric transporters that exhibit channel behaviour (Hicks et al., 2003). They could provide the Mg2+ required for ATP synthase assembly and/or activity, possibly by supporting charge compensation. In fact, analysis of AtpI function in Acetobacterium woodii showed that deletion of the atpI gene resulted in the misassembly of the Na+-transporting F1F0-ATP synthase via loss of the heterooligomeric c-ring rotor (Liu et al., 2013). Thus, the AtpI protein apparently plays a role in the proper assembly of the membrane sector of the ATP synthase.
In this study, statistical methods have been used to derive evidence that these prokaryotic Mg2+ transporters and MCUs arose from a common ancestor. Comparison scores, as well as topological, phylogenetic and motif analyses, strongly suggested that the four TMS AtpIs arose via an intragenic duplication event from a two TMS primordial precursor. AtpIs and AtpZs are more closely related to each other than they are to MCUs. A group of newly discovered eukaryotic AtpI homologues (EukAtpIs) are also described and are shown to be related to the prokaryotic Mg2+ transporters and MCUs. They fall within the large and diverse cluster of bacterial AtpIs. We further provide evidence that these proteins are homologous in their transmembrane pore-forming regions to a family of chlamydial IncA proteins, secreted to host cells via type III secretion systems (Ronzone & Paumet, 2013). Although their function(s) is/are not established, IncAs may play roles in multimerization, homotypic membrane interactions and membrane fusion of chlamydial inclusions during infection (Ronzone & Paumet, 2013; Umeki et al., 1985). IncAs have been shown to have two coiled coil regions as well as variable numbers of repeat units that could be associated with the persistence of infections (Sait et al., 2014; Suchland et al., 2008).
Establishing homology among these proteins provides insight into the links between a eukaryotic organelle and its prokaryotic origins, and allows functional prediction of homologues of unknown function. These proteins comprise the MCU superfamily with all MCUs, AtpZs, AtpIs and EukAtpIs included under TC no. 1.A.77 of the Transporter Classification Database (TCDB; www.tcdb.org), and all IncA proteins listed under TC no. 9.B.159 because of their unresolved functions.
Methods
Homology was established using the Superfamily Principle (Chang et al., 2004; Doolittle, 1994; Saier, 1994). This principle states that if protein A can be shown to be related to protein B, and protein B can be shown to be related to protein C, then proteins A and C must be related, regardless of the degree of sequence similarity between them. In applying the Superfamily Principle, it should be noted that if B is a fusion of two proteins or two protein domains, it could have different domains that are homologous to A and C, and thus homology would not be established. It is thus essential to establish that the hits of A and C are in the same region of B. This point was checked for each comparison reported here. Further, most of the proteins examined in this study are short unidomain proteins. In the studies reported here, proteins from distinct groups (A and D) are used to collect homologues (B and C, respectively), which are then compared for sequence similarity. It should be noted that homology is an absolute term, meaning derived from a common evolutionary origin, and does not imply a certain degree of sequence similarity.
Representative members of the MCU family (Table S1, available in the online Supplementary Material) were collected and expanded using psi-blast (Altschul et al., 1997) searches with the Protocol 1 program, an e value cut-off of 0.005 and two iterations (Reddy & Saier, 2012). Redundant sequences were then removed using a modified cd-hit program, incorporated into Protocol 1, with a 0.8 (80 % identity) cut-off (Fu et al., 2012). This means that if multiple proteins show greater than 80 % identity, only one is retained for further study. This method results in elimination of redundancies and close similarities, leaving a collection of proteins of dissimilar sequences.
Degrees of sequence similarity were statistically analysed using the gsat program (Reddy & Saier, 2012). gsat performs pairwise alignments using the Needleman–Wunsch algorithm, shuffling the sequences and comparing the shuffled sequences with the native sequences in order to correct for compositional abnormalities (a restricted amino acid composition) as occur with membrane proteins. A standard score (z-score) is calculated and provided by the program. High-scoring pairs (HSPs) were selected between families using the Protocol 2 program, which performs a Smith–Waterman search between two fasta files and selects the highest scoring pairs with overlapping TMSs. The HSPs are then analysed with gsat using 200 shuffles, and a standard score is determined for each. The greatest HSPs for each family comparison are then rerun through gsat using 2000 random shuffles to confirm scores and gain greater accuracy. To establish homology, all comparison scores (A with B, B with C, and C with D) must show greater than 12 sd for a stretch of at least 60 overlapping amino acyl residues (Yee et al., 2013).
The Web-based Hydropathy, Amphipathicity and Topology (what) program was used to determine and plot the hydropathy, amphipathicity and predicted transmembrane topology of protein sequences (Zhai & Saier, 2001b). TMS predictions were performed using hmmtop, which predicts integral membrane topology using a hidden Markov model (HMM) (Tusnady & Simon, 1998). A method for estimating topological conservation involved use of the AveHAS program (Zhai & Saier, 2001a), which generates average hydropathy, amphipathicity and similarity (AveHAS) plots based on a clustal_x multiple alignment (Thompson et al., 1997).
Phylogenetic superfamily trees were created using the Super Family Tree program (sft) (Chen et al., 2011; Yen et al., 2009, 2010), and visualized using the TreeView program (Page, 2002). The sft1 program, which is based on blast BIT scores for large numbers (tens of thousands) of binary comparisons, has been shown in six publications (Chen et al., 2011; Reddy & Saier, 2013; Reddy et al., 2012; Wong et al., 2012; Yen et al., 2009, 2010) to be superior to other programs for depicting deep phylogenies within superfamilies of distantly related proteins. This is in contrast to programs that construct phylogenetic trees that are based on multiple alignments such as neighbour-joining, Bayesian integration over alignments and maximum-parsimony. When the proteins are sufficiently similar to generate reliable multiple alignments, the results from sft agree with those obtained using multiple alignments because similarities can be detected between any set of homologues using variable parts of the sequences. The matrix that is fed into the Fitch algorithm (Felsenstein, 1997; Fink, 1986; Fitch & Margoliash, 1967) summarizes all similarities detected, rather than an aggregated trend found in a given multiple alignment, which need not be generated.
A second method used for estimating relative conservation and also used for motif analyses is the Multiple EM for Motif Elicitation (meme) program (Bailey et al., 2006). meme searches for novel signals (motifs) within a set of protein sequences. Sequences are labelled in the areas that align with these motifs. Pairwise correlations between the motifs are determined by the maximal sum of Pearson's correlation coefficients for aligned columns divided by the width of the shorter motif.
Use of hhsuite-2.0.16.
We used hhmake of hhsuite-2.0.16 (ftp://toolkit.genzentrum.lmu.de/pub/HH-suite/hhsuite-userguide.pdf) to train HMMs on mafft v7.023b (03/02/2013) (Katoh & Standley, 2013) E-INS-i alignments of AtpIs and AtpZs. Subsequently, all pairwise HMM : HMM comparisons between AtpIs, AtpZs, EukAtpIs and MCUs were completed. The probability of homology for each comparison was recorded. The region and any matching conserved residues between the consensus sequences of the HMMs were noted.
Another approach used relied on hmmer 3. First, we generated a set of HMMs (rather than a set of HHMs, which are only used in HHsuite) after converting the files to Stockholm format. The HMM of MCUs was used, which contains a well-conserved and characteristic motif of W-x(3)-Ep-x(2)-y, against EukAtpI, AtpI and AtpZ.
Pfam analyses.
We downloaded the latest version of Pfam-A (release 27.0) and scanned it against all members of the MCU superfamily (listed under TC no. 1.A.77) using hmmer 3 (http://hmmer.janelia.org/) with the default e value cut-off of 10. The relationships were subdivided into 10 similarity bands, representing 10 % wide bands of e values from the lowest to the highest. The relationships were viewed using Cytoscape 2.8.3 (http://www.cytoscape.org/), using a spring-embedded layout. Pfam nodes were shown in a smaller size compared to nodes representing sequences from TCDB. Using TCDB's facility to retrieve families (http://www.tcdb.org/download.php), we downloaded the Mer superfamily (TC no. 1.A.72) as a control.
Results
A phylogenetic tree was constructed using the proteins listed in Table S1 (Figs. 1a and S9). This tree reveals three major groups of proteins. On the upper left, mitochondrial and bacterial MCU homologues cluster together. On the upper right, almost all IncAs cluster together, the only exceptions branching from the base of the branches separating IncAs from MCUs. At the bottom of the tree, the Mg2+ AtpI and AtpZ transporters cluster loosely together, but the AtpZs (lower left) form a coherent subcluster within the AtpIs. The eukaryotic AtpI homologues are also within this diverse cluster. These are fusion proteins, each with an N-terminal four TMS AtpI domain and a large soluble C-terminal α/β-hydrolase domain. This tree shows the relationships of the different types of proteins to each other as determined by the sft program. The estimated relationships of the distinct groups are shown in the sft2 tree (Fig. 1b).
Fig. 1.

(a) Phylogenetic tree generated using the sft1 program. Protein numbers refer to the TC number in family 1.A.77. Thus, x.y refers to the protein with TC no. 1.A.77.x.y. Arrows indicate sequences that cluster outside their clade; 1.A.77.3 proteins are not monophyletic. The IncAs belong to TC family 9.B.159 because their transport function is not established. (b) sft2 tree showing family relationships only.
An AveHAS plot was created for each of the four groups using representative MCU family proteins from those listed in Table S1 (Fig. 2a–d). The red upper lines represent hydropathy, while the green upper lines represent amphipathicity. The dotted lines below reveal the relative degrees of conservation among the proteins at any position. In general, the highest degrees of conservation are seen for the hairpin TMSs and the linker regions between these two TMSs.
Fig. 2.

Average hydropathy (red upper line), amphipathicity (green upper line) and similarity (dashed lower line) (AveHAS program) plots, as well as TMS predictions (lower vertical lines) of: (a) MCUs; (b) AtpZs; (c) AtpIs; (d) eukaryotic AtpIs. The transmembrane helices are labelled TMS 1–4.
For the MCUs there were two well-conserved TMSs towards the C-termini of the aligned sequences, and they showed the highest degree of similarity in the linker region between the TMS pair (Fig. 2a). The AtpZs also showed a two TMS topology towards the C-terminal part of the alignment, and both TMSs showed similar degrees of conservation (Fig. 2b). Two peaks of amphipathicity overlap with, but are to the left of TMS 1 and the right of TMS 2. In these proteins, the linker was not as well conserved as the TMSs. The AtpIs have a four TMS topology with the best conservation in TMSs 2 and 4 (Fig. 2c). However, all four TMSs are better conserved than the linkers separating these pairs of TMSs. The eukaryotic AtpIs (EukAtpIs) also have a four TMS region, but they are all located towards the N-termini of these fusion proteins (Fig. 2d). The first domain is an AtpI domain, while the second much larger domain encodes a hydrolase. The first two TMSs are better conserved than the last pair. Because none of these EukAtpIs has been characterized, their functions and the relationships of the two domains to each other, if any, are unknown.
Motif analyses were conducted using the proteins listed in Table S1. These proteins were divided into four groups, and each group was individually analysed. Several motifs were identified, but only the best conserved motifs will be discussed here. Each group contained a motif that encompassed the conserved linker region between the TMS pairs, as well as regions of the two flanking TMSs. For the prokaryotic and eukaryotic four TMS AtpIs, two motifs were identified, one per TMS pair.
For the MCUs, a well-conserved motif, derived using the meme program, was found encompassing the end of TMS 1, the linker region and the majority of TMS 2. The position of this motif can be seen in Fig. S1(a), where the 1.2 (TC no. 1.A.77.1.2) protein is used as an example. The motif begins at residue position 250 and ends at position 270. The location of this motif in each protein of the group can be seen in Fig. S1(b) along with the P values, which measure statistical significance through a position-specific scoring matrix for the motif. The alignment of the sequences in each protein containing this motif can be seen in Fig. S1(c). This alignment shows both eukaryotic MCU and bacterial MCU motifs, and using clustal_x conserved residues between the two types could be identified (Fig. 3), revealing a well-conserved WDIMEP segment. Asterisks denote fully conserved residues, while colons indicate residues with strongly similar properties and single dots denote residues with weakly similar residue properties in all aligned sequences.
Fig. 3.
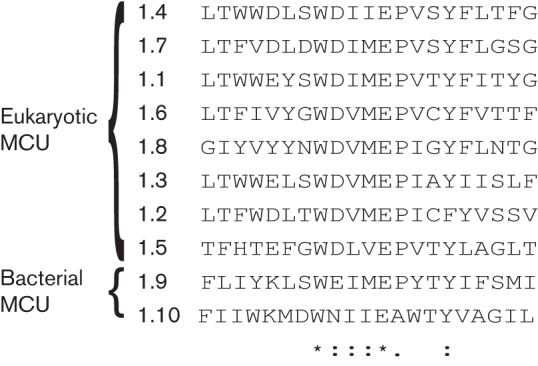
Multiple alignment comparing motifs between eukaryotic and prokaryotic MCUs. Asterisk, identity; colon, close similarity; single dot, more distant similarity (as defined using the clustal_x program).
The AtpZs also have a conserved motif encompassing the ends of TMSs 1, the linker regions and the beginnings of TMSs 2. The motif begins at residue position 21 and ends at position 43. The alignment of sequences in each protein containing this motif can be seen in Fig. S2. Similar plots were generated for the AtpIs (data not shown).
Two motifs were identified for the four TMS AtpIs, one for each pair of TMSs, encompassing the ends of TMSs 1 or 3, the linker regions and the beginnings of TMSs 2 or 4. Representative AtpI motifs are presented in Fig. 4, aligned with the corresponding motif for an AtpZ. The best inter-cluster per cent identities were 38–50 % (see legend to Fig. 4). From the alignment of these motifs, it can be seen that there is a well-conserved GLILG segment.
Fig. 4.
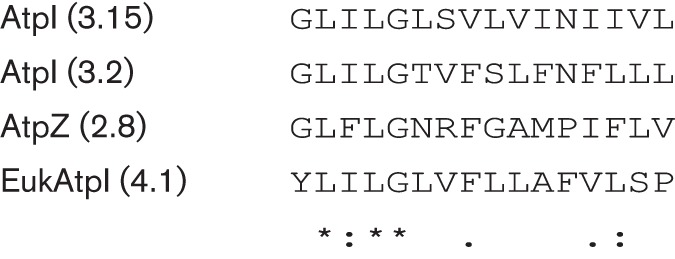
clustal_x alignment of a conserved motif found in representative AtpZ and AtpI proteins. The per cent identity between 3.2 (prokaryotic AtpI) and 2.8 (AtpZ) is 38 %, while that between 3.2 (prokaryotic AtpI) and 4.1 (eukaryotic AtpI) is 50 %. That between the two prokaryotic AtpIs (3.15 and 3.2) is 44 %. Asterisk, identity; colon, close similarity; single dot, more distant similarity (as defined using the clustal_x program).
MCUs and the prokaryotic AtpZ magnesium transporters are homologous and have a common conserved two TMS topology. The values reported using an expanded dataset yielded scores that, by our criteria (see Methods), establish homology between the four groups of proteins. The criterion used to establish homology is a gsat comparison score of 12 sds or greater for an alignment of at least 60 amino acyl residues (Saier, 1994; Saier et al., 2009; Yee et al., 2013).
MCU superfamily proteins were divided into four groups as indicated in Table S1. These four groups (MCU, AtpZ, AtpI and EukAtpI) were compared using the superfamily principle illustrated in Fig. 5(a). As an example, the data obtained when the MCUs were compared with the AtpZs are presented in Fig. 5(b–d). The scores for all gsat comparisons are presented in Tables 1 and 2. The values obtained were sufficient to establish homology (Doolittle, 1994; Saier, 1994). Homology of the MCU query proteins was established by gsat comparison with the AtpZ homologues, which gave a maximal score of 14.5 sd (Tables 1 and 2). The same procedure as used for the MCU/AtpZ gsat comparisons described above was conducted for the other pairs of superfamily families.
Fig. 5.

Illustration of the use of the Superfamily Principle to establish homology between distantly related homologues (proteins A and D). (a) Flowchart for establishing homology using the Superfamily Principle; (b) the ‘A versus B’ comparison of MCU and AtpZ; (c) B versus C; (d) C versus D. The comparison scores obtained using the gsat program with 2000 random shuffles with these segments were A–B, 16.3 sd; B–C, 15.0 sd; C–D, 28 sd. Values reported in Tables 1 and 2 were obtained with substantially longer segments. Protocols 1 and 2 were used to identify high-scoring protein pairs (see Methods). The numbers indicated above and below the sequences represent the TMS numbering. Horizontal bars represent identitites and colons close similarity.
Table 1. Comparison scores (z-scores) expressed in sd interrelating members of four different families in the MCU superfamily.
| AtpI | AtpZ | EukAtpI | |
| AtpZ | 12.0 | – | – |
| EukAtpI | 12.0 | 12.1 | – |
| MCU | 13.2 | 14.5 | 13.2 |
Table 2. Comparison scores expressed in terms of sd, obtained from binary alignments, showing homology of query proteins (A and D) with homologues (B and C) as required to establish homology using the Superfamily Principle.
Comparisons of A versus D demonstrate that homology could not be established through direct comparisons because the two sequences are too distantly related. Use of the Superfamily Principle allowed establishment of a connection that could not be demonstrated directly (i.e. by comparing A with D).
| A vs B | B vs C | C vs D | A vs D | |
| MCU vs AtpI | 18.5 | 13.2 | 14.5 | 0.0 |
| MCU vs AtpZ | 31.3 | 14.5 | 40.6 | 0.4 |
| MCU vs EukAtpI | 14.3 | 16.1 | 13.2 | −0.7 |
| AtpI vs AtpZ | 44.6 | 15.1 | 12.0 | 5.4 |
| EukAtpI vs AtpI | 12.0 | 12.8 | 42.3 | 1.8 |
| EukAtpI vs AtpZ | 173.3 | 12.1 | 13.5 | −0.7 |
Secondary structure predictions
Sequence 1.A.77.1.1 has two putative TMSs using the topcons programs, in the region 235–285. However, psipred and jpred3 showed that the whole latter part of the protein, from 171 to 341, is mainly alpha helical. The N-terminal portion was predicted to be about 25 % alpha, 25 % beta and 50 % coil. There is no 3-d crystal structure available, so we do not know how it folds. Sequence 1.A.77.2.1 has two predicted TMSs in topcons, located from residues 10 to 60. The protein is short, and there is little space to fit other secondary structural elements, although the jpred prediction indicated that the helical structure may extend outside the transmembrane region. Sequence 1.A.77.3.1 had four TMSs in topcons that cover most of the length of the short sequence. psipred does not detect any additional secondary structure, except for some short beta elements flanking TMSs 2 and 3. Sequence 1.A.77.4.1 has four TMSs located between residues 31 and 141. There is a long alpha element between residues 161 and 201, a smaller one between 251 and 261, and other ones in the regions 421–431, 511–521, 541–551, 591–601, 621–631, 651–661, 711–721, and 741–751. Interestingly, the elements located between 541 and 721 are all within a region that can be homology modelled on a large number of templates for a carboxylesterase fold (e.g. PDB:3L80), presumably not interacting with the membrane. Sequence 9.B.159.1.1 has one pair of TMSs between 41 and 91, and a second pair between 241 and 291.
Use of hhsuite-2.0.16
The HMMs representing AtpI and AtpZ sequences were compared to each other using HHsearch, presenting a probability of homology of 2.9 %. The matching regions of the consensus sequences contained the motifs G-x(6)-N, as identified previously for AtpI. The G-x(3)-G motif of AtpZ preceded and overlapped the G-x(6)-N motif of AtpI, and the former motif was present as the most conserved motif between these two families. These conserved motifs can be identified where the same extensive motif identified using meme is presented. EukAtpIs also exhibited motif similarities (Fig. 4), but again meme provided more detailed information.
To expand the set of bacterial MCUs, we performed a blastp search of the National Center for Biotechnology Information nonredundant protein database. The first sequence in the file, UniProt accession no. Q3UMR5, was recognized as DUF607 by Pfam (not organized in a clan). DUF607 has a characteristic HMM logo, T-x(5)-WdxMEP-x(2)-Y, the same as W-x(3)-Ep-x(2)-y found using meme. The first sequence in AtpI, (accession no. P22475), was recognized as ATP_synt_I (ATP synthase I chain) by Pfam, a member of the clan ATPase_I_AtpR (CL0478), having only one other member, AtpR, found in the N-ATPase (archaeal-type F1–F0-ATPase) operons. What was more evident than G-x(6)-N was G-x(39)-R/K. The AtpZ sequence (accession no. Q1CUJ6) was recognized as ATPase_gene1 by Pfam, not organized in a clan and not presently recognized as related to ATPase_I_AtpR in Pfam.
The results of our study demonstrated homology between the MCU, AtpZ and bacterial, archaeal and eukaryotic AtpI families, with subsequent inclusion of the chlamydial IncAs (see below). These results have been submitted to Pfam as a newly identified clan. These changes will appear in the next release of Pfam (28.0).
Pfam analyses
The Pfam analyses of the AtpI, AtpZ, EukAtpI and MCUs are shown in Fig. 6. The analyses showed that the MCU network is held together by a central Pfam node, and that one of the MCU sequences, TC no. 1.A.77.1.4, is connected to the AtpZs (TC no. 1.A.77.2.7) via the IncA Pfam family. IncA proteins are found in chlamydial species (Fields et al., 2002). Most are two TMS proteins, approximately 180 amino acids long, and presently not organized in a clan in Pfam. The scores we observed via IncA were in similarity bands 2 and 3, representing e values in the 0.3 to 0.022, and 0.021 to 0.0016 ranges, respectively. While these scores are not impressive, they highlight a relationship with the IncAs that is confirmed below.
Fig. 6.

Pfam analysis of the MCUs, AtpIs, AtpZs, EukAtpIs and IncAs. The clusters are shown in the figure: MCU (red), AtpZ (yellow), AtpI (blue), EukAtpI (green). The IncA Pfam HMM is indicated with an arrow. The scale used for edge widths indicates similarity. Nodes representing HMMs are shown in a smaller size.
A Pfam analysis of the Mer superfamily (Mok et al., 2012; Yamaguchi et al., 2007) (TC no. 1.A.72) of several two, three and four TMS proteins was completed as a control (Fig. S3). This analysis revealed scores between the Pfam HMMs holding the Mer family together comparable to those obtained for the IncAs and the MCUs, displaying an e value of approximately 0.022. However, no similarity was detected between any member of the Mer superfamily and any member of the MCU superfamily in spite of their similar topologies.
Confirmation of homologous TMSs inside IncAs
The short sequence of an AtpZ (TC no. 1.A.77.2.7) and the IncA HMM from Pfam were examined (Fig. S4). The e value for the full sequence was 0.00085. The hit region was divided into two halves, scoring 0.017 and 0.0011. For the shorter hit region (0.017), a region from 103–119 in IncA’s consensus sequence aligned with 13–29 in the AtpZ sequence. For the longer hit region (0.0011), residues 20–64 in IncA’s consensus sequence (containing two TMSs), aligned with residues 53–97 in the AtpZ sequence (also containing two TMSs).
A long MCU sequence (1.A.77.1.4) and the IncA HMM from Pfam were compared (Fig. S5). There were two hit areas scoring 0.00035 and 0.0039. For the longer hit region (0.00035), positions 103–150 in the IncA consensus sequence aligned with residues 109–156 in this MCU. For the shorter hit region (0.0039), aligning residues 100–136 of the IncA with residues 230–266 of this MCU (1.A.77.1.4), a single TMS PRODIV prediction aligned between these sequences (see Fig. S5).
Based on their relative positions, the region that showed similarity between IncA’s consensus sequence and an MCU homologue of slime mould (TC no. 1.A.77.1.4), suggesting homology, could be extended within the transmembrane region. Using topcons, it was found that the MCU homologue contains two TMSs between residues 167 and 216. This agrees with the relative position of these TMSs in the IncA consensus sequence. To strengthen this argument, we used a sequence-to-sequence alignment in AlignMe PS, using the TMS-containing regions of TC no. 1.A.77.1.4 and the IncA consensus sequence. It should be noted that the overall score is better between the IncAs consensus sequence and that of the MCUs (belonging to score bin 3 rather than score bin 2), despite this similarity.
Protocol 1 and 2 analyses of the IncAs with the MCUs and AtpZs
For an IncA sequence in TCDB (TC no. 9.B.159.8.1), we generated an alignment of homologies with an AtpZ (TC no. 1.A.77.2.7; O05329) (Fig. S6), scoring 10.6 sd. Although the alignment looks good, and the two predicted TMSs align perfectly, the score is insufficient to support the conclusion of homology between AtpZ and IncA.
To extend the region of similarity, for the slime mould MCU sequence, we used hmmemit to generate a consensus sequence from a profile HMM of a Stockholm-formatted alignment of the seed sequences in Pfam’s IncA family. One of the alignments (data not shown) indicated that the TMSs aligned, with a comparison score of 11.8 sd. These results reveal sequence similarity between IncA and members of the AtpZ and MCU families, suggesting, but not establishing, that the IncA family is a member of the MCU superfamily.
For the results in Fig. S7, we used Protocol 1 with a higher threshold (returning up to 5000 sequences) and up to two iterations. We also used a higher threshold for cd-hit (0.99), eliminating only identical sequences. We confirmed the results using gsat with 20 000 random shuffles. Following this protocol, homologues of IncA and MCU gave comparison scores above 12 sd (12.4, using gsat with 20 000 random shuffles). This alignment is 80 residues in length and shows TMSs 2 aligning. This result argues in favour of the conclusion that IncAs are members of the MCU superfamily.
HHrep analysis of domain duplications in AtpI and IncA
Using the HHrep program (http://toolkit.tuebingen.mpg.de/hhrep), we could demonstrate the presence of duplications in the four TMS AtpIs, as well as a four TMS IncA (Fig. 7). Fig. 7(a) shows the diagram for a four TMS AtpI of B. pseudofirmus (TC no. 1.A.77.3.1). Similarly, Fig. 7(b) shows the diagram for a four TMS IncA from Chlamydia trachomatis (TC no. 9.B.159.1.1). The dark diagonal lines represent the proteins themselves, while the parallel lines above these dark lines represent the duplications. The alignments for these two sequences are shown in Fig. S8.
Fig. 7.

HHrep analyses of domain duplications in (a) AtpI and (b) IncA. (a) HHrep diagram of AtpI of B. pseudofirmus (TC no. 1.A.77.3.1) showing that the region including residues 1–60 (TMSs 1–2) is similar to the region of residues 61–130 (TMSs 3–4). (b) HHrep diagram of IncA from C. trachomatis (TC no. 9.B.159.1.1) illustrating how the region containing residues 1–200 (TMSs 1–2) is similar to the region containing residues 201–400 (TMSs 3–4). The dark diagonal lines represent the proteins themselves, while the parallel lines above these dark lines represent the duplications.
Discussion
The statistical analyses presented in this study provide strong evidence that eukaryotic and uncharacterized prokaryotic MCUs, chlamydial IncA, prokaryotic Mg2+ transporters AtpZ and AtpI, and uncharacterized eukaryotic AtpIs, arose from a common ancestor and can therefore be classified within a single superfamily. Phylogenetic analyses revealed three distinct groups within this superfamily: (i) MCU, (ii) IncA, and (iii) a large diverse cluster, including AtpZ, AtpI and EukAtpI (Fig. 1). Although this third cluster is diverse, it is worth noting that within this cluster both the AtpZs and the eukaryotic AtpIs cluster tightly together. The evidence for homology was based on comparison scores using the Superfamily Principle (Tables 1 and 2) (Doolittle, 1994; Saier, 1994), and motif analyses substantiated this conclusion.
MCUs and AtpZs share a two TMS topology, while bacterial and eukaryotic AtpIs share a four TMS topology, and IncAs can have either of these topologies. Through motif analyses, a conserved linker region between these TMS pairs (initially discovered through visualization by the use of AveHAS plots) was found in all proteins in the superfamily. The presence of a conserved motif common to both halves of the four TMS AtpIs, as well as the two TMS AtpZs, provided evidence that the four TMS AtpIs arose via an intragenic duplication event starting with a two TMS precursor. The same was true for four TMS IncAs. However, this was not easily demonstrated for the EukAtpIs, since the common motif between the two halves was not found. It seems that the two halves of the EukAtpIs have diverged in sequence from the primordial sequence, possibly to serve distinct functions. This pathway has also been proposed in a similar study involving four TMS mercuric ion resistance channels (Mok et al., 2012) and the four TMS junctional proteins of animals (A. Lee and M. Saier, unpublished data). In unpublished work, we have identified two-TMS duplicated repeats in several other families as well. It seems clear that duplication of paired TMS hairpins may serve as an important mechanism for the evolution of increased complexity in transport systems. This conclusion is confirmed by the observation that chlamydial IncAs, most of which have two TMSs, can have homologues with two hairpin or three hairpin repeats (see 9.B.159.1.1 and 9.B.159.6.5), respectively).
Conservation of the hairpin structures, including linker regions between the two TMSs, suggests that this hairpin is important for structure and/or function within members of the MCU superfamily. It is possible that the linker region is involved in divalent cation recognition, a primary function of all characterized MCU superfamily proteins. Residue differences in this region undoubtedly account for the differing specificities of these different groups of proteins. We propose that all members of the MCU superfamily, including chlamydial IncA proteins, function by an ion-channel-type mechanism involving oligomeric structures. Why some of the chlamydial IncAs have this hairpin structure repeated, and why these proteins are sometimes (but not always) covalently linked to large hydrophilic protein domains, has yet to be determined. However, many channel proteins form oligomeric structures with the pore in the centre. If this proves to be true for MCU superfamily members, numbers of hairpin structures per subunit would be expected to correlate with decreased numbers of subunits required for pore formation.
Our meme and HMM : HMM comparison results showed that AtpI and AtpZ display motif similarities with a significant probability of homology, confirming the statistical results obtained using Protocols 1 and 2 and the Superfamily Principle. Some of the MCUs were found to be recognized by the Pfam HMM DUF607 (the HMM in Pfam trained on this family of proteins and representing their alignment), which is not organized in a Pfam clan but can be recognized by the characteristic HMM logo, W-x(3)-Ep-x(2)-y. We have introduced a new clan system in Pfam including MCUs, AtpZs, bacterial, archaeal and eukaryotic AtpIs, and IncAs. It is worth reiterating in this regard that the MCUs and AtpZs, via the IncA family in Pfam, gave values comparable to some of the more distant members of the Mer superfamily, some of which displayed even poorer scores, although the interconnectivity of Mer superfamily members is well established (Mok et al., 2012). The AtpZ and MCU (two TMS) sequences that displayed similarity to the IncA HMM showed the greatest similarity in the transmembrane regions of these proteins.
Establishing homology between MCUs, the prokaryotic Mg2+ transporters and IncAs may prove useful in extrapolating structural, functional and mechanistic information from any one protein of the superfamily to the others. However, it is also important to note that this work establishes a link between eukaryotic organellar proteins and their potential prokaryotic predecessors. The conclusion of homology agrees with the similar proposed functions and mechanisms of all these proteins.
Acknowledgements
This work was supported by NIH grant GM077402A1.
Abbreviations:
- HMM
hidden Markov model
- HSP
high-scoring pair
- MCU
mitochondrial calcium uniporter
- TCDB
Transporter Classification Database
- TMS
transmembrane segment
Footnotes
One supplementary table and nine supplementary figures are available with the online version of this paper.
References
- Altschul S. F., Madden T. L., Schäffer A. A., Zhang J., Zhang Z., Miller W., Lipman D. J. (1997). Gapped BLAST and PSI-BLAST: a new generation of protein database search programs. Nucleic Acids Res 25, 3389–3402. 10.1093/nar/25.17.3389 [DOI] [PMC free article] [PubMed] [Google Scholar]
- Bailey T. L., Williams N., Misleh C., Li W. W. (2006). MEME: discovering and analyzing DNA and protein sequence motifs. Nucleic Acids Res 34 (Web Server), W369–W373. 10.1093/nar/gkl198 [DOI] [PMC free article] [PubMed] [Google Scholar]
- Baughman J. M., Perocchi F., Girgis H. S., Plovanich M., Belcher-Timme C. A., Sancak Y., Bao X. R., Strittmatter L., Goldberger O. & other authors (2011). Integrative genomics identifies MCU as an essential component of the mitochondrial calcium uniporter. Nature 476, 341–345. 10.1038/nature10234 [DOI] [PMC free article] [PubMed] [Google Scholar]
- Bick A. G., Calvo S. E., Mootha V. K. (2012). Evolutionary diversity of the mitochondrial calcium uniporter. Science 336, 886. 10.1126/science.1214977 [DOI] [PMC free article] [PubMed] [Google Scholar]
- Chang A. B., Lin R., Studley W. K., Tran C. V., Saier M. H., Jr (2004). Phylogeny as a guide to structure and function of membrane transport proteins. Mol Membr Biol 21, 171–181. 10.1080/09687680410001720830 [DOI] [PubMed] [Google Scholar]
- Chen J. S., Reddy V., Chen J. H., Shlykov M. A., Zheng W. H., Cho J., Yen M. R., Saier M. H., Jr (2011). Phylogenetic characterization of transport protein superfamilies: superiority of SuperfamilyTree programs over those based on multiple alignments. J Mol Microbiol Biotechnol 21, 83–96. 10.1159/000334611 [DOI] [PMC free article] [PubMed] [Google Scholar]
- De Stefani D., Raffaello A., Teardo E., Szabò I., Rizzuto R. (2011). A forty-kilodalton protein of the inner membrane is the mitochondrial calcium uniporter. Nature 476, 336–340. 10.1038/nature10230 [DOI] [PMC free article] [PubMed] [Google Scholar]
- Doolittle R. F. (1994). Convergent evolution: the need to be explicit. Trends Biochem Sci 19, 15–18. 10.1016/0968-0004(94)90167-8 [DOI] [PubMed] [Google Scholar]
- Felsenstein J. (1997). An alternating least squares approach to inferring phylogenies from pairwise distances. Systf Biol 46, 101–111. 10.1093/sysbio/46.1.101 [DOI] [PubMed] [Google Scholar]
- Fields K. A., Fischer E., Hackstadt T. (2002). Inhibition of fusion of Chlamydia trachomatis inclusions at 32 °C correlates with restricted export of IncA. Infect Immun 70, 3816–3823. 10.1128/IAI.70.7.3816-3823.2002 [DOI] [PMC free article] [PubMed] [Google Scholar]
- Fink W. L. (1986). Microcomputers and phylogenetic analysis. Science 234, 1135–1139. 10.1126/science.234.4780.1135 [DOI] [PubMed] [Google Scholar]
- Fitch W. M., Margoliash E. (1967). Construction of phylogenetic trees. Science 155, 279–284. 10.1126/science.155.3760.279 [DOI] [PubMed] [Google Scholar]
- Fu L., Niu B., Zhu Z., Wu S., Li W. (2012). CD-HIT: accelerated for clustering the next-generation sequencing data. Bioinformatics 28, 3150–3152. 10.1093/bioinformatics/bts565 [DOI] [PMC free article] [PubMed] [Google Scholar]
- Hicks D. B., Wang Z., Wei Y., Kent R., Guffanti A. A., Banciu H., Bechhofer D. H., Krulwich T. A. (2003). A tenth atp gene and the conserved atpI gene of a Bacillus atp operon have a role in Mg2+ uptake. Pro3 Natl Acad Sci U S A 100, 10213–10218. 10.1073/pnas.1832982100 [DOI] [PMC free article] [PubMed] [Google Scholar]
- Katoh K., Standley D. M. (2013). MAFFT multiple sequence alignment software version 7: improvements in performance and usability. Mol Biol Evol 30, 772–780. 10.1093/molbev/mst010 [DOI] [PMC free article] [PubMed] [Google Scholar]
- Liu J., Hicks D. B., Krulwich T. A. (2013). Roles of AtpI and two YidC-type proteins from alkaliphilic Bacillus pseudofirmus OF4 in ATP synthase assembly and nonfermentative growth. J Bacteriol 195, 220–230. 10.1128/JB.01493-12 [DOI] [PMC free article] [PubMed] [Google Scholar]
- Mallilankaraman K., Cárdenas C., Doonan P. J., Chandramoorthy H. C., Irrinki K. M., Golenár T., Csordás G., Madireddi P., Yang J. & other authors (2012). MCUR1 is an essential component of mitochondrial Ca2+ uptake that regulates cellular metabolism. Nat Cell Biol 14, 1336–1343. 10.1038/ncb2622 [DOI] [PMC free article] [PubMed] [Google Scholar]
- Marchi S., Pinton P. (2013). Mitochondrial calcium uniporter, MiRNA and cancer: live and let die. Commun Integr Biol 6, e23818. 10.4161/cib.23818 [DOI] [PMC free article] [PubMed] [Google Scholar]
- Marchi S., Pinton P. (2014). The mitochondrial calcium uniporter complex: molecular components, structure and physiopathological implications. J Physiol 592, 829–839. 10.1113/jphysiol.2013.268235 [DOI] [PMC free article] [PubMed] [Google Scholar]
- Mok T., Chen J. S., Shlykov M. A., Saier M. (2012). Bioinformatic analyses of bacterial mercury ion (Hg2+) transporters. Water Air Soil Pollut 223, 4443–4457. 10.1007/s11270-012-1208-3 [DOI] [Google Scholar]
- Page R. D. M. (2002). Visualizing phylogenetic trees using TreeView. In Current Protocols in Bioinformatics, chapter 6, unit 6.2, pp. 6.2.1–6.2.15. 10.1002/0471250953.bi0602s01 [DOI] [PubMed] [Google Scholar]
- Reddy V. S., Saier M. H., Jr (2012). BioV Suite–a collection of programs for the study of transport protein evolution. FEBS J 279, 2036–2046. 10.1111/j.1742-4658.2012.08590.x [DOI] [PMC free article] [PubMed] [Google Scholar]
- Reddy B. L., Saier M. H., Jr (2013). Topological and phylogenetic analyses of bacterial holin families and superfamilies. Biochim Biophys Acta 1828, 2654–2671. 10.1016/j.bbamem.2013.07.004 [DOI] [PMC free article] [PubMed] [Google Scholar]
- Reddy V. S., Shlykov M. A., Castillo R., Sun E. I., Saier M. H., Jr (2012). The major facilitator superfamily (MFS) revisited. FEBS J 279, 2022–2035. 10.1111/j.1742-4658.2012.08588.x [DOI] [PMC free article] [PubMed] [Google Scholar]
- Ronzone E., Paumet F. (2013). Two coiled-coil domains of Chlamydia trachomatis IncA affect membrane fusion events during infection. PLoS ONE 8, e69769. 10.1371/journal.pone.0069769 [DOI] [PMC free article] [PubMed] [Google Scholar]
- Saier M. H., Jr (1994). Computer-aided analyses of transport protein sequences: gleaning evidence concerning function, structure, biogenesis, and evolution. Microbiol Rev 58, 71–93. [DOI] [PMC free article] [PubMed] [Google Scholar]
- Saier M. H., Jr, Yen M. R., Noto K., Tamang D. G., Elkan C. (2009). The Transporter Classification Database: recent advances. Nucleic Acids Res 37 (Database), D274–D278. 10.1093/nar/gkn862 [DOI] [PMC free article] [PubMed] [Google Scholar]
- Sait M., Livingstone M., Clark E. M., Wheelhouse N., Spalding L., Markey B., Magnino S., Lainson F. A., Myers G. S. A., Longbottom D. (2014). Genome sequencing and comparative analysis of three Chlamydia pecorum strains associated with different pathogenic outcomes. BMC Genomics 15, 23. 10.1186/1471-2164-15-23 [DOI] [PMC free article] [PubMed] [Google Scholar]
- Sancak Y., Markhard A. L., Kitami T., Kovács-Bogdán E., Kamer K. J., Udeshi N. D., Carr S. A., Chaudhuri D., Clapham D. E. & other authors (2013). EMRE is an essential component of the mitochondrial calcium uniporter complex. Science 342, 1379–1382. 10.1126/science.1242993 [DOI] [PMC free article] [PubMed] [Google Scholar]
- Suchland R. J., Jeffrey B. M., Xia M., Bhatia A., Chu H. G., Rockey D. D., Stamm W. E. (2008). Identification of concomitant infection with Chlamydia trachomatis IncA-negative mutant and wild-type strains by genomic, transcriptional, and biological characterizations. Infect Immun 76, 5438–5446. 10.1128/IAI.00984-08 [DOI] [PMC free article] [PubMed] [Google Scholar]
- Thompson J. D., Gibson T. J., Plewniak F., Jeanmougin F., Higgins D. G. (1997). The CLUSTAL_X windows interface: flexible strategies for multiple sequence alignment aided by quality analysis tools. Nucleic Acids Res 25, 4876–4882. 10.1093/nar/25.24.4876 [DOI] [PMC free article] [PubMed] [Google Scholar]
- Tusnády G. E., Simon I. (1998). Principles governing amino acid composition of integral membrane proteins: application to topology prediction. J Mol Biol 283, 489–506. 10.1006/jmbi.1998.2107 [DOI] [PubMed] [Google Scholar]
- Umeki S., Satoh T., Ueda S. (1985). Alterations in serum pancreatic elastase 1 content in acute and chronic pancreatitis: comparison with alpha-amylase activity. J Lab Clin Med 106, 578–582. [PubMed] [Google Scholar]
- Wong F. H., Chen J. S., Reddy V., Day J. L., Shlykov M. A., Wakabayashi S. T., Saier M. H., Jr (2012). The amino acid-polyamine-organocation superfamily. J Mol Microbiol Biotechnol 22, 105–113. 10.1159/000338542 [DOI] [PubMed] [Google Scholar]
- Yamaguchi A., Tamang D. G., Saier M. H., Jr (2007). Mercury transport in bacteria. Water Air Soil Pollut 182, 219–234. 10.1007/s11270-007-9334-z [DOI] [Google Scholar]
- Yee D. C., Shlykov M. A., Västermark A., Reddy V. S., Arora S., Sun E. I., Saier M. H., Jr (2013). The transporter-opsin-G protein-coupled receptor (TOG) superfamily. FEBS J 280, 5780–5800. 10.1111/febs.12499 [DOI] [PMC free article] [PubMed] [Google Scholar]
- Yen M. R., Choi J., Saier M. H., Jr (2009). Bioinformatic analyses of transmembrane transport: novel software for deducing protein phylogeny, topology, and evolution. J Mol Microbiol Biotechnol 17, 163–176. 10.1159/000239667 [DOI] [PMC free article] [PubMed] [Google Scholar]
- Yen M. R., Chen J. S., Marquez J. L., Sun E. I., Saier M. H. (2010). Multidrug resistance: phylogenetic characterization of superfamilies of secondary carriers that include drug exporters. Methods Mol Biol 637, 47–64. 10.1007/978-1-60761-700-6_3 [DOI] [PubMed] [Google Scholar]
- Zhai Y., Saier M. H., Jr (2001a). A web-based program for the prediction of average hydropathy, average amphipathicity and average similarity of multiply aligned homologous proteins. J Mol Microbiol Biotechnol 3, 285–286. [PubMed] [Google Scholar]
- Zhai Y., Saier M. H., Jr (2001b). A web-based program (WHAT) for the simultaneous prediction of hydropathy, amphipathicity, secondary structure and transmembrane topology for a single protein sequence. J Mol Microbiol Biotechnol 3, 501–502. [PubMed] [Google Scholar]