

Abstract
Peppy, the proteogenomic/proteomic search software, employs a novel method for assessing the match quality between an MS/MS spectrum and a theorized peptide sequence. The scoring system uses three score factors calculated with binomial probabilities: the probability that a fragment ion will randomly align with a peptide ion; the probability that the aligning ions will be selected from the set of most intense peaks; and the probability that the intensities of fragment ions identified as y-ions are greater than those of their counterpart b-ions. The scores produced by the method act as global confidence scores, which facilitate the accurate comparison of results and the estimation of false discovery rates. Peppy has been integrated into the meta-search engine PepArML to produce meaningful comparisons with Mascot, MSGF+, OMSSA, X!Tandem, k-Score and s-Score. For two of the three the data sets examined with the PepArML analysis, Peppy exceeded the accuracy performance of the other scoring systems; for the third set Peppy was outperformed only by MSGF+.
Keywords: MS/MS, tandem mass spectrometry, protein identification, PSM
Introduction
Software tools used to assign peptide sequences to MS/MS spectra are a staple of proteomics research. This variety of software includes commercial offerings such as Mascot1 and freely available options such as MSGF+2, OMSSA3 and X!Tandem4. The peptide identification process employed by these tools is commonly accomplished via comparing a set of spectra to a list of theoretical peptides derived from a database of proteins. Central to this process is the peptide/spectrum match (PSM) scoring function that provides a numerical score quantifying the quality of alignment between the observed fragment ions of a spectrum and the ions theorized to be produced by a given peptide. One major benefit of a software system giving numerical scores to PSMs based on match quality is that hundreds or thousands of potential peptide matches for a spectrum can be reduced to the most promising candidates in a manner that is fast, consistent and unbiased. These scores can further act as a convenient axis for result comparison, result integration, and statistical analysis for assessment of veracity.
We have previously described Peppy, a peptide identification software built to easily handle searching six-frame translations of genomes5. Given that the protein-coding portion of a genome is typically a small percentage of the entire nucleotide sequence6, a peptide database generated from a full, six-frame translation of a genome can be hundreds of times larger than one derived from a reference protein database. To effectively search these large-cardinality databases, we have developed a scoring system that possesses these four characteristics: (i) Fast execution: To ensure that a search of a large database is completed in a reasonable amount of time, the method should exhibit low computational complexity. Ideally, this would feature low-order polynomial-time execution, and consist of fast operations or cacheable values. (ii) High accuracy: The necessary accuracy to discriminate among the many potential false positives in a six-frame database is a large concern in proteogenomic searching. Most of what is translated in silico to produce a six-frame database is not translated in vivo; these databases therefore have a very high saturation of null peptides. This creates a higher likelihood of a spectrum having deceptively good, incorrect match. False matches can be alleviated with a scoring function that tends to present good score separation between true positives and false positives. (iii) Global confidence: Scoring systems such as SEQUEST7 are spectrum-based, heuristic8 methods. A PSM score of 5 for one spectrum may possess the same level of confidence of the peptide assignment as a PSM score of 6 for another spectrum due simply to the fact that the second spectrum's peptide is longer. Heuristic methods typically require a form of post-analysis, such as E values9, so that results can be meaningfully compared. For global confidence scores, if score A and score B are equal, then equal levels of confidence are assigned to those two PSMs. Global confidence scores enable all PSMs to be sorted in order of confidence and for false discovery rate (FDR) thresholds to be estimated. (iv) Mass-accuracy independent: Wenger and Coon10 suggest that high-accuracy mass spectrometry is reducing the need for complex scoring functions. This they demonstrate using a PSM scoring method that outperforms several scoring systems with a simple method that is little more than a matched peak count. This work makes clear that scoring algorithms should take advantage of high mass-accuracy spectra when it is available as it will improve the discrimination of all scores, even naïve ones. However, while the accuracy of mass spectrometers is continually improving, this does not obviate the need to identify peptides within low mass-accuracy spectra. Legacy data or new data produced from non-cutting-edge machines can contain valuable results that await proper identification.
Materials and Methods
Peppy's scoring system consists of multiple estimated p-values that are deterministic calculations of the probability that a peptide's theoretical ions would randomly align with the peaks of a spectrum with the observed quality. The final score is comprised of three discrete probability factors: (A) the probability that theoretical ions will randomly align with spectral peaks; (B) the probability that theoretical ions will align with high intensity spectral peaks; and (C) the probability that spectral peaks that align with theoretical y-ions would, by chance, be more intense than their counterpart b-ions.
A: Peak match probability
For any given peptide/spectrum pairing, some ion products may align despite the pairing being false. This incorrect pairing could be due to factors such as matching similar sequences (e.g. peptide GGGGKR will share many ions with GGGGRK) or purely random alignments – that is to say, though a theoretical ion from a peptide sequence may have a very similar mass to a fragment ion, the molecule that produced the product measurement is not necessarily equivalent to that of the theorized ion. Many PSMs will have at least one matching ion between their peptide and spectrum (e.g. trypsin-cleaved peptides with a C-terminal lysine will share y1 ions). Some matches will have many ion alignments but still be false. The aim of the first component of Peppy's scoring system is to find the probability that the number of aligning ions occurred by chance.
Inaccuracies in measuring fragment masses necessitates defining error tolerance windows so that a fragment ion is said to match to a theoretical ion if its observed mass falls within a limited range of the fragment. When the error tolerance windows of all fragment ions are combined (minus overlapping window regions), an “area” of alignment is created. This area, when taken as a percentage of the overall precursor value, is the probability for any one theoretical ion to find a random match. An example of a combined fragment tolerance area is represented with the shaded area in panel “a” of Figure 1; if a theoretical ion falls within the shaded area, it is considered a match to a fragment ion. Panel “b” of the figure likens the theoretical ions to arrows and the combined area defined by error windows to the size of a bull's-eye. Increasing the error tolerance is akin to increasing the radius of the bull's-eye, thus increasing the chance for randomly shot arrows to successfully hit the target. This approach ignores the complexities inherent in fragmentation patterns in favor of a schema more easily modelable; however, it provides a decent estimation for chance alignment probability and a good starting point as the first of the three probabilistic components of the scoring system. Because the area is directly related to the maximum fragment error allowed, better mass accuracy will result in a lower probability of random alignment.
Figure 1.
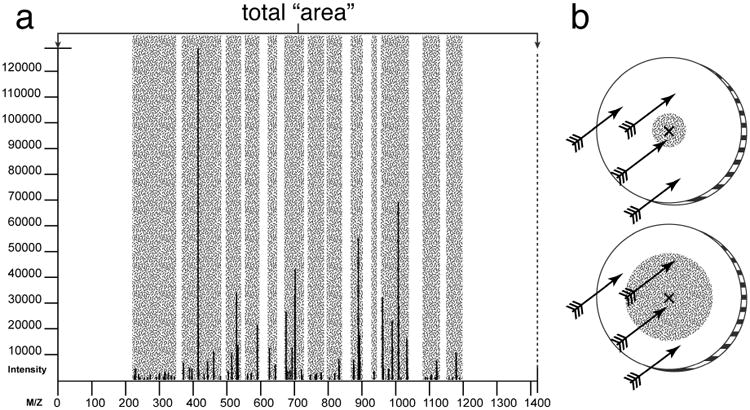
Peak coverage of an MS/MS spectrum. Panel “a” shows a spectrum coverage “area”; the gray shading represents the area covered when fragment tolerance is taken into account. (For illustrative purposes, the fragment tolerance represented in this figure is exaggerated far beyond what is appropriate for a modern mass spectrometer. Panel “b” represents peak coverage with varying error tolerances to targets with varying bull's-eye radii.
Let n be the total number of theoretical b- and y-ions, which is given by 2 * (the number of amino acids in the peptide - 1). Let k be the size of the subset of theorized ions that have product matches. Let p be the summed fragment error windows expressed as a percentage of the precursor mass. With these values in hand, a summation of binomial probabilities is used to calculate the p-value that k or more peaks would fall in the region(s) matching theoretical fragment m/z values:
This value is set to 1 if k < n * p. This method, as is or with slight variations, is relatively common11 for calculating alignment probabilities. It should be noted that due to the fact that the value for p is directly tied to the fragment tolerance, a PSM's score would vary depending on this setting. This score variation is true even if the exact same number of theoretical and observed ions align for two different fragment tolerances, so caution should be taken when comparing search results of the same spectral set that used different fragment tolerances for the peptide identification.
B: Intensity match probability
Considering the intensity of matched spectral peaks has been shown to be effective in determining the quality of a PSM7, 12. The second factor of Peppy's score is the probability of theoretical ions randomly aligning with peaks of high intensity. The intensity value of a peak corresponds to the abundance of ions at that mass observed by the tandem mass spectrometer. Due to the fact that the fragmentation process often breaks peptides along their peptide bonds, this will tend to produce mainline b- and y-ions with greater abundance than other peaks. Therefore, aligning peaks of high abundance with predicted b- and y-ion masses is a good indicator of veracity.
Following this logic, the second score factor depends on the number of theoretical ions that match spectral peaks of high intensity. If peak matches are the product of chance alignments, then it follows that only ∼50% of the peaks should be above the median intensity. The probability that the alignment of the PSM is the product of a random event diminishes as the number of matching peaks with intensities greater than the median increases. To find this probability, the Peppy algorithm takes the peaks of a spectrum and reorders those peaks from least intense to most intense, as illustrated by arranging the peaks of the example PSM shown in Figure 2 to the order in Figure 3. Peppy finds the median intensity of that peak list (m1) and tallies all of the aligning peaks above that median intensity. The same binomial probability summation formula is used as above, where n = the total number of theoretical ions that align with spectral peaks, k = the number of matched peaks above the median intensity, and p = 0.5.
Figure 2.
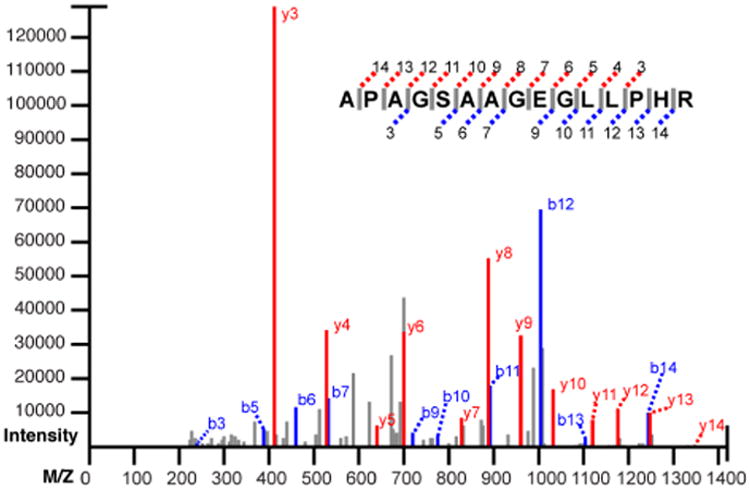
Example PSM. The spectrum of Figure 1 has been matched to the predicted b- and y-ions of the peptide APAGSAAGEGLLPHR.
Figure 3.
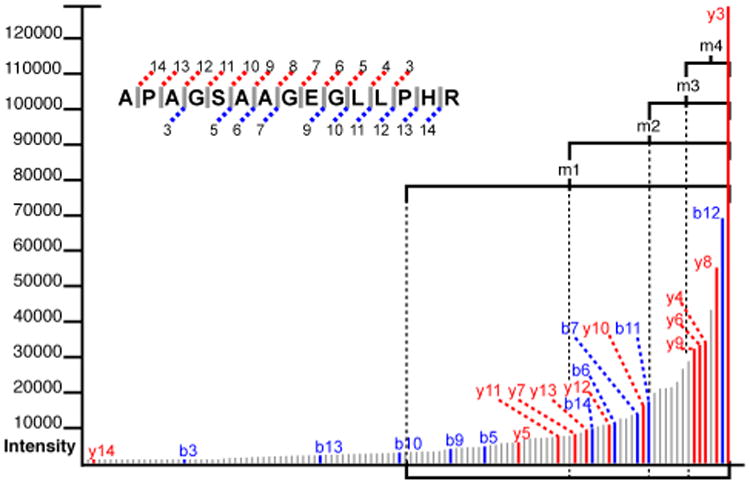
Medians above medians. Here the fragment ions of Figure 2 have been arranged in order of intensity. The peaks matching to the theorized peptide sequence have been labeled. This figure illustrates the heuristic that true alignments tend to occur with peaks of greater abundance. Here, m1, m2, m3 and m4 denote the peaks with abundances in the top 50%, 25%, 12,5% and 6.25%, respectively.
The result of this function provides an adequate estimation of the probability of theoretical ions randomly matching to highly intense spectral peaks; however, it does not significantly reward for matches with the most intense peaks. Therefore Peppy further exploits the power of the median in a series of successive iterations of the formula in a method akin to the intensity classification of the MyriMatch algorithm13. After m1 is calculated, Peppy finds the median above the median (m2), denoting the top 25% of most intense peaks; then it takes the set of aligning peaks above m1, and finds how many of those lie above m2. This produces another probability by the same binomial formula, where n = the number of aligning peaks found above m1, k = the number of aligning peaks found above m2 and p = 0.5. This process is repeated for m3 (the median above m2) and m4 (the median above m3), where m4 represents the subset of aligning peaks with the highest intensities. These iterations produce four probability values, one for each of the medians, that are multiplied together to derive one probability factor that assesses intensity alignment quality. This is given by:
where s(ma) is the set of all theoretical ions that match to peaks above median ma. s(m0) is the set of all theoretical ions that match to any peak in the spectrum. Because the multiplicatively combined p-values of this stage are not independent, the final result is not classifiable as a p-value and we are therefore terming the value a “score”.
C: Paired ion relative intensity probability
Peppy's final scoring factor is the calculated probability that the spectrum's matched y-ions would, by chance, be more intense than its b-ions. A mass spectrometer that uses collision-induced dissociation (CID) will produce a spectrum, for tryptic peptides, where y-ions tend to be present in higher abundance than their b-ion counterparts, due to the basic Arg or Lys at the C-terminus. This factor finds the p-value that, given a set of b/yion pairs, the number of pairs with more intense y-ions would randomly occur.
The theoretical y- and b-ions that aligned with spectral peaks were already identified in the stage that calculated the peak match probability (the first stage of the probability scoring). In this step, Peppy compares each peak that aligned with a theoretical y-ion to the peak that aligned with its theoretical b-ion counterpart. The pairing of the counterpart ions of Figure 2 is illustrated in Figure 4. If a theoretical y-ion does not have a b-ion counterpart, Peppy considers the y-ion more intense than the bion. Conversely, if the b-ion is present but the y-ion is absent, Peppy considers the bion to be more intense than the y-ion. If the peak matches are a product of chance, the probability that the y-ion peak is more intense than the b-ion peak is 50%. Peppy computes the probability of the number of y-ion dominating pairs using the same binomial probability formula, where n = the number of theoretical y-ions, k = the number of y-ions that were more intense than their counterpart b-ions, and once again, p = 0.5. Note that if y-ions do not tend to be more intense than their counterpart b-ions (for example, if a mass spectrometer does not produce spectra with higher-intensity y-ions vs. b-ions), this probability factor does not punish the spectra for not having this characteristic – it only rewards for it being the case.
Figure 4.
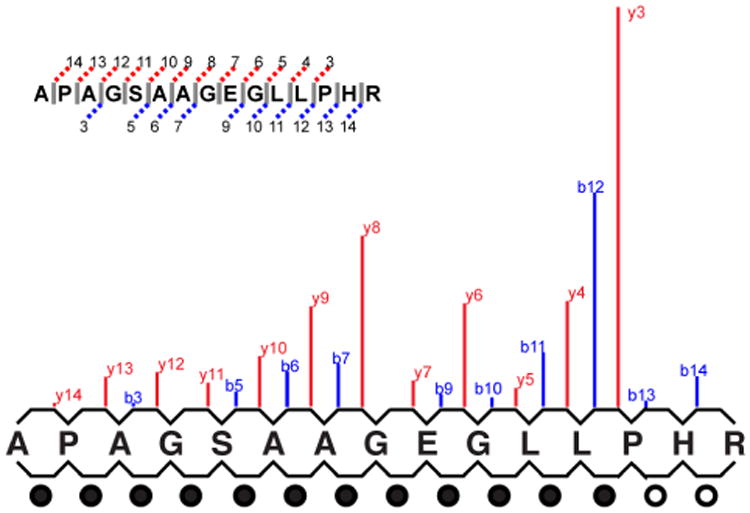
Relative b- and y-ion intensities. This figure presents a “paired layout” where the matching ions from Figure 2 have been arranged so that matched b-ions have been paired with their y-ion counterparts. Pairs where the y-ion dominates the b- are noted with filled circles on the bottom row.
Optimization
The fact that both the intensity match probability and the paired ion relative intensity probability always use 0.5 as the value for p when calculating the binomial probability provides an opportunity to optimize performance. In the Peppy implementation of the algorithm, the software pre-calculates the B(n,k,0.5) for all practical values of n and k and stores these values in a look-up table. Additionally, certain values can be calculated once for a spectrum and stored with that data object to avoid unnecessary recalculation. These values include the coverage area for probability factor A and the intensity values m1 through m4 for probability factor B.
Peppy's final score
The final Peppy score is found by multiplying the three probability values defined above. The multiplicative combination, if for a true positive, will produce a very small fraction whose quality is largely determined by the magnitude of the negative exponent. Thus the final score is calculated as:
where A, B and C are the three probability values. This final step is essentially cosmetic as it enhances readability, conforms to the familiar trope that ‘larger values are better’ and allows scores to be easily compared with scores from other systems such as Andromeda11a or Mascot1.
Worked example
To demonstrate the process by which this system produces a score, we will calculate Peppy's score for the match quality of the peptide APAGSAAGEGLLPHR with the spectrum depicted in the figures. The mainline b- and y-ions that align between the peptide and the spectrum are highlighted in Figure 2. The peptide sequence length is 15 acids; the number of theoretical ions the scoring system considers is 2 * (15 – 1), which is 28. In Figure 2, 22 of the theoretical ions align with ions of the spectrum. The fragment error tolerance used for ion alignment was 200 PPM, which produced a coverage area for the spectrum of 2.54%. This provided an estimate that given any randomly generated theoretical ion, there was a 2.54% chance for aligning with a fragment ion. The probability that 22 (or more) of the possible 28 theoretical ions would randomly align is given by B(28, 22, .0254) ≈ 2.71E-30. For the intensity match probability, it is shown in Figure 3 that of the 22 matching peaks, 18 are above the median. The probability of this occurring by chance is given by B(22,18,0.5) ≈ 0.0022. When peaks above the median are taken as a subset, this subset has a median at m2. Of the 18 matching peaks that are in this subset, 14 are above the median, the odds of which are B(18,14,0.5) ≈ 0.015. This process is repeated for m3 and m4 producing probabilities of B(14,6,0.5) = 1 and B(6,6,0.5) ≈ 0.016 respectively. The final intensity coefficient is the multiplicative combination of the values found for the four medians which ≈ 5.24E-7. To find the relative b- and y-ion intensity score, of the 14 ion pairs (illustrated in Figure 4), 12 have y-ions that present with greater intensity than their sibling b-ion (represented in the figure by the filled circles on the bottom row). The probability of this scenario, or a more extreme value, occurring randomly is given by B(14,12,0.5) ≈ 0.0065. Finally we multiplicatively combine the three score factors: 2.71E-30 * 5.24E-7 * 0.0065 ≈ 9.24E-39. The final score is –log10(9.24E-39) ≈ 38.03.
Experimental Section
To facilitate a comparison of the performance of Peppy's scoring method to that of other peptide identification systems, the Peppy search engine was integrated with the PepArML14 meta-search engine. PepArML provides a unified search interface for a variety of search engines and a search engine agnostic results combiner using the same decoy-based FDR estimation technique for all search engines. As such, it provides an excellent platform for comparing search engines' peptide identification performance in as close to an apples-to-apples manner as possible.
The public PepArML meta-search platform supports Mascot1; X!Tandem4 with native, k-score15, and s-score scoring; OMSSA3; MSGF+2 and Peppy integrated for the purpose of this evaluation — reformatting spectral data as needed and constructing search configurations for each search engine on the fly to ensure consistent and repeatable search results across spectral data files, search configurations, and search engines. Searches were performed against the UniProtKB/Swiss-Prot protein database without regard to taxonomy. Spectra were automatically formatted and enumerated for each search engine to ensure reliable and consistent spectrum identifier tracking, 13C isotope peak precursor correction-enumeration, and, when necessary, charge-state correction and enumeration to ensure the spectra searched by each engine are consistent. The same decoy database, representing reversed target sequences, was searched by each search engine—instead of relying on internal search engine decoy algorithms, which ensures the target and decoy sequences evaluated were consistent. Finally, the same FDR procedure was used to estimate the statistical significance of each search engines' peptide identifications. The FDR estimation procedure first merged the target and decoy peptide identifications, selected the highest ranking peptide identification per spectrum, tabulated the number of rank 1 target and decoy hits at each score, and computed the q-value curve based on the cumulative number of target and decoy hits at each score16.
Despite these efforts to create apples-to-apples comparisons of search engines, it is impossible to match each search engine's parameters to each other perfectly. Peppy requires precursor and fragment tolerances be specified in units of parts-per-million (ppm), while OMSSA supports the specification of these tolerances in Daltons (Da) only, and Mascot supports fragment tolerances only in absolute units (Da and mmu). Furthermore, the search engines differ in terms of specifying instrument type and expected fragmentation characteristics, with Mascot providing a variety of generic instrument types (ESI-TRAP, MALDI-TOF-TOF, ESI-FTICR) and Peppy, OMSSA and X!Tandem requiring no such parameter. Lastly, search engines sometimes interpret the same conceptual parameter settings differently. For example, Mascot considers peptides from the N-terminal of the protein to be trypsin-specific even with the initial Met removed, and some search engines consider the precursor tolerance with respect to m/z units rather than in units of mass. We made a best effort to configure each search engine appropriately and to match the search parameters as closely as possible. In the case of mass tolerances, we used ppm-based tolerances wherever possible, converting to absolute mass units at 1000 Da as necessary – for example, 50ppm was substituted with 0.05 Da.
Data Sets
The following sets of MS/MS spectra were used by PepArML to compare algorithm performance:
S17 - 1,389 MS/MS spectra from the Sashimi project data repository (http://sashimi.sourceforge.net) data set 17mix_test2, representing a tryptic digest of 17 standard proteins, analyzed using an electrospray ionization quadrupole time-of-flight mass spectrometer (Q-TOF Ultima) (Micromass/Waters, Manchester, United Kingdom). The S17 data set contains 241 (17.35%) true positive spectra assignable to peptides from the expected or contaminant proteins.
CPTAC1 – 2,000 MS/MS spectra were randomly selected from a spectral set gathered, as described by Harsha Gunawardena17, “in a data-dependent manner on a Q Exactive mass spectrometer (Thermo Fisher Scientific, San Jose, CA) in high resolution (high-high mode of operation). For example, a full scan mass analysis on an Orbitrap (externally calibrated to a mass accuracy of < 1 ppm, and resolution of 75,000) was followed by intensity-dependent HCD-MS/MS of the top 20 most abundant peptide ions at 17,500 resolution. The MS/MS acquisition of a precursor m/z was repeated for 30 s and subsequently excluded for 60 s. Monoisotopic precursor ion selection and charge state screening was enabled for triggering data-dependent MS/MS scans.”
CPTAC2 – 2,000 MS/MS spectra were randomly selected from a spectral set gathered from a quadrupole time-of-flight AB Sciex Triple TOF 5600 mass spectrometer using a data-dependent method, acquiring MS1 and MS2 spectra at 20 Hz acquisition speeds. The mass spectrometer was interfaced to an Eksigent 2D nano capillary pump. The columns were housed in an Eksigent Nanoflex module with two 200μM × 15cm CHIP cartridges in series. The peptides were eluted with an acetonitrile gradient over 160 min.
Trypsin was used as the proteolytic enzyme for all proteomic samples in all data sets. CPTAC data was gathered from global proteomic analyses of human-in-mouse tumor xenografts. The full array of CPTAC data, as well as detailed descriptions of the sample preparation and LC-MS/MS processes, are available from cptac-data-portal.georgetown.edu.
Results and Discussion
Q-value curves showing the performance of the seven scoring systems on the three data sets are provided in Figure 5. Many researchers are interested in the number of spectra identified at the 1% FDR, so we closely examined the performance of the scoring systems at that threshold (Table 1). Of the seven scoring systems, Peppy had the most positive spectral identifications at the 1% FDR for two of the three data sets examined (S17, CPTAC2). For S17, Peppy identified ∼18% more spectra than the runner-up, MSGF+. With CPTAC2, Peppy made only ∼3% more identifications than the second-place results from MSGF+. With the CPTAC1 data set, Peppy placed second to MSGF+, identifying ∼23% fewer spectra. These results demonstrate that Peppy's scoring system fulfills the “high accuracy” and “mass-accuracy independent” goals described in the introduction, at least for data sets possessing the characteristics of those examined.
Figure 5.
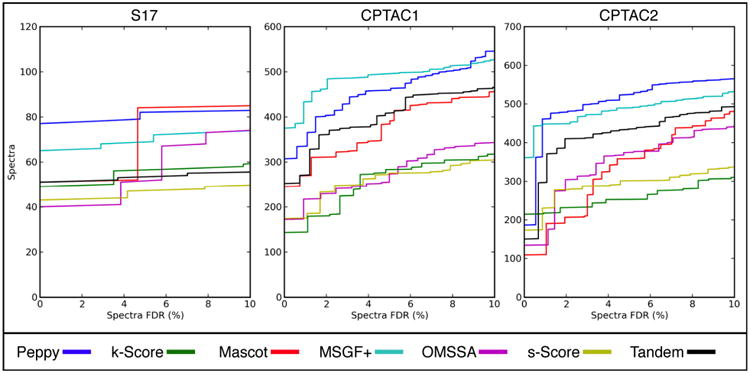
Q-value curves output by PepArML. These charts show the performance of the seven search engines evaluated with the three test data sets. Here the number of spectra positively identified is a function of the false discovery rate. Set S17 contains a lower percentage of identifiable true positives; there is therefore less granularity.
Table 1.
Tabular summary of the number of spectra identified at the 1% FDR for the three data sets using seven search engines coordinated by PepArML. Columns denote the scoring algorithm employed; rows denote the data set being evaluated. The performance rank for the given scoring system for the given data set is noted parenthetically.
| Peppy | k-Score | Mascot | MSGF+ | OMSSA | s-Score | Tandem | |
|---|---|---|---|---|---|---|---|
| S17 | 77 (1) | 49 (4) | 51 (3a) | 65 (2) | 40 (6) | 43 (5) | 51 (3b) |
| CPTAC1 | 334 (2) | 143 (7) | 269 (4) | 433 (1) | 217 (5) | 174 (6) | 270 (3) |
| CPTAC2 | 461 (1) | 217 (5) | 109 (7) | 448 (2) | 134 (6) | 230 (4) | 296 (3) |
Our primary goal with Peppy was to develop a system that could easily handle proteogenomic searches. When creating the scoring system component, it was our hope to create one that was at least on par with those widely used. Based on these results, it is fair to say that this goal was achieved. Peppy, including the implementation of this scoring method, is an open source project. The scoring system objects are designed so that additional scoring systems can be added and easily selected at runtime via a simple properties file. Based on our tests and those performed by others10, it is clear that while certain scoring systems consistently perform very well relative to other systems, no one scoring system is unvaryingly the best. In fact, it could be argued that for any given set of spectra, a specialized scoring system could be constructed that would outperform all other systems. Thus facilitating easily switching between scoring systems is an effort to address this phenomenon of heterogeneous optimal identification methods. Our hope is that the openness of this project will foster improvements to this scoring system and the addition of others as knowledge and research trends in proteomics advances.
Availability
The Peppy source code, compiled executable, documentation, PepArML parameters and PepArML results are available at http://geneffects.com/peppy.
Supplementary Material
Acknowledgments
This research was made possible by grants R01 HG003700 to Morgan Giddings (MG), 1RC2 HG005591-01 to MG, and U24 CA160035 to MG as co-PI. The authors wish to thank Reid Townsend, Matthew Ellis and David Tabb for assistance with the CPTAC2 data; Christopher Kinsinger and Karen Ketchum for assistance with CPTAC data access and Wendy Spitzer for editorial help with the manuscript.
References
- 1.Perkins DN, Pappin DJ, Creasy DM, Cottrell JS. Probability-based protein identification by searching sequence databases using mass spectrometry data. Electrophoresis. 1999;20(18):3551–67. doi: 10.1002/(SICI)1522-2683(19991201)20:18<3551::AID-ELPS3551>3.0.CO;2-2. [DOI] [PubMed] [Google Scholar]
- 2.Kim S, Pevzner PA. MS-GF+: Universal Database Search Tool for Mass Spectrometry. submitted. [Google Scholar]
- 3.Geer LY, Markey SP, Kowalak JA, Wagner L, Xu M, Maynard DM, Yang X, Shi W, Bryant SH. Open mass spectrometry search algorithm. J Proteome Res. 2004;3(5):958–64. doi: 10.1021/pr0499491. [DOI] [PubMed] [Google Scholar]
- 4.Craig R, Beavis RC. TANDEM: matching proteins with tandem mass spectra. Bioinformatics. 2004;20(9):1466–7. doi: 10.1093/bioinformatics/bth092. [DOI] [PubMed] [Google Scholar]
- 5.Risk B, Spitzer WJ, Giddings MC. Peppy: proteogenomic search software. J Proteome Res. 2013 doi: 10.1021/pr400208w. submitted. [DOI] [PMC free article] [PubMed] [Google Scholar]
- 6.Bernstein BE, Birney E, Dunham I, Green ED, Gunter C, Snyder M. An integrated encyclopedia of DNA elements in the human genome. Nature. 2012;489(7414):57–74. doi: 10.1038/nature11247. [DOI] [PMC free article] [PubMed] [Google Scholar]
- 7.Eng J, McCormack A, Yates J. An Approach to Correlate Tandem Mass Spectral Data of Peptides with Amino Acid Sequences in a Protein Database. J Am Soc Mass Spectrom. 1994;5(11):976–989. doi: 10.1016/1044-0305(94)80016-2. [DOI] [PubMed] [Google Scholar]
- 8.Kapp EA, Schutz F, Connolly LM, Chakel JA, Meza JE, Miller CA, Fenyo D, Eng JK, Adkins JN, Omenn GS, Simpson RJ. An evaluation, comparison, and accurate benchmarking of several publicly available MS/MS search algorithms: Sensitivity and specificity analysis. Proteomics. 2005;5(13):3475–3490. doi: 10.1002/pmic.200500126. [DOI] [PubMed] [Google Scholar]
- 9.Fenyo D, Beavis RC. A method for assessing the statistical significance of mass spectrometry-based protein identifications using general scoring schemes. Anal Chem. 2003;75(4):768–74. doi: 10.1021/ac0258709. [DOI] [PubMed] [Google Scholar]
- 10.Wenger CD, Coon JJ. A proteomics search algorithm specifically designed for high-resolution tandem mass spectra. J Proteome Res. 2013;12(3):1377–86. doi: 10.1021/pr301024c. [DOI] [PMC free article] [PubMed] [Google Scholar]
- 11.(a) Cox J, Neuhauser N, Michalski A, Scheltema RA, Olsen JV, Mann M. Andromeda: a peptide search engine integrated into the MaxQuant environment. J Proteome Res. 2011;10(4):1794–805. doi: 10.1021/pr101065j. [DOI] [PubMed] [Google Scholar]; (b) Beausoleil SA, Villen J, Gerber SA, Rush J, Gygi SP. A probability-based approach for high-throughput protein phosphorylation analysis and site localization. Nature biotechnology. 2006;24(10):1285–92. doi: 10.1038/nbt1240. [DOI] [PubMed] [Google Scholar]
- 12.(a) Narasimhan C, Tabb DL, Verberkmoes NC, Thompson MR, Hettich RL, Uberbacher EC. MASPIC: intensity-based tandem mass spectrometry scoring scheme that improves peptide identification at high confidence. Anal Chem. 2005;77(23):7581–93. doi: 10.1021/ac0501745. [DOI] [PubMed] [Google Scholar]; (b) Li W, Ji L, Goya J, Tan G, Wysocki VH. SQID: an intensity-incorporated protein identification algorithm for tandem mass spectrometry. J Proteome Res. 2011;10(4):1593–602. doi: 10.1021/pr100959y. [DOI] [PMC free article] [PubMed] [Google Scholar]; (c) Xu H, Freitas MA. MassMatrix: a database search program for rapid characterization of proteins and peptides from tandem mass spectrometry data. Proteomics. 2009;9(6):1548–55. doi: 10.1002/pmic.200700322. [DOI] [PMC free article] [PubMed] [Google Scholar]
- 13.Tabb DL, Fernando CG, Chambers MC. MyriMatch: highly accurate tandem mass spectral peptide identification by multivariate hypergeometric analysis. J Proteome Res. 2007;6(2):654–61. doi: 10.1021/pr0604054. [DOI] [PMC free article] [PubMed] [Google Scholar]
- 14.Edwards N, W X, Tseng CW. An unsupervised, model-free, machine-learning combiner for peptide identifications from tandem mass spectra. Clin Proteomics. 2009;5(1):23–36. [Google Scholar]
- 15.Keller A, Nesvizhskii AI, Kolker E, Aebersold R. Empirical statistical model to estimate the accuracy of peptide identifications made by MS/MS and database search. Anal Chem. 2002;74(20):5383–92. doi: 10.1021/ac025747h. [DOI] [PubMed] [Google Scholar]
- 16.(a) Elias JE, Gygi SP. Target-decoy search strategy for increased confidence in large-scale protein identifications by mass spectrometry. Nat Methods. 2007;4(3):207–14. doi: 10.1038/nmeth1019. [DOI] [PubMed] [Google Scholar]; (b) Kall L, Storey JD, MacCoss MJ, Noble WS. Assigning significance to peptides identified by tandem mass spectrometry using decoy databases. J Proteome Res. 2008;7(1):29–34. doi: 10.1021/pr700600n. [DOI] [PubMed] [Google Scholar]
- 17. [accessed March 31, 2013];CPTAC Data Portal. https://cptac-data-portal.georgetown.edu.
Associated Data
This section collects any data citations, data availability statements, or supplementary materials included in this article.