

Abstract
Haemostasis in the arteriolar circulation mediated by von Willebrand factor (VWF) binding to platelets is an example of an adhesive interaction that must withstand strong hydrodynamic forces acting on cells. VWF is a concatenated, multifunctional protein that has binding sites for platelets as well as subendothelial collagen1,2. Binding of the A1 domain in VWF to the glycoprotein Ib a subunit (GPIba) on the surface of platelets mediates crosslinking of platelets to one another and the formation of a platelet plug for arterioles3,4. The importance of VWF is illustrated by its mutation in von Willebrand disease, a bleeding diathesis1. Here, we describe a novel mechanochemical specialization of the A1–GPIbα bond for force-resistance. We have developed a method that enables, for the first time, repeated measurements of the binding and unbinding of a receptor and ligand in a single molecule (ReaLiSM). We demonstrate two states of the receptor-ligand bond, that is, a flex-bond. One state is seen at low force; a second state begins to engage at 10 pN with a ∼20-fold longer lifetime and greater force resistance. The lifetimes of the two states, how force exponentiates lifetime, and the kinetics of switching between the two states are all measured. For the first time, single-molecule measurements on this system are in agreement with bulk phase measurements. The results have important implications not only for how platelets bound to VWF are able to resist force to plug arterioles, but also how increased flow activates platelet plug formation.
In the A1–GPIbα complex, the VWF A1 domain interacts with the concave face of the leucine-rich repeat (LRR) domain of GPIbα5,6 (Fig. 1). The N terminus of GPIbα is within 2.2 nm of the C terminus of VWF A1, and neither terminus contributes to the complex interface. Therefore, we were able to link these termini with a 43-residue polypeptide (Fig. 1c).
Figure 1. The A1 and GP1bα single-molecule construct and change in extension on unbinding and rebinding.
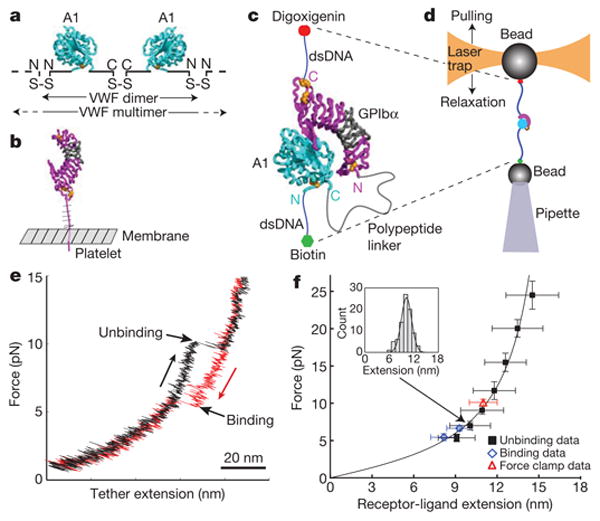
a–d, Schematic diagrams of VWF (a), GPIbα (b), the ReaLiSM (c), and the laser tweezers setup (d). Ribbon diagrams based on the A1 domain-GP1bα LRR domain complex show disulphide side chains as gold spheres. The LRR domain of GP1bα is magenta except LRR repeats 2–4 are grey. The mucin-like region between the LRR domain and membrane in GP1bα, and the non-A1 portion of the VWF monomer which comprises 90% of its mass, are shown schematically. e, Representative force-extension trace for one cycle of force increase (black) and decrease (red) in force-ramp experiments. f, Fit of receptor–ligand extension (unbinding) data to the WLC model. Data were binned by force; one representative bin is shown in the inset. Error bars show 1 s.d. for force and extension in each bin (n per bin = 10 to 85 for unbinding, 26 to 30 for rebinding, and 428 for force clamp). Fit to the WLC equation was by occurrence-weighted least squares. Data from receptor–ligand binding and force-clamp experiments were not included in fitting, but fall on the same line.
DNA handles of 802 base pairs were specifically attached to cysteine residues added to the C terminus of GPIbα and N terminus of A1 (Fig. 1c and Supplementary Fig. 2). The handles were in turn attached to beads held by a micropipette and laser trap (Fig. 1d) in a ‘mini laser-tweezers’ instrument suspended from a bungee cord7 (personal communication, S. B. Smith). By moving the laser trap, the A1–GPIbα ReaLiSM construct was subjected to cycles of increasing and decreasing force. In each cycle, an abrupt increase in the length of the tether between the two beads was observed during pulling, and an abrupt contraction was observed during relaxation (Fig. 1e, Supplementary Fig. 3).
The abrupt extension events during unbinding were fit to the wormlike chain (WLC) model (Fig. 1f), which yielded a persistence length of 0.8 ± 0.2 nm and contour length of 18.5 ± 0.8 nm. The contraction events during rebinding fell on the same curve (Fig. 1f). The expected contour length is calculated as the linker length of 43 residues times an extension of 3.8 Å per residue (16.3 nm), plus the N- to C-terminal distances in the A1 (1.9 nm) and GPIbα (7.0 nm) crystal structures, minus the distance between the N terminus of A1 and C terminus of GPIbα in the complex structure (7.0 nm). The close correspondence of the calculated distance of 18.2 nm to the experimentally determined distance of 18.5 ± 0.8 nm provides strong support that single A1–GPIbα binding and unbinding events are being measured. Furthermore, a 26-residue linker yielded a contour length of 10.6 nm, also in good agreement with calculation (Supplementary Fig. 4). Moreover, single-molecule tethers were distinguished by a 67-pN plateau in their force-extension curves at the B- to S-DNA transition8.
The force at which A1 and GPIbα dissociated was determined at different laser trap pulling rates (nm s−1) which yielded different force loading rates (pN s−1) (Fig. 2a–d). At low pulling rates, bond rupture events had a narrow, unimodal distribution (Fig. 2a, b). At higher pulling rates, the distribution of dissociation forces was clearly bimodal (Fig. 2c, d). The peak at lower force (Fig. 2c, d) corresponded to the single peak at lower pulling rates (Fig. 2a, b); the shape of the peak and its shift to higher force with increasing pulling rate fit predictions for dynamic force spectroscopy (curves in Fig. 2)9. The second peak also occurred at a slightly higher force at 40 nm s−1 than at 20 nm s−1 (Fig. 2c, d; note difference in x-axis) and matched predictions (curves in Fig. 2).
Figure 2. Force spectroscopy and bond lifetime.

a–f, Unbinding force distributions at different pulling rates in absence (a–d) or presence of 0.5 mg ml−1 ristocetin (e) or 0.1 μg ml−1 botrocetin (f). Error bars show Poisson noise. Loading rate averages and s.d. are over rupture events at each pulling rate. Curves show the predicted rupture force distributions9 using the constants from panels g and h. g, h, Bond lifetimes at constant force, estimated from each bin in a–f, using the Dudko–Hummer–Szabo equation. g, Lifetimes from pulling at 5 nm s−1 (open circles), 10 nm s−1 (open squares), 20 nm s−1 (open triangles) and 40 nm s−1 (open diamonds), and 40 nm s−1 with a 26-residue linker (filled diamonds, Supplementary Fig. 4). The grey filled circle shows the lifetime in bulk phase measurements12. The inset shows additional bond lifetime measurements (filled circles) at constant force (Fig. 3). h, Lifetimes in presence of ristocetin and botrocetin. Errors are Poisson noise. For panels c–e, equation (1) was evaluated separately for bins 1–4 (pathway 1) and bins 4–7/8 (pathway 2). Events in bin 4 were apportioned between pathway 1 and 2 according to the fits. Fits to the Bell equation, shown in panels g and h, were by occurrence-weighted least squares (dashed and solid lines).
Since the lifetime of a bond is a function of the rate at which force is applied9, with the Dudko–Hummer–Szabo equation10, each of the bins of the rupture force histograms shown in Fig. 2a–d was used to estimate lifetimes from the four different pulling rates (different symbols in Fig. 2g). The results demonstrate excellent agreement for the different pulling rates and the robustness of this elegant equation. The kinetics show two distinctive force-dependent lifetimes, or bond dissociation pathways. The first dissociation pathway predominated below 8 pN, whereas above 12 pN a second pathway predominated (Fig. 2g). Indistinguishable results were obtained with a 26-residue linker of distinct sequence (Fig. 2g, Supplementary Fig. 4b, c). Thus, the A1–GPIbα bond is a flex-bond, with one state in low force and switching to a second state induced by higher force.
Each pathway was well fit to an exponential decrease of lifetime under tensile force11 (lines, Fig. 2g). The second state has a lower value of σ, the constant that describes how much force exponentiates koff (Fig. 2g). Thus, switching at higher force occurs to a bond that is more force resistant. The estimate of the off-rate in the absence of force for the pathway at lower force, k1 off0, is 0.0027 s−1 (confidence interval of 0.0011 to 0.0066 s−1), in excellent agreement with bulk phase measurements of 125I-labelled A1 domain dissociation from GPIbα on agarose beads (koff = 0.00366 ± 0.0002 s−1) and intact platelets (koff = 0.0038 s−1) (Fig. 2g)12.
In force-clamp experiments, feedback was used to maintain a constant force on the bead in the laser trap. Hopping between the bound and unbound states occurred over a narrow range of forces from 9.55 to 10.58 pN (Fig. 3a–d). At the lower end of this force range A1– GPIbα was predominantly bound (Fig. 3a), and as force increased the proportion of the unbound state increased (Fig. 3b, c) until the unbound state predominated (Fig. 3d). The receptor–ligand extension measured in force-clamp experiments showed excellent agreement to the WLC fit to force-ramp data (Fig. 1f).
Figure 3. Force-clamp experiments.

a–d, Extension over representative 60 s periods at the indicated clamped forces (average ± s.d., n > 105). ΔX is the average extension between the bound (B) and unbound (U) states. e–h, Survival fraction of the bound state as a function of force and time in a–d over periods of 200 to 400s (n = 55 to 172).
To measure kinetics in force-clamp experiments, periods of 200 to 400 s were segmented into bound and unbound states based on the spatial extensions in the trajectory (Methods). The lifetime in the bound state showed double exponential decay (Fig. 3e–h). We fit this data to the model shown in Fig. 4 (Methods, equations 2–4). These equations encompass the rates of conversion to state 2 (k12) and back conversion to state 1 (k21), as well as k1 off and k2 off (Fig. 4). Fits to all four parameters (Supplementary Information, Supplementary Table 1) yielded values for k1 off and k2 off that were in excellent agreement with those obtained from the Dudko–Hummer–Szabo equation (inset, Fig. 2g). To obtain values with lower error estimates we also fixed k2 off at the values determined from the fit to the force-ramp data, because fewer dissociation events occurred through the second pathway at 10 pN (Fig. 3e–h), and fit the other three parameters (Fig. 4, Supplementary Table 2). The estimates show that k12 and k21 are on the order of 1 s, and both rates trend upward at higher force.
Figure 4. The flex-bond.

Schematic model of different states of the A1–GP1bα flex-bond, showing direction of tensile force (horizontal arrows) and estimated constants.
In clinical diagnosis of VWD, ristocetin is used to mimic shear-enhanced activation of VWF13. Ristocetin is an antibiotic that adventitiously activates VWF; botrocetin is a snake venom protein that activates VWF by a different mechanism and does not mimic shear (refs 13, 14 and references therein). The force-rupture histogram with ristocetin remained bimodal, with a marked shift of the second peak from 14.8 to 22.4 pN at 40 nm s−1 (Fig. 2d, e). In the presence of botrocetin a qualitatively different, unimodal distribution was seen, and the force-rupture peak was shifted to an even higher level of 28.4 pN at 40 nm s−1 (Fig. 2f). Transformation of the force-rupture distributions using the Dudko–Hummer–Szabo equation demonstrated good agreement with the exponential dependence of lifetime on force embodied by the Bell equation (Fig. 2h). The kinetics further emphasize the selective strengthening by ristocetin of pathway 2 and demonstrate that both ristocetin and botrocetin decrease exponentiation by force.
We have demonstrated that the bond between the VWF A1 domain and the platelet glycoprotein Ib α-subunit has two states (Fig. 4). Only one pathway was seen at lower force-loading rates, whereas at and above loading rates of 0.9 pN s−1, or at constant force of ∼10 pN, a second pathway was found, and the force-rupture distribution was bimodal. Agreement between force-ramp and force-clamp experiments was excellent. Moreover, two linkers of different length and sequence showed no effect on off-rate or switching between states. The rate of switching between the states, k12 and k21, was overall increased by force. Thus, tensile force influences the lifetime of an A1–GPIbα bond not only by shifting the equilibrium between the two states, but also by lowering the barrier for conversion between the two states.
Slip- and catch-bonds are defined as bonds with lifetimes that decrease and increase, respectively, with applied force. We find switching between two populations of bonds, each of which is a slip-bond. Since slip- and catch-bonds are defined as opposites of one another15, we propose a distinct name, the flex-bond. The analogy is to muscles and to adhesion molecules such as selectins and integrins, that have distinct flexed, low-affinity and extended, high-affinity states16–19.
In the ReaLiSM construct, force is applied to the N terminus of A1 and C terminus of GPIbα (Fig. 1c), similarly to physiologic force in vivo. When VWF is bound to multiple platelets and /or the vessel wall at a site of hemostasis, force applied to individual A1 domains will be distributed to both their N and C termini, because of the long-range disulphide bond within A1 that connects these termini (Fig. 1a). The GPIbα subunit is linked to the platelet through its C terminus (Fig. 1b), where the hydrodynamic force from the platelet will be applied. The close physical proximity of the receptor and ligand in ReaLiSM is similar to the situation in a multivalent interaction, except A1 and GPIbα remain in proximity because of the linker rather than the presence of interactions between neighbouring A1 domains in VWF and GPIb molecules on the platelet surface.
Above a threshold shear of 5,000 s−1, VWF transitions from a compact to an extended conformation that is active in hemostasis2–4,20. At this shear, the force-loading rate in the largest VWF concatamers is estimated21 to be well above the threshold of 0.9 pN s−1 where the second state of the flex-bond is seen, and thus this second state may function early in the initiation of platelet interactions with VWF in vivo.
The effect of the flex-bond is to broaden the distribution of forces that A1–GPIbα can withstand by extending the working range of the receptor–ligand bond by about 7 pN (Fig. 2g).This broad force range is important, because the force experienced by the A1–GPIbα bond will vary widely in vivo, depending on the length of the VWF multimer, binding to the vessel wall, the number and distribution of bound platelets, and the shear and elongational forces at the site of bleeding.
Our experimental setup offers several advantages over previous biophysical methods of studying receptor–ligand interactions. The receptor and ligand are held away from bead surfaces by DNA handles, reducing artefacts from nonspecific interactions between proteins and beads, or between probes and surfaces. Single tethers are unambiguously distinguished by overstretching of dsDNA around 67 pN. The ReaLiSM system provides further benefits. Previous studies of receptor–ligand interactions were on receptors and ligands immobilized on separate surfaces. Receptor–ligand complexes were formed when two surfaces approached one another, but repeated measurements on the same receptor and ligand pair were impossible. In ReaLiSM, the covalent tether between receptor and ligand not only enables repeated measurements on a single receptor–ligand complex, but also provides an intrinsic control that single molecule events are being measured, that is, the tether extension upon receptor–ligand dissociation and the contraction upon rebinding. The advantages of ReaLiSM may account for the marked differences in observed off-rates and trends with an earlier AFM study reporting A1–GPIb as a catch-bond22 (Fig. Supplementary Fig. 6), as well as our ability to fit our data to equations, and to find an extrapolated off-rate within 1.5-fold, rather than >1,000-fold, of bulk phase measurements12 (Fig. Supplementary Fig. 6).
The finding that A1–GPIbα is a flex-bond rather than a catch-bond has important conceptual implications. Shear flow above a threshold of 10,000 s−1 activates binding of platelets to VWF 2, and this is thought to be related to the mechanism by which increased shear or elongational flow21 at sites of arteriolar haemorrhage activates platelet plug formation in vivo1–4. Conversion from a compact to an extended conformation of VWF, or conformational changes that remove shielding by neighbouring domains, may expose the A1 domain to activate binding to platelet GPIbα20,23. Our results are consistent with these mechanisms, and an increase in the rate of bond formation triggered by shear flow24, rather than an alternative mechanism in which a decrease in the rate of bond dissociation would trigger haemostasis22.
Ristocetin is thought to bind near a stretch of C-terminal A1 domain residues in which gain-of-function VWD mutations are found (refs 13, 14 and references therein). Concordance between functional effects of antibodies and mutations indicate that ristocetin, and not botrocetin, induces a conformational state of the A1–GPIbα bond similar to its shear-induced configuration13. These findings correlate with our observation that ristocetin selectively stabilizes state 2, and that flex-bond behaviour is seen in ristocetin and not botrocetin.
Although only a single A1–GPIbα state has been seen in crystal structures, mutational data indicate a second, ristocetin- and force-stabilized state. The N-terminal and C-terminal leucine rich repeats of GPIbα (magenta, Fig. 1c), contact A1 in the crystal structure5,6. Although the middle repeats 2–4 (grey, Fig. 1c) make no contacts in the crystal structure and are unimportant in botrocetin-stimulated binding of VWF to GPIbα, they are required for ristocetin-stimulated binding25. Furthermore, the higher the shear, the greater the importance of repeats 2–4 (ref. 26). Thus, ristocetin and tensile force stabilize a second conformational state of the A1–GPIbα complex in which LRR 2–4 of GPIbα seem to contact the A1 domain. This evidence for two conformational states corresponds closely with our observation that the A1–GPIbα bond is a flex-bond with two states. Mutations in the A1 domain in gain-of-function type 2B von Willebrand disease are also indicative of conformational change. These mutations enhance binding of A1 to GPIbα, yet some map to sites that are buried in the A1 domain and may stabilize a conformation that has not yet been seen in crystal structures27. It will be interesting to examine whether gain of function mutations in VWF and GPIbα1 affect switching between the two states, and whether structural studies can reveal an extended, as well as the currently known flexed state5,6, of the A1–GPIbα complex.
Methods Summary
ReaLiSM constructs, with and without cysteines at the N and C termini, were purified from HEK293T cell supernatants. Only the construct with cysteines coupled to DNA handles (Supplementary Fig. 2). ReaLiSM DNA handle conjugates at ∼ 2 pM were incubated with 4.2 μm anti-digoxigenin Fab-beads. Trapped beads were brought close to 2.1 μm streptavidin-beads held in a micro-pipette for tether formation. Each tether used for data collection passed a single-molecule test by showing a plateau in the force-extension curve at the B- to S-DNA transition. The instrument comprises a dual-beam counter-propagating optical trap, with optics and fluidics in a miniature 25 × 29 × 29 cm head suspended from a bungee cord. Optical force was measured directly from a difference in light momentum. Measurements were at 500 Hertz. In force-ramp experiments the trap was pulled away from or relaxed towards the fixed bead at a constant speed. In force-clamp mode, force was auto-adjusted by feedback control, with overall equilibration of the laser tweezer in 5 ms.
The lifetime τ of a bond is a function of the rate at which force is applied9, enabling τ to be extracted from force rupture histograms10:
| (1) |
where P (rupture above F) is the total probability that bond rupture occurs above F, p (rupture at F) is the probability density of rupture events at force F, Ḟ is the force loading rate, ΔF is the bin width of the rupture force histogram that starts at F0, hi is the fraction of ruptures in the ith bin, and i and k are bin numbers.
Full Methods and any associated references are available in the online version of the paper at www.nature.com/nature.
Methods
Protein expression
The cDNA of human VWF A1 domain (Ile 1262 to Pro 1466 with pre-pro-VWF numbering), and human platelet GPIbα (His 1 to Arg 290) were PCR-amplified, and then used to construct the cDNAs of covalently tethered A1–GPIbα with or without additional cysteines flanking the N and C termini (Supplementary Fig. 2a). The sequence of the peptide linker (TGGPTIKPPKP PKPAPNLLGGPDKTHTKPPKPAPELLGGPGTG) was modified from the hinge regions of murine IgG2a and human IgG1, with Cys residues either removed or substituted with Pro. All Lys residues were followed by Pro; the Lys-Pro sequence is resistant to trypsin cleavage28. The engineered cDNAs were cloned into AgeI and XhoI sites of plasmid pHLsec, which encodes a Kozak sequence, an N-terminal secretion signal sequence, a vector-derived ET sequence, and a C-terminal His6 tag31. A completely different, shorter, 26-residue sequence (GTGENLYFQGG SSSSTTGWRGGHVGT) was used to construct a ReaLiSM to control for the effects of the length and the sequence on ReaLiSM properties. HEK293T cells were transiently transfected using calcium phosphate or Lipofectamine. Culture supernatants were harvested 3 days after transfection and proteins were purified using Ni-NTA affinity chromatography followed by size-exclusion chromatography in 20 mM Tris, pH 8.0, 50 mM NaCl, 0.02% NP-40 and 5 mM EDTA (Supplementary Fig. 2b, c).
Sample preparation
DNA handles (802 bp) were PCR-amplified using forward primers with a 5′thiol group and reverse primers with either 5′biotin or 5′digoxigenin, and activated with 2,2′-dithio-dipyridine (DTDP) as described previously21. For protein–DNA coupling, 1 μM of protein (100 μl) was incubated in 0.1 mM DTT for 30 min under argon at room temperature, followed by removing DTT with 0.5 ml Zeba desalting columns (Pierce) twice. About 0.1 μM of protein was allowed to react with 0.1 μM of each DTDP-activated DNA handle in 20 mM Tris, pH 7.5, 100 mM NaCl, 0.01% NP-40 and 1 mM EDTA under argon for 16 h (typically 50 μl). Protein coupling to DNA handles was assayed by 4–20% native gels (Supplementary Fig. 2d). Material was stored at −80 °C.
Carboxyl-polystyrene beads of 2.1 and 4.3 μm diameter (Spherotech) were washed and resuspended in 0.2 ml of 50 mM 2-(N-morpholino) ethanesulphonic acid pH 5.2, 0.05% ProClin 300 (Bangs Laboratories). 1-ethyl-3-(3-dimethylaminopropyl)carbodiimide (2 mg in 10 μl of the same buffer) was added, followed after 5 min by 50 μg of 5 mg ml−1 streptavidin (Invitrogen) or 1 mg ml−1 affinity-purified sheep anti-digoxigenin Fab (Roche) in PBS. After shaking for 1 h at room temperature, beads were washed five times in PBS and stored at 4 °C in PBS supplemented with 0.02% Tween 20 and 2 mM sodium azide.
Crude Bothrops jararaca venom (100 mg, Sigma) in 3 ml 20 mM Tris-HCl, pH 7.5 and 100 mM NaCl was centrifuged at 15,000g. The supernatant was applied to 1 ml HiTrap Q fast-flow (GE healthcare) and proteins were eluted with a 10 ml gradient of NaCl (0.1–0.46 M) in the buffer over 10 min at a flow rate of 1 ml min−1. Fractions were assayed for agglutination of platelet-rich plasma. The fractions showing highest activity were loaded on size-exclusion chromatography columns with Superdex 200 (GE Healthcare) in 20 mM Tris-HCl, pH 7.5, 150 mM NaCl, 1 mM EDTA and 0.02% Tween 20. The most active fractions were pooled and stored at −80 °C. Ristocetin was purchased from Sigma.
Single-molecule force experiments
Appropriate dilutions of the receptor and ligand single molecule (ReaLiSM) construct (about 2 pM) were incubated with polystyrene beads (4.2 μm) functionalized with anti-digoxigenin polyclonal Fab. A bead trapped in the laser tweezers was brought close to a streptavidin-modified polystyrene bead (2.1 μm) held by suction in a micropipette. To test for single-molecule tethers, each tether was first examined for a plateau in the force extension curve (overstretching) at ∼67 pN corresponding to the B- to S-DNA transition. Force was rapidly increased manually (about 80 nm s−1), and as soon as overstretching was seen, force was rapidly lowered to 2 pN. Rapidity was desired to decrease the chance of biotin or digoxigenin dissociation from functionalized beads. Single tethers that passed the overstretching test, and also showed rip events, were then subjected to cycles of increasing and decreasing forces (force-rip experiments) or constant force (force-clamp experiments).
Alternatively, if a multi tether rather than a single tether was obtained, it was readily identified by a force-extension curve extending to 80 pN without any overstretching plateau. Such tethers were discarded. To search for further tethers, the bead in the trap was either slightly rotated using flow, or a new bead was picked up.
The instrument (ref. 7, personal communication, S. B. Smith, and http://tweezerslab.unipr.it) comprises a dual-beam counter-propagating optical trap, with all the optics and fluidics contained in a miniaturized (25 × 29 × 29 cm) head that is isolated from vibration by suspending it from a single bungee cord. Optical force exerted on the trapped bead was measured in real time as the difference in the light momentum between the incident and output beams, that is, as a difference in the distance-weighted intensity on a position-sensitive photodetector29. Dual trap positions were changed by deflecting two optical fibres with piezo actuators. Trap positions were determined from two position-specific photodetectors. Here the two traps moved together by force feedback, so the two position signals were averaged together. All measurements were recorded at 500 Hz.
Force-rip experiments
Force-rip experiments were carried out by stretching and relaxing the tether between two force values, while moving the trap away from (pulling) or towards (relaxation) the fixed bead held by the micropipette at constant speed ranging from 5 to 40 nm s−1. The distance was measured between two points on the force-trap position curves, from the point just before dissociation to the point when force returned to the same level after dissociation. The trap stiffness does not matter for that measurement because at each force the relaxation of the bead in the trap is the same whether the tether is extended or not. The extra extension in the curves is solely due to unbinding of the receptor and ligand in the ReaLiSM, because the persistence length of the polypeptide linker (∼1 nm) is significantly shorter than that of the dsDNA handles (∼50 nm). Force loading rates (pN s−1) before each rip-event were estimated from the curve and further averaged for all rupture events at a given pulling rate (nm s−1).
The lifetime τ of a bond is a function of the rate at which force is applied9, enabling τ to be extracted from force rupture histograms10:
| (1) |
where P (rupture above F) is the total probability that bond rupture occurs above F, p (rupture at F) is the probability density of rupture events at force F, Ḟ is the force loading rate, ΔF is the bin width of the rupture force histogram that starts at F0, hi is the fraction of ruptures in the ith bin, and i and k are bin numbers. We used this equation to estimate bond lifetime at constant force from the rupture force histogram10.
The above equation was obtained by inverting the bond rupture force distribution in dynamic force spectroscopy9:
| (2) |
The lifetime as a function of force, τ(f), obtained from fittings in Fig. 2g, h, was substituted back into equation (2) with the average loading rate to calculate the rupture force distributions, which are shown as curves in Fig. 2a–f.
Force-clamping experiments
In force-clamping experiments, the position of the laser trap and the applied force were recorded at 500 Hz for 200–400 s, when force was auto-adjusted by feedback control to the desired value. The feedback time loop is 5 ms for overall equilibration of the laser tweezers.
The baseline drift of extension data was corrected by a linear compensation, x(t) = xdata(t) + vt; the slope v was in the range of 0.05 to 0.1 nm s−1. The average spatial extensions for the bound and the unbound states were determined from the histogram of spatial extension data. We then assigned the state (U or B) at any given time based on the spatial extension and generated intervals of bound and unbound states. Intervals shorter than 10 ms (twice the instrument feedback loop of 5 ms) were removed. An example of segmentation of the bound and unbound states into a hopping diagram is shown in Supplementary Fig. 3.
Assuming that the ReaLiSM system has no memory, we can treat each hopping event from the bound to unbound state as an independent dissociation of the bound state. The durations of the bound state were cumulated into lifetime distributions (Fig. 3e–h) to obtain dissociation kinetics. For clamping data at 10.05, 10.27 and 10.58 pN, exponential fitting of cumulative distributions of durations yielded two slopes, indicating two different kinetics. Therefore, data were fit to the kinetic model of the flex-bond in Fig. 4 and governed by equations 3–5,
| (3) |
| (4) |
| (5) |
where [B1] and [B2] are the probabilities of occurrences of the first and second bound states, and [U] the probability of the unbound state; k1 off and k2 off are dissociation rates of the first and the second bound states; k12 is the forward conversion rate (from the first to the second state), and k21 is the backward rate. The same equations were usedt of it two-state, but not one-state, catch bonds19,30.
Durations in the bound states between 0.1 and 10 s were fitted to the analytical expression for d[U]/dt solved from equations (3–5) by a nonlinear-least-square method using MATLAB. Results for all four rate coefficients are summarized in Supplementary Table 1. Because relatively small fractions of long durations (>3 s) are nonetheless important for determining the two conversion rates (k12 and k21) as well as the second dissociation rate (k2 off), we varied initial guess for k2 off in order to obtain best overall fits to data. Estimates were robust to different initial guesses; however, estimations of confidence intervals for the rate coefficients were inaccurate and showed a broad range. To obtain better estimates for the conversion rates and their confidence intervals, we fixed the value for k2 off by interpolation from Bell-model fitting of the force-dependent lifetimes in Fig. 2g. This enabled us to estimate the other three rates, as shown in Supplementary Table 2.
Supplementary Material
Figure S1. Conceptual summary. Schematic model of flexed and extended states of the A1-GP1bα flex-bond, showing direction of tensile force (horizontal arrows), and estimated constants for conversion between the two states of the receptor-ligand bond (k21 and k12) and off-rates in absence of force (k1off0 and k2off0 and mechanical properties of the bonds showing how much force exponentiates off-rates (σ1 and σ2). A1 is shown in cyan, GP1ba in magenta, and a linker polypeptide that fuses them together as a grey curved line.
Figure S2. ReaLiSM construct design, purification, and coupling to DNA handles. a. Schematic design of covalently tethered VWF A1-GPIbα constructs. Constructs with N and C-terminal cysteines for coupling to DNA handles (protein construct) or without the added cysteines (control protein construct) were expressed and purified. Each construct was expressed and purified similarly. b. Protein purification using Ni-NTA affinity chromatography. All three fractions of the elution (column volumes 1-3) were concentrated and applied to the S200 size exclusion column. c. Purification on Superdex S200. Lanes 1-4 represent successive even-numbered fractions from the gel filtration column. The fraction shown in lane 3 was used for coupling to DNA handles. Panels b and c show nonreducing SDS 10% PAGE and Coomassie Blue staining; markers are in lane M. d. Protein coupling to DNA handles. Coupled material, with or without a mAb to GPIbα (mAb 6D1, from Dr. B. Coller, Rockefeller U., New York, NY) to assay a shift in migration, was subjected to electrophoresis in 4-20% native gels and stained with SYBR green nucleic acid gel stain.
Figure S3. Force-extension trace for one cycle of force increase (black) and decrease (red) for a representative cycle in which multiple unbinding and binding events were seen at 5 nm/s. Receptor-ligand unbinding and binding events are highlighted in yellow. Bead position (Zbead) is calculated from trap position (Ztrap) as Zbead = Ztrap - F/k, with an average stiffness k from several different beads.
Figure S4. The effect of the linker in A1-GP1bα ReaLiSM constructs. All results in the main text are with the 43-residue linker, except where a 26-residue linker is noted. (a) Fit of receptor-ligand extension (unbinding) data to the WLC model. Data is as shown in main text Fig. 1f, with the addition of data on the 26-residue linker (green symbols) and fit to WLC model (red line). This fit yielded a persistence length of 0.6 nm and contour length of 10.6 ± 0.6 nm. The expected contour length of 11.8 nm is calculated as the linker length of 26 residues times an extension of 3.8 Å/residue (9.9 nm), plus the N to C-terminal distances in the A1 (1.9 nm) and GPIbα (7.0 nm) crystal structures, minus the distance between the N-terminus of A1 and C-terminus of GPIbα in the complex structure (7.0 nm). (b and c) Distribution of unbinding forces with a 43-residue linker (b) and 26-residue linker (c). Error bars show Poisson noise as (hk is bin height). Loading rate averages and SD are over all rupture events at pulling rate. Curves show the predicted rupture force distributions using the constants estimated in Fig. 2g.
Figure S5. a. Extension over representative 60 s periods at 10.27 pN. b. Segmentation of the extension data into bound and unbound intervals.
Figure S6. Comparison of off rates determined using different systems. Data from this publication on the A1-linker-GPIbα fusion protein- DNA handle ReaLiSM construct are shown in black open or filled symbols. Black lines show fits of this data to the Bell model. The circle with gray fill is from 1, and shows bulk phase measurements of soluble A1 domain dissociation from GPIbα on beads or on platelets (koff of 0.0036 and 0.0038 s-1). Fitting of our data on k1off at different forces to the Bell equation (dashed line) extrapolates to a k1off0 of 0.0027 s-1, close to the bulk phase results. Blue symbols show data from Fig. 2a of 2, on dissociation of A1 domains physically adsorbed to polystyrene Petri dishes from GPIbα (glycocalicin) physically adsorbed to atomic force microscope cantilevers. No fits to force spectroscopy dynamics equations were reported in 2; the blue dashed and solid lines are visual fits of their data to straight lines. The fit of the catch bond regime (dashed line) extrapolates to a koff0 of 10 s-1 , more than three orders of magnitude away from the ReaLiSM and bulk phase results.
Table S1. Estimates of flex-bond kinetics at three different forces. All four rates were estimated by fitting bond survival data (Fig. 3f to h) to equations S2-S4. Estimates with reasonable confidence intervals are obtained for k1 off. However, because the other three parameters are correlated with one another, their confidence intervals are large.
Table S2. Values of k12, k21, and k1 off estimated from force-clamp experiments using equations S2 to S4 when k2 off was fixed at values estimated in Fig. 2g. Uncertainties are shown as 95% confidence intervals in parentheses.
Acknowledgments
Supported by NIH HL-48675 (TAS). The authors are indebted to S.B. Smith and C. Bustamante for help with laser tweezers construction and insightful discussion. We thank B. Coller, O. K. Dudko and C. Lu for reagents and insightful discussions, and J. Dill for software for data analysis.
Footnotes
Supplementary Information: is linked to the online version of the paper at www.nature.com/nature.
Author Contributions: T.A.S. designed and supervised the project. X.Z. cloned the ReaLiSM construct. J.K. designed experiments and collected and analysed data. C.-Z.Z. analysed data. T.A.S, J.K. and C.-Z.Z. wrote the paper.
The authors declare no competing financial interests.
References
- 1.Sadler JE. New concepts in von Willebrand disease. Annu Rev Med. 2005;56:173–191. doi: 10.1146/annurev.med.56.082103.104713. [DOI] [PubMed] [Google Scholar]
- 2.Ruggeri ZM, Mendolicchio GL. Adhesion mechanisms in platelet function. Circ Res. 2007;100:1673–1685. doi: 10.1161/01.RES.0000267878.97021.ab. [DOI] [PubMed] [Google Scholar]
- 3.Ruggeri ZM, Orje JN, Habermann R, Federici AB, Reininger AJ. Activation-independent platelet adhesion and aggregation under elevated shear stress. Blood. 2006;108:1903–1910. doi: 10.1182/blood-2006-04-011551. [DOI] [PMC free article] [PubMed] [Google Scholar]
- 4.Nesbitt WS, et al. A shear gradient-dependent platelet aggregation mechanism drives thrombus formation. Nature Med. 2009;15:665–673. doi: 10.1038/nm.1955. [DOI] [PubMed] [Google Scholar]
- 5.Huizinga EG, et al. Structures of glycoprotein Iba and its complex with von Willebrand factor A1 domain. Science. 2002;297:1176–1179. doi: 10.1126/science.107355. [DOI] [PubMed] [Google Scholar]
- 6.Dumas JJ, et al. Crystal structure of the wild-type von Willebrand factor A1-glycoprotein Iba complex reveals conformation differences with a complex bearing von Willebrand disease mutations. J Biol Chem. 2004;279:23327–23334. doi: 10.1074/jbc.M401659200. [DOI] [PubMed] [Google Scholar]
- 7.Bustamante C, Smith S. Light-force sensor and method for measuring axial optical-trap forces from changes in light momentum along an optic axis. US Patent. 2004;7:133–132. [Google Scholar]
- 8.Bustamante C, Smith SB, Liphardt J, Smith D. Single-molecule studies of DNA mechanics. Curr Opin Struct Biol. 2000;10:279–285. doi: 10.1016/s0959-440x(00)00085-3. [DOI] [PubMed] [Google Scholar]
- 9.Evans E, Ritchie K. Strength of a weak bond connecting flexible polymer chains. Biophys J. 1999;76:2439–2447. doi: 10.1016/S0006-3495(99)77399-6. [DOI] [PMC free article] [PubMed] [Google Scholar]
- 10.Dudko OK, Hummer G, Szabo A. Theory, analysis, and interpretation of single-molecule force spectroscopy experiments. Proc Natl Acad Sci USA. 2008;105:15755–15760. doi: 10.1073/pnas.0806085105. [DOI] [PMC free article] [PubMed] [Google Scholar]
- 11.Bell GI. Models for the specific adhesion of cells to cells: a theoretical framework for adhesion mediated by reversible bonds between cell surface molecules. Science. 1978;200:618–627. doi: 10.1126/science.347575. [DOI] [PubMed] [Google Scholar]
- 12.Miura S, et al. Interaction of von Willebrand factor domain A1 with platelet glycoprotein Ibα-(1–289). Slow intrinsic binding kinetics mediate rapid platelet adhesion. J Biol Chem. 2000;275:7539–7546. doi: 10.1074/jbc.275.11.7539. [DOI] [PubMed] [Google Scholar]
- 13.Dong JF, et al. Ristocetin-dependent, but not botrocetin-dependent, binding of von Willebrand factor to the platelet glycoprotein Ib-IX-V complex correlates with shear-dependent interactions. Blood. 2001;97:162–168. doi: 10.1182/blood.v97.1.162. [DOI] [PubMed] [Google Scholar]
- 14.De Luca M, et al. Structure and function of the von Willebrand factor A1 domain: analysis with monoclonal antibodies reveals distinct binding sites involved in recognition of the platelet membrane glycoprotein Ib-IX-V complex and ristocetin-dependent activation. Blood. 2000;95:164–172. [PubMed] [Google Scholar]
- 15.Dembo M, Torney DC, Saxman K, Hammer D. The reaction-limited kinetics of membrane-to-surface adhesion and detachment. Proc R Soc Lond B. 1988;234:55–83. doi: 10.1098/rspb.1988.0038. [DOI] [PubMed] [Google Scholar]
- 16.Phan UT, Waldron TT, Springer TA. Remodeling of the lectin/EGF-like interface in P- and L-selectin increases adhesiveness and shear resistance under hydrodynamic force. Nature Immunol. 2006;7:883–889. doi: 10.1038/ni1366. [DOI] [PMC free article] [PubMed] [Google Scholar]
- 17.Astrof NS, Salas A, Shimaoka M, Chen JF, Springer TA. Importance of force linkage in mechanochemistry of adhesion receptors. Biochemistry. 2006;45:15020–15028. doi: 10.1021/bi061566o. [DOI] [PMC free article] [PubMed] [Google Scholar]
- 18.Springer TA. Structural basis for selectin mechanochemistry. Proc Natl Acad Sci USA. 2009;106:91–96. doi: 10.1073/pnas.0810784105. [DOI] [PMC free article] [PubMed] [Google Scholar]
- 19.Thomas WE, Vogel V, Sokurenko E. Biophysics of catch bonds. Annu Rev Biophys. 2008;37:399–416. doi: 10.1146/annurev.biophys.37.032807.125804. [DOI] [PubMed] [Google Scholar]
- 20.Schneider SW, et al. Shear-induced unfolding triggers adhesion of von Willebrand factor fibers. Proc Natl Acad Sci USA. 2007;104:7899–7903. doi: 10.1073/pnas.0608422104. [DOI] [PMC free article] [PubMed] [Google Scholar]
- 21.Zhang X, Halvorsen K, Zhang CZ, Wong WP, Springer TA. Mechanoenzymatic cleavage of the ultralarge vascular protein, von Willebrand Factor. Science. 2009;324:1330–1334. doi: 10.1126/science.1170905. [DOI] [PMC free article] [PubMed] [Google Scholar]
- 22.Yago T, et al. Platelet glycoprotein Iba forms catch bonds with human WT vWF but not with type 2B von Willebrand disease vWF. J Clin Invest. 2008;118:3195–3207. doi: 10.1172/JCI35754. [DOI] [PMC free article] [PubMed] [Google Scholar]
- 23.Ulrichts H, et al. Shielding of the A1 domain by the D9D3 domains of von Willebrand factor modulates its interaction with platelet glycoprotein Ib-IX-V. J Biol Chem. 2006;281:4699–4707. doi: 10.1074/jbc.M513314200. [DOI] [PubMed] [Google Scholar]
- 24.Chen S, Springer TA. An automatic braking system that stabilizes leukocyte rolling by an increase in selectin bond number with shear. J Cell Biol. 1999;144:185–200. doi: 10.1083/jcb.144.1.185. [DOI] [PMC free article] [PubMed] [Google Scholar]
- 25.Shen Y, et al. Requirement of leucine-rich repeats of glycoprotein (GP) Iba for shear-dependent and static binding of von Willebrand factor to the platelet membrane GP Ib-IX-V complex. Blood. 2000;95:903–910. [PubMed] [Google Scholar]
- 26.Shen Y, et al. Leucine-rich repeats 2-4 (Leu60-Glu128) of platelet glycoprotein Iba regulate shear-dependent cell adhesion to von Willebrand factor. J Biol Chem. 2006;281:26419–26423. doi: 10.1074/jbc.M604296200. [DOI] [PubMed] [Google Scholar]
- 27.Celikel R, Ruggeri ZM, Varughese KI. von Willebrand factor conformation and adhesive function is modulated by an internalized water molecule. Nature Struct Biol. 2000;7:881–884. doi: 10.1038/79639. [DOI] [PubMed] [Google Scholar]
- 28.Kieliszewski MJ, Leykam JF, Lamport DT. Trypsin cleaves lysylproline in a hydroxyproline-rich glycoprotein from Zea mays. Pept Res. 1989;2:246–248. [PubMed] [Google Scholar]
- 29.Smith SB, Cui Y, Bustamante C. Optical-trap force transducer that operates by direct measurement of light momentum. Methods Enzymol. 2003;361:134–162. doi: 10.1016/s0076-6879(03)61009-8. [DOI] [PubMed] [Google Scholar]
- 30.Thomas W, et al. Catch-bond model derived from allostery explains force-activated bacterial adhesion. Biophys J. 2006;90:753–764. doi: 10.1529/biophysj.105.066548. [DOI] [PMC free article] [PubMed] [Google Scholar]
- 31.Aricescu AR, Lu W, Jones EY. A time- and cost-efficient system for high-level protein production in mammalian cells. Acta Crystallogr D. 2006;62:1243–1250. doi: 10.1107/S0907444906029799. [DOI] [PubMed] [Google Scholar]
Associated Data
This section collects any data citations, data availability statements, or supplementary materials included in this article.
Supplementary Materials
Figure S1. Conceptual summary. Schematic model of flexed and extended states of the A1-GP1bα flex-bond, showing direction of tensile force (horizontal arrows), and estimated constants for conversion between the two states of the receptor-ligand bond (k21 and k12) and off-rates in absence of force (k1off0 and k2off0 and mechanical properties of the bonds showing how much force exponentiates off-rates (σ1 and σ2). A1 is shown in cyan, GP1ba in magenta, and a linker polypeptide that fuses them together as a grey curved line.
Figure S2. ReaLiSM construct design, purification, and coupling to DNA handles. a. Schematic design of covalently tethered VWF A1-GPIbα constructs. Constructs with N and C-terminal cysteines for coupling to DNA handles (protein construct) or without the added cysteines (control protein construct) were expressed and purified. Each construct was expressed and purified similarly. b. Protein purification using Ni-NTA affinity chromatography. All three fractions of the elution (column volumes 1-3) were concentrated and applied to the S200 size exclusion column. c. Purification on Superdex S200. Lanes 1-4 represent successive even-numbered fractions from the gel filtration column. The fraction shown in lane 3 was used for coupling to DNA handles. Panels b and c show nonreducing SDS 10% PAGE and Coomassie Blue staining; markers are in lane M. d. Protein coupling to DNA handles. Coupled material, with or without a mAb to GPIbα (mAb 6D1, from Dr. B. Coller, Rockefeller U., New York, NY) to assay a shift in migration, was subjected to electrophoresis in 4-20% native gels and stained with SYBR green nucleic acid gel stain.
Figure S3. Force-extension trace for one cycle of force increase (black) and decrease (red) for a representative cycle in which multiple unbinding and binding events were seen at 5 nm/s. Receptor-ligand unbinding and binding events are highlighted in yellow. Bead position (Zbead) is calculated from trap position (Ztrap) as Zbead = Ztrap - F/k, with an average stiffness k from several different beads.
Figure S4. The effect of the linker in A1-GP1bα ReaLiSM constructs. All results in the main text are with the 43-residue linker, except where a 26-residue linker is noted. (a) Fit of receptor-ligand extension (unbinding) data to the WLC model. Data is as shown in main text Fig. 1f, with the addition of data on the 26-residue linker (green symbols) and fit to WLC model (red line). This fit yielded a persistence length of 0.6 nm and contour length of 10.6 ± 0.6 nm. The expected contour length of 11.8 nm is calculated as the linker length of 26 residues times an extension of 3.8 Å/residue (9.9 nm), plus the N to C-terminal distances in the A1 (1.9 nm) and GPIbα (7.0 nm) crystal structures, minus the distance between the N-terminus of A1 and C-terminus of GPIbα in the complex structure (7.0 nm). (b and c) Distribution of unbinding forces with a 43-residue linker (b) and 26-residue linker (c). Error bars show Poisson noise as (hk is bin height). Loading rate averages and SD are over all rupture events at pulling rate. Curves show the predicted rupture force distributions using the constants estimated in Fig. 2g.
Figure S5. a. Extension over representative 60 s periods at 10.27 pN. b. Segmentation of the extension data into bound and unbound intervals.
Figure S6. Comparison of off rates determined using different systems. Data from this publication on the A1-linker-GPIbα fusion protein- DNA handle ReaLiSM construct are shown in black open or filled symbols. Black lines show fits of this data to the Bell model. The circle with gray fill is from 1, and shows bulk phase measurements of soluble A1 domain dissociation from GPIbα on beads or on platelets (koff of 0.0036 and 0.0038 s-1). Fitting of our data on k1off at different forces to the Bell equation (dashed line) extrapolates to a k1off0 of 0.0027 s-1, close to the bulk phase results. Blue symbols show data from Fig. 2a of 2, on dissociation of A1 domains physically adsorbed to polystyrene Petri dishes from GPIbα (glycocalicin) physically adsorbed to atomic force microscope cantilevers. No fits to force spectroscopy dynamics equations were reported in 2; the blue dashed and solid lines are visual fits of their data to straight lines. The fit of the catch bond regime (dashed line) extrapolates to a koff0 of 10 s-1 , more than three orders of magnitude away from the ReaLiSM and bulk phase results.
Table S1. Estimates of flex-bond kinetics at three different forces. All four rates were estimated by fitting bond survival data (Fig. 3f to h) to equations S2-S4. Estimates with reasonable confidence intervals are obtained for k1 off. However, because the other three parameters are correlated with one another, their confidence intervals are large.
Table S2. Values of k12, k21, and k1 off estimated from force-clamp experiments using equations S2 to S4 when k2 off was fixed at values estimated in Fig. 2g. Uncertainties are shown as 95% confidence intervals in parentheses.