

Abstract
Chromatin immunoprecipitation (ChIP) is an assay for interrogating protein–DNA interactions that is increasingly being used for drug target discovery and screening applications. Currently the complexity of the protocol and the amount of hands-on time required for this assay limits its use to low throughput applications; furthermore, variability in antibody quality poses an additional obstacle in scaling up ChIP for large scale screening purposes. To address these challenges, we report HTChIP, an automated microfluidic-based platform for performing high-throughput ChIP screening measurements of 16 different targets simultaneously, with potential for further scale-up. From chromatin to analyzable PCR results only takes one day using HTChIP, as compared to several days up to one week for conventional protocols. HTChIP can also be used to test multiple antibodies and select the best performer for downstream ChIP applications, saving time and reagent costs of unsuccessful ChIP assays as a result of poor antibody quality. We performed a series of characterization assays to demonstrate that HTChIP can rapidly and accurately evaluate the epigenetic states of a cell, and that it is sensitive enough to detect the changes in the epigenetic state induced by a cytokine stimulant over a fine temporal resolution. With these results, we believe that HTChIP can introduce large improvements in routine ChIP, antibody screening, and drug screening efficiency, and further facilitate the use of ChIP as a valuable tool for research and discovery.
Introduction
Chromatin immunoprecipitation (ChIP) is an assay used to study protein-DNA interactions in the cell.1 In a typical ChIP assay, antibodies against the proteins of interest are used to purify these proteins along with the DNA they bind to. Subsequently this DNA can be released, identified and quantified, giving information about where the protein binds across the genome.2,3
Gene transcription, a critical cellular process, is directly controlled by transcription factor protein-DNA interactions, and also indirectly regulated by histone protein-DNA interactions.4 These epigenetic control mechanisms have increasingly been shown to play an important role in human diseases, for example in cancer5–7 and diabetes.8,9 ChIP has been used extensively to further our understanding of such disease mechanisms, to elucidate genomic locations of abnormal transcriptional activity,9 as well as to compare normal and abnormal histone modification profiles in the cell.7,10,11 With the decreasing cost of microarrays and high throughput sequencing technologies, genome wide studies of protein-DNA interactions using ChIP-chip (ChIP followed by microarray) and ChIP-Seq (ChIP followed by high throughput sequencing) are becoming more accessible to researchers. In addition to being used to investigate specific cellular mechanisms in depth by basic science researchers, ChIP is also being used in screening applications to identify feasible epigenetic drug targets,11–13 or to evaluate the effect of drugs on cell epigenetics by the biotech industry.14,15
Unfortunately, the conventional ChIP methodology is not amenable to industrial scale-up and automation, due to the amount of hands-on time, total experiment time, and the prohibitively high quantity of sample and reagents required. Efforts to improve ChIP methodology have largely been successful in reducing sample and reagent requirements to thousands of cells per assay,16–20 but have not provided any scalable, automatable solutions. Flanagin et al. have increased the throughput of ChIP by adapting it to a 96-well microplate platform called Matrix-ChIP,21 but this method still requires 100 000 cells per well, which implies 10 million cells that must be manually processed from culture for each plate of assays. It can thus be concluded that existing techniques, although improvements on traditional ChIP, do not adequately address the need for a scalable, low consumption ChIP technique that will enable high throughput epigenetic drug target discovery in the industrial setting.
Another major bottleneck preventing ChIP being more widely used in industrial screening applications is the variability in antibody quality: the success of a ChIP experiment is largely determined by the specificity and sensitivity of the antibody.22,23 An antibody that has high specificity will result in a good enrichment of the target protein over background, and a more confident prediction of protein binding. An antibody that has high sensitivity means that a stronger signal can be obtained in experiments that start with fewer cells, or for a low abundance protein. Although certain commercial vendors market lines of antibodies as “ChIP-grade”, the variation in antibody specificity and sensitivity is still extremely problematic. This variation in quality does not occur only between antibodies targeting different epitopes; even for antibodies targeting the same epitope, there is variation between different vendors, and even between batches from the same vendor. This introduces problems of replicability in experimentation, and results in a waste of time, samples, and reagents for the researcher. Currently, antibodies are evaluated by testing them in immunohistochemistry (IHC) or western blots (WB), and top performers in these assays are labeled “ChIP-grade”.23 However, it is well known that antibodies that perform well in IHC or WB do not necessarily perform well in ChIP, and the best way to test an antibody for ChIP performance is using ChIP.22,23 Hence, a high throughput, low consumption ChIP screening technique would also be of great value in validation of ChIP antibodies, both in an industry setting and for the individual researcher.
To address the two aforementioned major challenges in scaling up epigenetic screening, we have developed a high throughput, low consumption, automated microfluidic device for ChIP for drug screening and antibody validation (HTChIP). Previously we reported a high sensitivity microfluidic ChIP technique, AutoChIP, which allows two ChIP-qPCR and two control measurements per device run, starting from as few as 2000 cells for each measurement.24 Here, we describe a new microfluidic device which increases ChIP throughput by a factor of 7-fold: 14 ChIP and two control measurements can be made from a single biological sample simultaneously, or 6 ChIP and two control measurements each from two biological samples simultaneously, using only 10 000 cells’ equivalent of chromatin and < 0.5 μg of antibody for each measurement. Each ChIP mixing chamber can be independently addressed such that the combination of antibodies used on each chromatin sample is completely customizable; if desired, a set of completely different antibodies can be used for the first chromatin sample than the second chromatin sample. To address the specifications of high-throughput screening ChIP applications better, HTChIP has been designed to take fragmented chromatin prepared with conventional methods, rather than to fragment the chromatin in situ. In addition to proof-of-concept, and characterization of the pull-down efficiency of HTChIP, we establish the utility of HTChIP in antibody screening assays by comparing multiple antibodies’ performance in ChIP using our HTChIP platform. Moreover, we use HTChIP to track ex-vivo nuclear protein-DNA interactions in response to different durations of cytokine stimulation with a fine temporal resolution, demonstrating the potential of HTChIP as a tool for high-throughput drug screening.
Materials and methods
Device fabrication and operation
The main body of our device is made of polydimethylsiloxane (PDMS) containing channels and valves, fabricated as detailed previously25,26 with some modifications. The hybrid flow master molds were fabricated out of 45 μm AZ-50XT (Mays Chemicals) and 35 μm SU8-50 photoresists (Microchem), and the control molds were cast from 35 μm SU8-2025 (Microchem). For the PDMS control layer, 20 g of uncured PDMS (20 Part A:1 Part B) was spun onto the negative mold at 1500 rpm for 60 s. Cross-sectional dimensions of the control channels are 35 μm × 300 μm. For the PDMS flow layer, 40 g of uncured PDMS (5 Part A:1 Part B) was poured onto the negative mold, degassed for 1 h and baked for 1 h at 80 °C to cure. Cross-sectional dimensions of the flow channels are 45 μm × 300 μm at rounded valves and 35 μm × 300 μm otherwise. The ring structures of the device are in 7500 μm length and 3800 μm in width (from outer edge to outer edge). Actuation and operation of the device is also as previously described.25 An image and labeled schematic of the device are presented in Fig. 1 and 2.
Fig. 1.

Photograph of HTChIP device. Device is filled with different dye colours to demonstrate independent sample loading on the left and the right side of the device, allowing simultaneous processing of two distinct biological samples.
Fig. 2.

Schematic of HTChIP. Reagent-containing flow channels are shown in blue shades, and valve-actuating control channels in red. Antibody-bead preparations are loaded into the black-boxed regions of rings via Inlets 1–16, and then mixed with sheared chromatin. After IP, samples are washed in columns stacked behind sieve valves SV1-16, and collected from the device. All fluids are driven by pneumatic, non-pulsatile pressure at 5 psi.
Cell culture
HeLa cells from the ATCC and were propagated in DMEM (Invitrogen) plus 10% fetal bovine serum, and grown to confluency before harvesting. Murine embryonic fibroblasts (MEF) were derived from 13.5-day-old mouse embryos using standard protocol, and propagated in DMEM (Invitrogen) plus 15% FBS, as described previously.27
Conventional ChIP assay
The conventional ChIP protocol used on HeLa cells to validate HTChIP is described in a previous publication.28
Microfluidic ChIP assay (HTChIP)
Fig. 2 shows a labeled schematic of the device where different stages of ChIP are performed. Fig. S1 illustrates the process flow for a ChIP assay performed using HTChIP.
Cell and chromatin processing
Cells were processed as previously described.27 Briefly, cells were treated with TNF-α (20 ng ml−1) for the indicated times. DNA was cross-linked for 10 min with 1% formaldehyde and stopped in 0.125 M glycine. Purified chromatin was sonicated to ~500 bp using the Bioruptor (Diagenode, Inc). The final chromatin concentration was 25 000 cells μL−1 equivalent. Fragmented chromatin was snap frozen and stored at −80°C in single use aliquots (20 μL each) to avoid repeated freeze/thaw cycles.
Immunoprecipitation and wash
Before each experiment, the inside surface of the device is treated with 0.2% pluronic solution (0.2% w/v cell culture grade Pluronic F127 (Sigma) in DPBS (Dulbecco’s Phosphate Buffered Saline) (GIBCO)) for 15 min, followed by rinsing with DPBS and air drying. The device has dedicated inlets ‘A’ for flowing in Pluronic solution, and inlets ‘B’ for washing with DPBS. Inlets marked ‘Air’ are used to introduce air into the device for drying (Fig. 2).
The rings are pre-loaded with antibody-functionalized beads (Protein A Dynabeads (Invitrogen) with antibodies) between the two valves in the black-boxed regions shown in Fig. 2, by flowing beads through Inlets 1–16 to outlets 1–16 (Fig. S1-i). Sieve valves trap the beads to make a bead column (Fig. S1–ii). Antibodies are loaded into rings randomly, with no specific assignment of antibody to a specific ring from experiment to experiment. Roughly 2 μL of antibody-conjugated beads are loaded into each ring for each ChIP assay, which corresponds to just under 0.5 ug of antibody. 1.6 μL of chromatin is reserved as Input reference, equivalent to four times the amount of chromatin used in each ChIP measurement. The remaining chromatin is introduced into all the rings by flowing it in through inlet marked ‘In’ (Fig. 2, green-boxed). If two samples are to be processed simultaneously with 8 measurements each sample, then the two independent ‘In’ inlets are used to load different chromatin samples to the two sides of the device: Rings 1–8 loaded with one sample, Rings 9–16 loaded with another (as demonstrated in Fig. 1 by the green and blue color dyes). Alternatively, both ‘In’ inlets can be used to load the same sample into all of Rings 1–16 to achieve 16 measurements on a single sample. The bifurcated channels divide the chromatin into equal parts of 10 000 cell equivalents per ring: 0.4 μL volume ring filled with 25 000 cells μL−1 equivalent chromatin. No outlets are opened in this step, so that the rings can be “dead-end filled’ with chromatin; opening outlets will result in loss of chromatin (Fig. S1–iii). Dead-end filling is possible because PDMS is gas permeable; in a matter of minutes the air in the rings is expelled and replaced by liquid. During IP, the antibody-beads are mixed with the chromatin for 2 h, and the device is placed on a Peltier device set at 4 °C (Fig. S1–iv).
After IP, the beads are re-stacked in a column behind sieve valves SV1–SV16 (Fig. S1–v), and washed for 10 min with RIPA buffer (10 mM Tris-HCl pH 7.5, 1 mM EDTA, 0.5 mM EGTA, 1% Triton X-100, 0.1% SDS, 0.1% Na-deoxycholate, 140 mM NaCl) introduced through inlets ‘W1’ (Fig. S1–vi). Inlets ‘W2’ and ‘W3’ were unused in this case, but could be used to flow in other wash buffers if a multi-buffer wash system is desired. When washing, the pneumatic pressure on the wash buffers is adjusted to 5 psi to better control wash volume. A lower pressure also prevents specifically bound materials from being stripped off the antibodies under high shear forces and lost. Following the RIPA wash, the beads were eluted into thin-walled PCR tubes with a minimal amount of TE (10 mM Tris-HCl, 1 mM EDTA pH 8.0). These PCR tubes were then immediately placed on a magnet and the DPBS removed with a pipette leaving only the magnetic beads. The DNA was then purified from the beads using the Chelex (Bio-Rad) resin extraction method described previously.29 An ethanol precipitation was done on the input sample by adding 250 μL of 100% ethanol (Sigma-Aldrich), 2 μL of carrier glycoblue (Invitrogen), and 16 μL of 5 M NaCl to the sample and precipitating at −80 °C for one hour. The precipitated sample was then centrifuged at 20 000 g for 15 min, and the supernatant discarded. The pellet was washed in 500 μL of freshly prepared and chilled 70% ethanol, and then centrifuged again at 20 000 g for 10 min. Finally, the supernatant was discarded and the pellet left to air dry. Once the pellet was dry, the same Chelex resin extraction was applied in parallel with the IP samples. The purified DNA was used directly in the real-time quantitative SYBR green PCR reactions (qPCR).
Real-time qPCR
Real-time qPCR reactions were performed using Taqman probes (IDT) or SYBRgreen ER (Invitrogen), in a Stratagene thermo-cycler (Roche). Sequences of PCR primers used were taken from Kawahara et al.27,28 with the permission of the authors, and are provided in Table 1. The following thermal cycling profile was used: Hot start 95 °C for 10 min, followed by 40 cycles of 95 °C for 15 s, 57 °C for 30 s, 72 °C for 30 s. Primer concentrations were 0.5 μM. In the case of SYBRgreen assays, post-run melt curve analysis was used to confirm that all products formed were full length and not primer dimers.
Table 1.
Sequences of primers and probes to promoter regions that were used in qPCR reactions to evaluate ChIP experiment enrichments
| HeLa Primers | ||
|---|---|---|
| Iap2 | Forward | CCA CGA GCA ATG AAG CAA ATG TC |
| Reverse | GGG GAA CTC CAG CGG TAA TAA C | |
| Probe | TCC AGT AAA TGC CGC GAA G | |
| Mnsod | Forward | AGGTCGGCTTACTTGCAAAGC |
| Reverse | CGCCCTTCCAACCCGTAT | |
| Probe | TACGGCGCAAGAGT | |
| Nfkbia | Forward | GCAGCCCCCTAACCACAGT |
| Reverse | CTGGGCGTAGGGATTTGCT | |
| Probe | TTCCCCTTAGAAGTCTG | |
| Il8 | Forward | GGCCATCAGTTGCAAATCGT |
| Reverse | CCTACTAGAGAACTTATGCACCCTCAT | |
| Probe | ATTTCCTCTGACATAATGAA | |
| MEF Primers | ||
|---|---|---|
| Nfkbia | Forward | GCC ATG GAG CAA ACC CAT AG |
| Reverse | ATT CCA TAG CGG GAG GTG TCT | |
| Nfkb2 | Forward | CCA TGG CAG CGA CTC TTG T |
| Reverse | CTG CCT TCC CCC TGC AT | |
| Cdkn1a | Forward | TCT TCC AGT CCT TGG AGA CC |
| Reverse | GCA CCT GGA ATC CCT AGA AA | |
| Dll1 | Forward | GCG TGG CTG TCA TTA AGG |
| Reverse | GGT GCT GTC TGC ATT ACC | |
Results and discussion
HTChIP demonstrates improved IP efficiency
Presently, ChIP used in screening applications is not restricted by the quantity of starting material; therefore, we designed the HTChIP to be compatible with relative larger quantities of chromatin that has been isolated and fragmented using conventional means. Previously, we reported a similar microfluidic platform, AutoChIP, which can perform ChIP measurements on as few as 2000 cells.24 We observed higher enrichment of target proteins in AutoChIP than in the conventional benchtop ChIP and proposed that this higher level of enrichment might be due to improved antibody-target interactions facilitated by a smaller reaction volume, leading to a higher IP efficiency. Since our previous design uses chromatin generated in situ, we wanted to first verify that (1) the HTChIP design still takes advantage of the smaller reaction volume to deliver similar gains in IP efficiency as reported in the AutoChIP design, and (2) while using conventionally treated chromatin as input as opposed to chromatin generated in situ.
To test these hypotheses we isolated and sheared chromatin from a HeLa cell line, and performed ChIP using a conventional approach as well as our HTChIP platform for a direct comparison of IP efficiency. In both approaches, different antibodies were conjugated to Protein A-covered magnetic beads, but the IP was performed either in a microcentrifuge tube for the conventional method, or in a microfluidic mixing chamber for the HTChIP (see Fig. S1 for schematic of microfluidic ChIP experimental flow). 40 000 cells were used for each ChIP assay. After ChIP, qPCR against four genomic loci was used to evaluate the IP performance of each method. The genomic loci of interest lie in the promoter region of NF-κB target genes: IAP2, MnSOD, IL8, and NFKBIA.
Fig. 3 shows results for the IP using anti-H3K9Ac (antibody against acetylated-lysine-9-on-histone-3), and from these results it is evident that while preserving the patterns of relative enrichment between different genomic loci, the IP performed using HTChIP generated a significantly higher signal than that performed in a conventional microcentrifuge tube (p-values < 0.01 for all loci tested). The same outcome was observed for the IP of anti-PanH3 (antibody against core histone H3), indicating that the improvement in IP efficiency is a general phenomenon and not antibody specific (Fig. S1). A slight increase in the background signal, as determined by IP using anti-IgG (antibody against non-specific IgG), was also observed (Fig. S2). This is consistent with previous observations made by our group and others,24,29–31 but the magnitude of the increase in background is much lower than the increase in signal observed in the other ChIP assays. That is, the HTChIP method resulted in a net signal increase over the conventional method. This confirms our hypothesis that simply performing the IP in a microfluidic reaction chamber results in higher IP efficiency and target enrichment, even when using the same starting amount of chromatin.
Fig. 3.

Bar graph comparing IP efficiency between IP performed in a microcentrifuge tube on the benchtop, and the microfluidic environment of HTChIP. ChIP was performed using anti-acetylated-histone-3-lysine-9. The HTChIP signal was significantly higher than the signal from the microcentrifuge tube based method, with a p-value < 0.01 (unpaired Student’s T-test) for each genomic loci tested. Since the metric being compared is raw IP efficiency, enrichment values were not normalized to any background or control ChIP, but rather displayed as ratio to non-normalized Input values. Error bars represent standard error over three (3) PCR replicates.
HTChIP accurately reflects protein-DNA binding patterns in the cell after stimulation
Next we demonstrate that the HTChIP can accurately capture the changes (or lack thereof) in the cell’s protein-DNA interactions induced by drug treatment of the cell. HeLa cells were treated with TNF-α for 1 h, and subsequently subject to ChIP-qPCR using the same antibodies and PCR primers in order to assess changes in histone binding induced by the stimulation. In this model system, TNF-α treatment induces translocation of NF-κB into the cell nucleus, where it binds to the promoters of genes to initiate gene transcription.32 In individual cells, NF-κB binding is highly dynamic and periodic, and for some target genes, specific histone modification patterns are incited at the target gene promoter to prevent repeated activation of that gene upon prolonged stimulation with TNF-α.33 These histone modifications regulate chromatin structure, which can control chromatin openness and accessibility.34 For example, H3K9Ac is a modified histone mark that is found near open chromatin in regions of active transcription.34 Prior work in this particular cell line determined that the presence of H3K9Ac at the four promoter regions of interest is cyclic to prevent repeated NF-κB activation of the associated genes.28 The period of this cycle was found to be 1 h, therefore if we only observe the zero and 1 h time point, we would expect to find no overall change in H3K9Ac levels at the four promoters of interest (i.e. any changes in H3K9Ac levels at these promoters would only be observed at intermediate time points of TNF-α stimulation).
Indeed, a Bonferroni corrected Student’s two-tailed T-Test with a significance level of p = 0.01 found that the level of H3K9Ac binding at all the tested genomic loci did not significantly differ between TNF-α stimulate cells and untreated cells, when assessed using the conventional ChIP assay (Fig. 4, Fig. S3). When we performed the same test on the ChIP results generated using HTChIP, the same trend was observed: No significant difference was found in the level of H3K9Ac binding at the genomic loci of interest (Fig. 4, Fig. S3). This result leads us to believe that the HTChIP can reliably be used to assess and compare in vivo protein-DNA binding events in untreated cells and cells that have been subject to external stimuli.
Fig. 4.

Bar graphs showing ChIP enrichment of H3K9Ac of HeLa cells with and without TNF-α stimulation, measured at NFκB target promoters. Left graphs show results obtained using HTChIP; right graphs show results obtained using conventional benchtop protocol. Each graph shows H3K9Ac enrichment at the loci of interest without TNF-α stimulation on the left, and with 1 h of TNF-α treatment on the right. For benchtop ChIP, there is no significant difference between H3K9Ac levels at these gene promoters in untreated and treated cells; data from HTChIP leads to the same conclusion (Bonferroni corrected unpaired Student’s T-test at α = 0.01). Both sets of results concur with those previously reported in literature. In each ChIP, enrichments were normalized to PanH3 levels for comparability, and non-specific anti-IgG was used as background control. Error bars represent standard error over three (3) PCR replicates for both HTChIP and benchtop ChIP experiments.
“ChIP-grade” antibody screening using HTChIP is fast and effective
As mentioned previously, there are now many antibodies available that are marketed as “ChIP-grade”. However, due to batch variation, even the same antibody clone may generate antibody lots that produce variable ChIP results. The highly parallel nature of HTChIP is designed to address this problem, allowing users to simultaneously interrogate multiple antibody lots or antibodies from different suppliers, in order to assess and choose the best antibody for their application. To test demonstrate the utility of our microfluidic platform in this respect, we procured three different lots of anti-SIRT6 antibody at random from a single supplier (Abcam), and tested them, along with the relevant controls, on our HTChIP platform using chromatin isolated from murine embryonic fibroblasts. MEF is a primary cultured cell directly derived from mouse embryos that is more difficult to obtain and to propagate in culture; unlike HeLa cells, MEFs are not immortalized and can only be sustained for 10–15 passages before reaching scenescence.35 We chose MEFs as a model system because of its importance in embryonic stem cell culture and studies,36–39 and because we have previously studied the response of MEFs to TNF-α stimulation in the context of SIRT6 mediated chromatin remodeling.27 We generated chromatin from MEFs that were stimulated for 30 min with TNF-α, and performed 6 different ChIP assays on this material: anti-FLAG, anti-PanH3, anti-H3K9Ac, anti-SIRT6 Lot 02, anti-SIRT6 Lot 14, anti-SIRT6 Lot 77. Anti-FLAG is used as a background negative control; anti-PanH3 and anti-H3K9Ac are used as positive control to ensure that the HTChIP experiment is working. Lot numbers of SIRT6 antibodies represent the last two digits of the manufacturer’s lot number for each antibody. For each ChIP experiment, 10 000-cell equivalent of chromatin was used, and results were assessed by qPCR of four gene promoters: Nfkb2, Nbkbia, Cdkn1a, Dll1. Nfkb2, Nfkbia are canonical NF-κB target genes, and based on our previous work, it is known that after 30 min of TNF-α treatment, H3K9Ac will be present at these promoters to facilitate transcription of these genes by NF-κB, and that SIRT6 will also bind to these promoters to begin H3K9 deacetylation in order to restrict continual activation of these genes in the event of sustained TNF-α stimulation. After 60 min of TNF-α stimulation, H3K9 is deacetylated to induce a closed chromatin structure at these promoters, and these promoters are devoid of both H3K9Ac and SIRT6. The CDKN1A promoter is occupied by SIRT6 independent of TNF-α stimulation, and was selected as a positive control. DLL1 promoter is not bound by SIRT6, and was included as a negative control.
Fig. 5 shows the results of this ChIP antibody screening experiment. First, note that the signal for DLL1 enrichment is low regardless of the antibody used. This suggests that the ChIP pull down was specific, and did not enrich for regions not bound by SIRT6. For other promoters, these results clearly show the amount of variability between these three lots of SIRT6 antibody in terms of sensitivity. Lot 77 signal levels in the promoter regions that should be enriched are comparable to that of DLL1 negative control. This result indicates that SIRT6-lot 77 did not pull down any specific SIRT6 protein in the IP. Lots 02 and 14 both demonstrated superior sensitivity than lot 77, with signals much higher than background, but lot 14 is clearly the superior lot, with higher signal to background ratio than lot 02 for every promoter region that was tested.
Fig. 5.
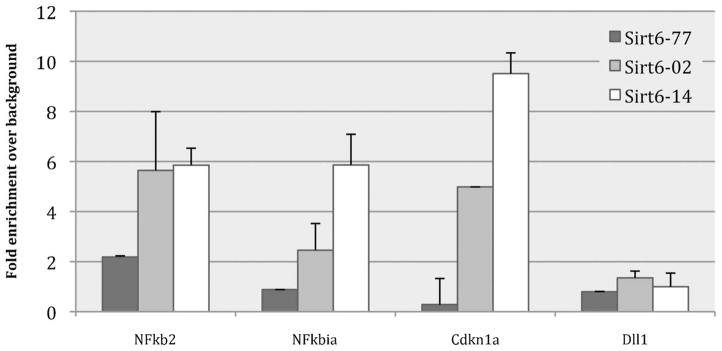
Bar graph of HTChIP results comparing ChIP enrichment obtained using three different batches of an anti-SIRT6 antibodies generated from the same antibody clone. Dll1 is included as a negative control promoter; Cdkn1a is a positive control promoter. From this graph, lot #14 is the SIRT6 antibody lot with highest sensitivity and specificity. ChIP enrichment is shown here as fold enrichment over background control to highlight the difference in specificity between antibody lots. Error bars represent standard error over three (3) technical replicates.
In order to demonstrate the versatility of HTChIP with different cell and antibody systems, we performed a similar antibody screening experiment, using chromatin from an immortalized mouse lymphoma cell line (6780) that expresses MYC. Three anti-MYC antibodies from three different sources were tested for ChIP application using our HTChIP platform. The Odc1 promoter was the genomic loci of interest as it is a known site for MYC binding. The Odc1 E-box region contains a transcription factor binding motif and serves as the MYC binding site where enrichment for MYC should be high. A control region 1 kbp upstream of the E-box motif, Odc1 upstream, was used as the negative control region where MYC enrichment should be low. Once again, results in Fig. 6 reveals the high degree of variation between antibodies, this time procured from different sources. The anti-MYC from Epitomics gave the greatest amount of signal, and is therefore the most sensitive antibody, however it is lacking specificity, as it appears to have enriched the non-specific upstream region as well. The Abcam anti-MYC was the worst performer, giving almost no signal at all. The Santa Cruz antibody was intermediate, with a much lower E-box enrichment than Epitomics, but also a much lower upstream non-specific enrichment, thus it has the highest signal to background ratio. Depending on the purpose of the ChIP assay that will be performed, one may either prefer the Epitomics anti-MYC for its sensitivity (for example when interrogating endogenous MYC, which occurs at relatively low levels), or choose the Santa Cruz anti-MYC for its specificity (for example when the sample is over-expressing MYC, and false positives are undesirable).
Fig. 6.

Bar graph of HTChIP results comparing ChIP enrichment obtained using three different anti-MYC antibodies from different vendors. Odc1 Upstream is the negative control region; Odc1 E-box is the positive control Odc1 promoter. From this graph, sc-764 has the best signal to noise, but Epitomics 1472-1 has higher sensitivity and higher signal. Note that anti-FLAG was used as the non-specific background control. Since enrichment for FLAG is zero (no PCR C(t) value), it is mathematically not possible to calculate the fold enrichment over background. Therefore here ChIP enrichment is shown as a ratio over Input without any normalization. Error bars represent standard error over three (3) technical replicates.
The experiments described above highlight the advantages of using HTChIP for antibody screening applications: since only 10 000 cells were used for each ChIP, very little cell sample is consumed when using HTChIP for antibody screening. In addition, < 0.5 μg of antibody was used for each ChIP. For low throughput research studies, this means that most of the valuable sample and now ChIP-validated antibody can be reserved for meaningful high quality ChIP experiments, instead of being wasted on failed ChIP experiments due to poor antibody quality. For high throughput industrial screening applications, this means that the same biological sample can be used to screen more antibodies, and the same antibody batch used to screen more drugs, rather than having to compare results generated from different antibody batches or pooled biological samples that may have introduce heterogeneity, and lead to confounding results.
Tracking dynamic transcription factor and chromatin remodeling with HTChIP
After identifying a SIRT6 antibody with good sensitivity and specificity, we used HTChIP to track the interaction of SIRT6 and H3K9Ac at canonical NF-κB target promoters over a high-resolution time course (Fig. 7-data for untreated cells was previously published27). Our results confirm previous findings that SIRT6 binds quickly to NF-κB target promoters after stimulation with TNF-α, and subsequently leads to H3K9 deacetylation and thus transcriptional repression at that site.27 Both NF-κB target promoters show no occupancy by SIRT6 or H3K9Ac prior to TNF-α stimulation. After 30 min of TNF-α treatment, H3K9 is acetylated to allow an open chromatin structure and gene transcription by NF-κB at these promoters, as indicated by high levels of enrichment for H3K9Ac. At the same time, SIRT6 is found poised at these promoters. After 60 min of treatment, SIRT6 localization to these promoters has led to H3K9 deacetylation and transcriptional repression, and because H3K9 is no longer acetylated, SIRT6 also no longer occupies these promoter regions, and we observe enrichment for both SIRT6 and H3K9Ac at a level that is similar to that of untreated MEFs. We simultaneously interrogated two other histone marks, H3K9m2 (histone-3-lysine-9-dimethylated) and H3K9m3 (histone-3-lysine-9-trimethylated). H3K9m2 is a mark of transcriptional repression, and H3K9m3 is a mark of constitutive heterochromatin.34 Interestingly, in our data H3K9m2 binding trends over time also confirms the pattern of periodic transcriptional activation that was observed with H3K9Ac and SIRT6. Untreated cells and cells stimulated for 60 min show a higher level of H3K9m2 binding at NF-κB target promoters, confirming that these regions are in heterochromatin form and transcription is repressed. Whereas at 30 min of stimulation, H3K9m2 levels decrease while H3K9Ac levels increase, again validating our finding that these promoter regions are transcriptionally active at this time. To the best of our knowledge, these findings on the modulation of H2K9m2 in the context of SIRT6 and NF-κB activity were previously unreported in the literature. H3K9m3 levels at these promoters are low, independent of TNF-α stimulation, indicating that these regions are not constitutively silenced; instead transcription at these sites is active but dynamically regulated by protein-DNA interactions.
Fig. 7.
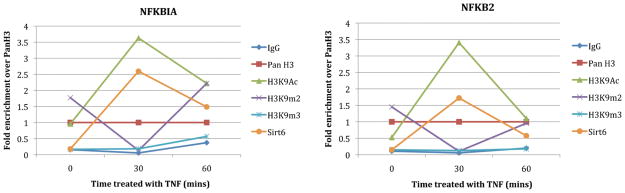
Line graph of HTChIP results showing ChIP enrichment of various histone marks and SIRT6 at canonical NFκB promoters in MEF cells after stimulation with TNF-α for different amounts of time. SIRT6 is recruited to NFκB promoters after 30 min of stimulation and leads to deacetylation of H3K9. This demonstrates that HTChIP is sensitive enough to track changes in enrichment levels over a fine temporal resolution, and allows tracing of many protein simultaneously, generating a holistic picture of dynamic intracellular protein-DNA interaction.
Importantly, this set of tracking assays used only one biological sample for each time point, and there was no need to pool any samples, even though 6 ChIP assays were performed for each time point. A conventional bench-top ChIP protocol would have needed 500 000 cells for each ChIP, requiring a total of 3.5 million cells for each time point, whereas the HTChIP can perform several replicate assays at each time point using the same number of cells. Particularly for cells that are difficult to obtain or culture, this is an advantage that saves time and resources.
Conclusions
We have presented a high throughput, low consumption, automated microfluidic device for ChIP for drug screening and antibody validation, HTChIP. This device has a 7-fold throughput improvement over our previously reported microfluidic ChIP device, and the design can be easily scaled up to accommodate even more assays in parallel. To make the device fully automatable, and to take advantage of existing front-end research infrastructure and practices, HTChIP has been designed to take as input fragmented chromatin that was prepared in bulk using conventional methods, as opposed to fixed whole cells. We believe that with these design considerations, the HTChIP platform will be an effective and efficient tool for researchers in both industry and academic settings, particularly in antibody screening, drug screening, and epigenetic characterization studies.
In this report, we have detailed the design, fabrication and method of use for the HTChIP platform, which are amenable to both scaled commercialization and individual use. Proof-of-concept experimental data were presented to demonstrate significantly superior IP efficiency using HTChIP as compared to conventional benchtop methods, and despite slight increases in background, using HTChIP produces a net increase in ChIP signal. Next we show that HTChIP is able to faithfully reproduce results of an epigenetic study. In testing whether a specific histone-DNA binding increased in certain genomic regions upon inflammatory stimulation of the cell, data generated using HTChIP leads to the same conclusion as data generated using conventional ChIP protocols. The conclusion that there is no change in specific histone-DNA binding levels at the loci of interest is substantiated by the literature.28 This microfluidic ChIP platform was also tested for antibody screening capability by performing ChIP with a large number of antibodies in parallel and evaluating antibody specificity by qPCR, and was able to distinguish good ChIP antibodies from poor ones. Finally, we demonstrate the use of HTChIP in tracking TNF-α induced transcription factor binding events in MEF cells. We successfully measured the effect of the transcription factor SIRT6 binding on the levels of H3K9Ac binding at specific genomic loci with a fine temporal resolution. The results of this study were in concordance with previous findings about the regulatory mechanism of SIRT6,27 again showing the robustness of HTChIP in producing reliable ChIP data.
Overall, this data from a series of characterization assays confirm that this HTChIP platform can rapidly and accurately evaluate the epigenetic states of a cell. It is sensitive enough to detect the changes in the epigenetic state induced by a cytokine stimulant over a fine temporal resolution, and allows tracing of many protein simultaneously, generating a holistic picture of dynamic intracellular protein-DNA interaction. With these results, we believe that HTChIP can introduce large improvements in routine ChIP, antibody screening, and drug screening efficiency, and given its ease of manufacturing, scalability, and automation it will be a valuable tool in the biotechnology research space.
Supplementary Material
Acknowledgments
The authors thank J. Wang, Dr C. H. Fan, Dr N. Jiang, Dr M. Meiers, and W. Gu for helpful discussion and advice. W. Koh for fruitful dialogue on data analysis. A. Adams, G. Su, and P. Nazh for device fabrication. This work has been funded by NCI, DoD, Pioneer, and Ellison Medical Foundation grants; the author also thanks the Bio-X Foundation Fellowship and Siebel Foundation Scholarship for their support.
Footnotes
Published as part of a LOC themed issue dedicated to research from the USA: Guest Editors Don Ingber and George Whitesides
Electronic supplementary information (ESI) available. See DOI: 10.1039/c2lc21290k
References
- 1.Solomon MJ, Larsen PL, Varshavsky A. Cell. 1988;53:937–947. doi: 10.1016/s0092-8674(88)90469-2. [DOI] [PubMed] [Google Scholar]
- 2.Dedon PC, Soults JA, Allis CD, Gorovsky MA. Anal Biochem. 1991;197:83–90. doi: 10.1016/0003-2697(91)90359-2. [DOI] [PubMed] [Google Scholar]
- 3.Dedon PC, Soults JA, Allis CD, Gorovsky MA. Mol Cell Biol. 1991;11:1729–1733. doi: 10.1128/mcb.11.3.1729. [DOI] [PMC free article] [PubMed] [Google Scholar]
- 4.Grewal SI, Moazed D. Science. 2003;301:798–802. doi: 10.1126/science.1086887. [DOI] [PubMed] [Google Scholar]
- 5.Esteller M. Nat Rev Genet. 2007;8:286–298. doi: 10.1038/nrg2005. [DOI] [PubMed] [Google Scholar]
- 6.Gal-Yam EN, Saito Y, Egger G, Jones PA. Annu Rev Med. 2008;59:267–280. doi: 10.1146/annurev.med.59.061606.095816. [DOI] [PubMed] [Google Scholar]
- 7.Esteller M. N Engl J Med. 2008;358:1148–1159. doi: 10.1056/NEJMra072067. [DOI] [PubMed] [Google Scholar]
- 8.Miao F, Gonzalo IG, Lanting L, Natarajan R. J Biol Chem. 2004;279:18091–18097. doi: 10.1074/jbc.M311786200. [DOI] [PubMed] [Google Scholar]
- 9.Miao F, Smith DD, Zhang L, Min A, Feng W, Natarajan R. Diabetes. 2008;57:3189–3198. doi: 10.2337/db08-0645. [DOI] [PMC free article] [PubMed] [Google Scholar]
- 10.Fraga MF, Ballestar E, Villar-Garea A, Boix-Chornet M, Espada J, Schotta G, Bonaldi T, Haydon C, Ropero S, Petrie K, Iyer NG, Perez-Rosado A, Calvo E, Lopez JA, Cano A, Calasanz MJ, Colomer D, Piris MA, Ahn N, Imhof A, Caldas C, Jenuwein T, Esteller M. Nat Genet. 2005;37:391–400. doi: 10.1038/ng1531. [DOI] [PubMed] [Google Scholar]
- 11.Wang JC, Derynck MK, Nonaka DF, Khodabakhsh DB, Haqq C, Yamamoto KR. Proc Natl Acad Sci U S A. 2004;101:15603–15608. doi: 10.1073/pnas.0407008101. [DOI] [PMC free article] [PubMed] [Google Scholar]
- 12.Testa A, Donati G, Yan P, Romani F, Huang TH, Vigano MA, Mantovani R. J Biol Chem. 2005;280:13606–13615. doi: 10.1074/jbc.M414039200. [DOI] [PubMed] [Google Scholar]
- 13.Hearnes JM, Mays DJ, Schavolt KL, Tang L, Jiang X, Pietenpol JA. Mol Cell Biol. 2005;25:10148–10158. doi: 10.1128/MCB.25.22.10148-10158.2005. [DOI] [PMC free article] [PubMed] [Google Scholar]
- 14.Wang Y, Krishnan HR, Ghezzi A, Yin JC, Atkinson NS. PLoS Biol. 2007;5:e265. doi: 10.1371/journal.pbio.0050265. [DOI] [PMC free article] [PubMed] [Google Scholar]
- 15.Comley J. SBS 16th Annual Conference & Exhibition; Phoenix, Arizona. 2010. [Google Scholar]
- 16.O’Neill LP, VerMilyea MD, Turner BM. Nat Genet. 2006;38:835–841. doi: 10.1038/ng1820. [DOI] [PubMed] [Google Scholar]
- 17.Acevedo LG, Iniguez AL, Holster HL, Zhang X, Green R, Farnham PJ. BioTechniques. 2007;43:791–797. doi: 10.2144/000112625. [DOI] [PMC free article] [PubMed] [Google Scholar]
- 18.Nelson JD, Denisenko O, Bomsztyk K. Nat Protoc. 2006;1:179–185. doi: 10.1038/nprot.2006.27. [DOI] [PubMed] [Google Scholar]
- 19.Dahl JA, Collas P. Front Biosci. 2007;12:4925–4931. doi: 10.2741/2438. [DOI] [PubMed] [Google Scholar]
- 20.Dahl JA, Collas P. Stem Cells. 2007;25:1037–1046. doi: 10.1634/stemcells.2006-0430. [DOI] [PubMed] [Google Scholar]
- 21.Flanagin S, Nelson JD, Castner DG, Denisenko O, Bomsztyk K. Nucleic Acids Res. 2008;36:e17. doi: 10.1093/nar/gkn001. [DOI] [PMC free article] [PubMed] [Google Scholar]
- 22.Park PJ. Nat Rev Genet. 2009;10:669–680. doi: 10.1038/nrg2641. [DOI] [PMC free article] [PubMed] [Google Scholar]
- 23.Making The ChIP Grades. http://www.epigenie.com/Insights/Making-The-ChIP-Grades-Millipore-ChIP-AbPlus.html.
- 24.Wu AR, Hiatt JB, Lu R, Attema JL, Lobo NA, Weissman IL, Clarke MF, Quake SR. Lab Chip. 2009;9:1365–1370. doi: 10.1039/b819648f. [DOI] [PMC free article] [PubMed] [Google Scholar]
- 25.Marcus JS, Anderson WF, Quake SR. Anal Chem. 2006;78:3084–3089. doi: 10.1021/ac0519460. [DOI] [PubMed] [Google Scholar]
- 26.Marcus JS, Anderson WF, Quake SR. Anal Chem. 2006;78:956–958. doi: 10.1021/ac0513865. [DOI] [PubMed] [Google Scholar]
- 27.Kawahara TL, Rapicavoli NA, Wu AR, Qu K, Quake SR, Chang HY. PLoS Genet. 2011;7:e1002153. doi: 10.1371/journal.pgen.1002153. [DOI] [PMC free article] [PubMed] [Google Scholar]
- 28.Kawahara TL, Michishita E, Adler AS, Damian M, Berber E, Lin M, McCord RA, Ongaigui KC, Boxer LD, Chang HY, Chua KF. Cell. 2009;136:62–74. doi: 10.1016/j.cell.2008.10.052. [DOI] [PMC free article] [PubMed] [Google Scholar]
- 29.Dahl JA, Collas P. Nat Protoc. 2008;3:1032–1045. doi: 10.1038/nprot.2008.68. [DOI] [PubMed] [Google Scholar]
- 30.Dahl JA, Collas P. Nucleic Acids Res. 2008;36:e15. doi: 10.1093/nar/gkm1158. [DOI] [PMC free article] [PubMed] [Google Scholar]
- 31.Attema JL, Papathanasiou P, Forsberg EC, Xu J, Smale ST, Weissman IL. Proc Natl Acad Sci U S A. 2007;104:12371–12376. doi: 10.1073/pnas.0704468104. [DOI] [PMC free article] [PubMed] [Google Scholar]
- 32.Hayden MS, Ghosh S. Genes Dev. 2004;18:2195–2224. doi: 10.1101/gad.1228704. [DOI] [PubMed] [Google Scholar]
- 33.Foster SL, Hargreaves DC, Medzhitov R. Nature. 2007;447:972–978. doi: 10.1038/nature05836. [DOI] [PubMed] [Google Scholar]
- 34.Kouzarides T. Cell. 2007;128:693–705. doi: 10.1016/j.cell.2007.02.005. [DOI] [PubMed] [Google Scholar]
- 35.Xu J. Curr Protoc Mol Biol. 2005;Chapter 28(Unit 28):21. doi: 10.1002/0471142727.mb2801s70. [DOI] [PubMed] [Google Scholar]
- 36.Reubinoff BE, Pera MF, Fong CY, Trounson A, Bongso A. Nat Biotechnol. 2000;18:399–404. doi: 10.1038/74447. [DOI] [PubMed] [Google Scholar]
- 37.Schatten G, Smith J, Navara C, Park JH, Pedersen R. Nat Methods. 2005;2:455–463. doi: 10.1038/nmeth0605-455. [DOI] [PubMed] [Google Scholar]
- 38.Thomson JA, Itskovitz-Eldor J, Shapiro SS, Waknitz MA, Swiergiel JJ, Marshall VS, Jones JM. Science. 1998;282:1145–1147. doi: 10.1126/science.282.5391.1145. [DOI] [PubMed] [Google Scholar]
- 39.Thomson JA, Marshall VS. Curr Top Dev Biol. 1998;38:133–165. doi: 10.1016/s0070-2153(08)60246-x. [DOI] [PubMed] [Google Scholar]
Associated Data
This section collects any data citations, data availability statements, or supplementary materials included in this article.