

Abstract
Objective
Cartilage injury can lead to post-traumatic osteoarthritis (PTOA). Immediate post-trauma cellular and structural changes are not widely understood. Furthermore, current cellular-resolution cartilage imaging techniques require sectioning of cartilage and/or use of dyes not suitable for patient imaging. In this study, we used multiphoton microscopy (MPM) data with FDA-approved sodium fluorescein to identify and evaluate the pattern of chondrocyte death after traumatic injury.
Method
Mature equine distal metacarpal or metatarsal osteochondral blocks were injured by 30 MPa compressive loading delivered over 1 sec. Injured and control sites were imaged unfixed and in situ 1 hour post-injury with sodium fluorescein using rasterized z-scanning. MPM data was quantified in MATLAB, reconstructed in 3-D, and projected in 2-D to determine the damage pattern.
Results
MPM images (600 per sample) were reconstructed and analyzed for cell death. The overall distribution of cell death appeared to cluster into circular (n=7) or elliptical (n=4) patterns (p=0.006). Dead cells were also prevalent near cracks in the matrix, with only 26.3% (SE=5.0%, p<0.0001) of chondrocytes near cracks being viable.
Conclusion
This study demonstrates the first application of MPM for evaluating cellular-scale cartilage injury in situ in live tissue, with clinical potential for detecting early cartilage damage. With this technique, we were able to uniquely observe two death patterns resulting from the same compressive loading, which may be related to local variability in matrix structure. These results also demonstrate proof-of-concept MPM diagnostic use in detecting subtle and early cartilage damage not detectable in any other way.
Keywords: Imaging, multiphoton microscopy, cartilage, post-traumatic osteoarthritis, injury
INTRODUCTION
Osteoarthritis (OA) is a degenerative, multifactorial disease affecting the world population.1-3 Knowledge of severe cartilage damage has led to therapies targeting symptom management, but understanding the early events in OA can facilitate the development of effective modalities in disease intervention. However, limited high resolution imaging of cartilage damage in the clinical setting has hindered early disease identification. Current medical imaging modalities including magnetic resonance imaging (MRI) and computed tomography (CT) do not have the resolution necessary to detect small cartilage injuries that can occur after joint truama which lead to post-traumatic OA (PTOA). Without the ability to detect these micron-sized structural or cellular changes, it is difficult to understand the progression of PTOA and facilitate its prevention. Developing methods for detecting early cartilage damage in vivo can expand the understanding of cartilage degeneration immediately after tissue damage.
Multiphoton microscopy (MPM) is capable of imaging live biological samples, including cartilage at submicron resolution, yielding structural details at depths greater than possible with confocal microscopy.4 Importantly, MPM can be adapted for in vivo imaging with diagnostic application, including distinguishing normal versus abnormal or cancerous tissue,5-8 and it is being developed into a fast-scanning endoscope.9 Diagnostic in vivo MPM can be adapted to cartilage because of the high collagen content of the cartilage extracellular matrix (ECM). Collagen emits second harmonic generation (SHG), making it readily detectable without staining.10 Collecting SHG signal allows the general collagen matrix of the cartilage to be easily observed. Additionally, many molecules autofluoresce with MPM,4 and additional dyes may be used to further characterize tissue. Although flourescent techniques have greatly expanded our understanding of cell biology, fluorescent labeling typically uses dyes that are unsuitable for clinical use. Sodium fluorescein is FDA-approved and is used ophthalmologically or intravenously to diagnose blood vessel disorders and corneal abrasions. Sodium fluorescein has been shown to stain cells11 by binding non-specifically to proteins,12 making it an attractive method to label cells that have compromised membranes and may be dead. However, imaging in a highly fluorescent solution like fluorescein can be difficult, but the optical capabilities of MPM make it possible. SHG and fluorescein can be used to collect high resolution information from live tissue to study the mechanisms involved in the progression of cartilage damage.
The importance of understanding the early sequence of events between cartilage trauma and OA is at the forefront of arthritis research.2,13-15 Cell death has been shown to occur after traumatic injury,2,15 but the immediate effect of compressive trauma on chondrocyte viability15 and the resulting dispersion of cell death and matrix damage around the injury site has not been studied in detail. The spatial distribution of chondrocyte death may be influenced by many factors. The superficial zone has been shown to be more susceptible than deeper cartilage layers to compressive injury.16 This phenomenon may result from zonal ECM composition and collagen orientation, which distribute load when force is applied.17,18 Evaluating chondrocyte death distrubtion in the superficial zone with MPM can further elucidate these underlying structural factors.
The goal of the current study was to use MPM to evaluate cellular damage after cartilage injury ex vivo in live tissue using an FDA-approved dye to detect chondrocyte death. Specifically, by using MPM with sodium fluorescein, we evaluated the pattern of chondrocyte death in the superficial zone immediately following traumatic injury like that which could contribute to the development of early PTOA.
METHODS
Tissue collection and injury model
The distal third metacarpus (n=3) or metatarsus (n=8) was harvested from the left (n=5) or right (n=6) limb of young adult horses (n=10, ages 4-6 years) immediately after being euthanized for reasons unrelated to this study under the guidelines and approval of the Institutional Animal Care and Use Committee. The limb was chosen at random. Cartilage was grossly evaluated and scored using the International Cartilage Repair Society (ICRS) Cartilage Injury Evaluation System (www.cartilage.org). Only healthy samples (i.e., those receiving scores of 0, 1a, or 1b) were used for the study. Osteochondral blocks (OCBs) were initially placed in HBSS with 100 IU/ml penicillin and 100 μg/ml streptomycin and then transferred to phenol red-free MEM containing 25 mM Hepes, 100 I.U./ml penicillin, and 100 μg/ml streptomycin. Dye-free media was used to prevent staining prior to microscopic imaging. In order to model early cartilage injury, OCBs were then briefly removed from the media and mounted between a custom-designed specimen-chamber and a 2.25 mm-diameter indenter on an EnduraTEC ELF3200 mechanical test frame (EnduraTec, Minnetonka, MN). The articular surface of the medial condyle, medial to the sagittal ridge and anterior to the transverse ridge, was injured under load-control with a single compression of 30 MPa19 within 1 sec (Figure 1) (mean peak stress rate 118.5 MPa s−1 [95% confidence interval (CI) 115.7-121.3]; mean strain 63% [95% CI 52-74]; mean peak strain rate 587% s−1 [95% CI 310-864]). The lateral condyle functioned as the control. After injury, OCBs were placed back into the media and incubated for 1 hour at 37°C in 5% CO2.
Figure 1.

Schematic of methods. (a) An osteochondral block is injured with compressive loading. The injured site (b) and corresponding control site (c) are each scanned with multiphoton microscopy using a rasterized pattern, alternating scanned and non-scanned regions to encompass a 3.3 mm × 3.4 mm area. Individual 328 μm × 438 μm images that comprise the larger rasterized scanned area are shown in (d) and (e), with arrows denoting fluorescein-labeled dead cells.
MPM data acquisition and staining
After incubation, OCBs were placed in 1 μM sodium fluorescein (AK-FLOUR 25%, Akorn, Inc., Lake Forest, IL) in PBS. Fluorescein was chosen for this study because it is FDA-approved and has been previously used for determining tissue viability in vivo in both animals and humans.20,21 The abillity of fluorescein to detect cell death was initially validated by dual staining of cartilage with 1 μM ethidium homodimer-1 (EthD-1, Invitrogen, Grand Island, NY) and fluorescein. Imaging was performed using a lab-built MPM instrument, in which an uncompensated beam from a modelocked Ti:sapphire laser (Tsunami pumped with a Millennia Xs; Newport, Irvine, CA) was passed through an Electro-Optic Modulator (350-80LA; Conoptics, Danbury, CT) with laboratory-built electronics for beam modulation and blanking during scan fly-back. The beam was then directed into a modified BioRad scanner (MRC-600) interfaced with a modified Olympus AX-70 upright microscope (Center Valley, PA). An excitation wavelength of 780 nm was delivered through an Olympus XLUMPlanFl 20X/0.95NA water immersion objective to obtain MPM images.22 The emission signal was separated from the excitation beam using a 670 nm long-pass dichroic. Samples were placed in fluorescein solution for 10-15 minutes and then imaged within the solution. Data was collected first with fluorescein excited at 780 nm and collected through a 380-540 emission filter. EthD-1 was then added and allowed to incubate for 30 minutes, after which the imaging was repeated with the added EthD-1 signal collected through a 560-650 nm emission filter in a second detection channel. Using this approach fluorescein was validated as an indicator of cell death, and dual staining with EthD-1 was discontinued (n=9 sites, n=1 OCB). The remainder of the data was collected using only fluorescein.
After injury, OCBs were positioned on the MPM stage, maintaining medial-lateral orientation. The sample was imaged in the transverse plane with the same instrumentation as described above. Imaging was performed starting at the articular surface and penetrating 100 μm deep to encompass the superficial zone.23 Cartilage SHG and autofluorescence, and fluorescein fluorescence were collected by photomultiplier tubes using a 360-490 nm filter for autofluorescence and SHG from the cartilage matrix, and a 510-650 nm filter for fluorescein emission. Each z-stack acquired emission from 328 × 438 μm section, with ten 10 μm z-steps. A rasterized tile scan with x=272 μm and y=312 μm sized steps acquired data from a large field 4.528 × 4.938 mm area or small field 3.328 × 3.438 mm area of the injured region and surrounding tissue, and a respective scan of the control lateral condyle (Figure 1, n=11 OCBs). Z-stacks were collected starting at the cartilage articular surface. The tiling algorithm detected the articular surface based on the emission signal intensity. The z-depth of the surface was recorded for subsequent 3D reconstruction. To minimize potential variation between samples resulting from the length of a high resolution tile scan, tiled images were collected in a grid with a reduced fill factor, resulting in 37% of the tissue being scanned. This fill factor was chosen in order to complete the small field scan within an hour. The small field scan was more readily utilized due to its shorter scan time. The large field was used on limited samples in order to confirm that the small field scan encompassed all dead chondrocytes.
After the rasterized tile scan was completed, along with additional samples, cartilage was removed from the bone to image in the sagittal plane (control n=13 OCBs from n=6 horses; injured n=10 OCBs from n=6 horses). This was performed to evaluate chondrocyte death at a depth greater than could be obtained by MPM imaging from the articular surface. Images were collected from a single z-depth penetration into the cross-section.
Chondrocyte death identification with MPM data analysis
Two-filter channel emission resulting from the transversely oriented, rasterized tile scan was processed in custom code created in MATLAB (MathWorks, Natick, MA). All chondrocytes were identified in the 380-490 nm channel emission data using code similar to public MATLAB-published “Identifying Round Objects.” The MPM emission grayscale image was first thresholded to a binary black and white image (graythresh, im2bw). Objects in the binary image were smoothed (bwareaopen), and any holes were filled (imfill) to create solid objects. The boundaries of these solid objects were identified (bwboundaries). The properties for each object including boundary coordinates, centroid coordinates, area, and perimeter were recorded (“egionprops). If the area and perimeter were each above given threshold values, both of which were optimized for each horse, the object and its centroid was recorded as a chondrocyte. To accommodate for clonal cells, which were difficult for the image analysis program to separate, threshold parameters were optimized for single, double, and triple clustered cells by allowing small, medium, and large sized objects that were than counted as one, two, or three cells, respectively. Threshold parameters were adjusted for each animal set due to the variation in image intensity, cell size, and cell clustering between animals. Injured and control images within one animal were analyzed using the same parameters.
Dead chondrocytes were identified in the 510-650 nm channel. All object boundaries recorded from the code describe above were evaluated in this channel. Each boundary was defined as the region-of-interest (roipoly), so that the presence or absence of fluorescein at this site could be determined. The mean intensity of the fluorescein image was first calculated; fluorescein-cells had an intensity above this mean, and an intensity threshold was optimized for each horse. If the bounded region was above this threshold, the cell(s) were recorded as dead.
Death pattern processing
The degree of circularity or ellipticity of the cell death pattern was determined for each horse using MATLAB custom code that calculated eigenvectors and eigenvalues of two-dimensional projections of dead cell distributions obtained from tile scans. The covariance (cov) and central point (mean) of all dead cell centroid coordinates were calculated. The eigenvector and eigenvalues (eig) were calculated for the resulting covariance. The ratio of eigenvalues, or more simply the long- and short-axes, was then used to determine if the pattern of cell death was circular or elliptical, using a threshold of less than or greater than 30% percent-difference, respectively, between the long and short axes.
Cell death near cracks and as a function of depth
Z-stack images of the injured sites were examined to identify those that contained cracks within the ECM, which were similar to but not including the image shown in Figure 2. Within these identified images, the z-stack image corresponding to 10 μm in depth from the surface was used for analysis, due to the clarity of the matrix. Within these images, each of the first three cells occurring within 100 μm distance from each crack were counted around the entire crack perimeter to determine cell death. Cracks were not observed in control samples.
Figure 2.

Multiphoton microscopy images from a single-image plane within a z-stack, from both control and injured samples. Signal from the 380-490 nm channel (blue) and 510-650 nm channel (green) have been merged for clarity, resulting in collagen SHG and ECM autofluorescence appearing blue-green and fluorescein-stained cells appearing green. Control samples typically contained few fluorescein-stained cells and had regular SHG signal within the ECM. Injured samples typically contained more fluorescein-stained cells and irregular SHG signal, resulting from damaged matrix, such as cracks.
Images from two-filter channel emission data from sagittal plane scans of full-thickness cartilage explants were manually stitched together. Then, all cells were manually counted at 50 μm steps, with fluorescein stained (dead) cells being recorded to calculate death as a function of depth.
Statistical analysis
The calculated percent difference between the eigenvectors of the circular and elliptical death patterns were clustered into their respective groupings and compared using a Wilcoxon rank sum test. A non-parametric test was used because the difference is not normally distributed; median with range are reported. The percentage of chondrocyte death in the sagittal plane was evaluated at each 50 μm region using a two sample t-test, comparing control and injured samples. The same test was performed to compare chondrocyte death near cracks to controls. Statistical analyses were computed using Statistix 10.0 (Analytical Software, Tallahassee, FL) with p<0.05 considered significant.
RESULTS
Chondrocyte death identification from MPM data acquisition
MPM images provided high resolution detail of chondrocytes and the surrounding ECM. Each image collected was 328.7 × 438.3 μm in size. In separate studies, fluorescein was used with EthD-1 to verify that fluorescein can be used as an indicator of cell death. Cells were manually counted (n=9 sites, n=1 OCB), and fluorescein-staining correlated to EthD-1-staining with a linear relationship of slope 1.049 and squared correlation coefficient r2=0.929 (Figure 3).
Figure 3.
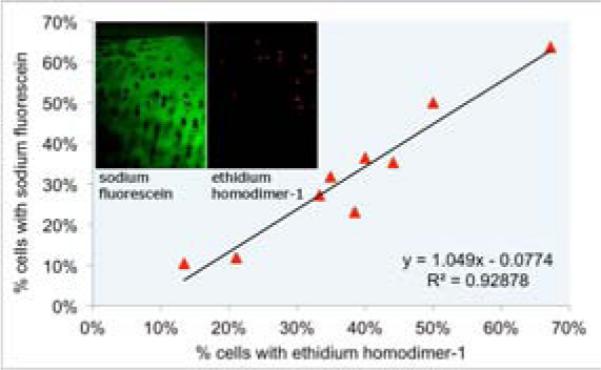
Sodium fluorescein and ethidium homodimer-1 validation. Cartilage was stained with both sodium fluorescein and ethidium homodimer-1 to determine the linear relationship between dyes to validate sodium fluorescein as a dead cell indicator. The linear relationship with a slope 1.049 and squared correlation coefficient r2=0.929 was determined.
Matrix-associated SHG signal allows for identification of chondrocyte lacunae as holes in the matrix. Control cartilage contained few chondrocytes with fluorescein staining. Images from the damaged regions contained more fluorescein-stained chondrocytes, autofluorescence, and irregular SHG signal, particularly near cracks (Figure 2). After injury, chondrocyte death was found to be significantly increased in the superficial 100 μm (Figure 4, p<0.05).
Figure 4.

Percentage of dead chondrocytes after injury, as a function of depth in 50 μm steps, as measured in the sagittal plane. The box represents the depth to which transverse MPM images were acquired for rasterized tile scanning, as described in the methods. The line demonstrates the mean depth to which samples were compressed. A total of n=13 OCBs from n=6 horses were analyzed for controls; a total of n=10 OCBs from n=6 horses were injured. Data is represented as the mean ± 95% confidence intervals. * represents a significant difference between control and injured (p<0.05) using a two-sample t-test.
Chondrocyte death spatial dispersion
The superficial 100 μm was evaluated in a medial-lateral (“x”) and anterior-posterior axis (“y”) coordinate system to understand the dispersion of cartilage death after traumatic injury in intact samples. A total of 420 control and 420 injured images for each sample were collected in the large field, and 300 control and 300 injured images for each sample in the small field. Centroids of dead cells were plotted in 3-D (Figure 5) and projected into 2-D (Figure 6) to determine the spatial pattern of damage. Dead cells were more numerous at the periphery of injury. The injury pattern was circular in some samples (n=7) and more elliptical (n=4) in others. Samples in which the difference between the two eigenvalues was less than 30% of the minor eigenvalue were considered to have a circular damage pattern (17.7%, range 5.6-23.8%), while those in which this difference was greater than 30% were considered to have an elliptical damage pattern (59.6%, range 39.0-162.9%). These values were statistically different from each other (p=0.006). The median peak load and peak displacement did not vary between groups with circular and elliptical damage patterns (Table 1).
Figure 5.

3-D reconstructions of control and injured cartilage. Each blue point represents a single dead chondrocyte in the control scanned site; each red point represents a single dead chondrocyte in the injured scanned site.
Figure 6.

2-D projections of control and injured cartilage. (a) A representative circular injury; (b) a representative elliptical injury. Each blue point represents a single dead chondrocyte in the control scanned site; each red point represents a single dead chondrocyte in the injured scanned site; the red lines represent the eigenvalues and eigenvectors; the transparent red shaded area denotes the area which corresponds with the eigenvectors.
Table 1.
Median peak load (with range), median peak displacement (with range), and median percent-difference between the long- and short-axis (with range). The difference of 30% was used to classify groups into “circular” (n=7) and “elliptical” (n=4) damage patterns.
| Load (N) | Displacement (μm) | Axes Difference (%) | |
|---|---|---|---|
| Circular | 117.74 (117.60-117.75) | 319 (226-605) | 17.7 (5.6-23.8) |
| Elliptical | 117.69 (117.67-117.74) | 373 (319-425) | 59.6 (39.0-162.9) |
Images were selected to evaluate local chondrocyte death within 100 μm of cracks, as identified by the absence of SHG signal (Figure 2). Cell death within 100 μm of cracks was significantly increased, with 73.7% (95% CI 64.0-83.4%, n=13 images from n=5 OCBs, p<0.0001) of cells being dead, compared to the corresponding control site images with cell death of 1.0% (95% CI 0-2.2%, n=13 images from n=5 OCBs).
DISCUSSION
This study used high resolution MPM imaging to determine the spatial distribution of chondrocyte death using a cartilage injury model. We demonstrated the feasibility of using MPM in live tissue, including collecting SHG signal and fluorescein emission, to detect subtle structural and cellular damage below the resolution of current clinical imaging techniques. With this technique, we were also able to identify two distributions of cell death that resulted from the same applied stress.
SHG and fluorescein were used to detect structural damage and cell death as shown in Figure 2. Chondrocyte lacunae can be easily identified, even in non-stained cartilage tissue, due to the absence of SHG signal within the lacunae. In other imaging techniques where the ECM is not easily identified, multiple dyes must be added to identify the matrix and live or dead cells, but these dyes cannot be used clinically. In this study, fluorescein was shown to strongly correlate with EthD-1. Because sodium fluorescein is FDA-approved and can detect damaged cells, it shows promise as a diagnostic method for in vivo microscopic imaging of damaged cartilage. Overall, we were able to use one dye with MPM imaging to quantify early damage following cartilage injury in live cartilage.
Matrix damage was also identified using MPM due to the irregularities in SHG. Using SHG, cracks as narrow as 2 μm were identified and associated with significant increase in chondrocyte death. This finding is similar to previous work examining chondrocyte death near large cracks and fissures 18 hours after injury.24 Although we did not quantify SHG emission, work by Brockbank et al showed that thermally-damaged cartilage has decreased SHG,25 suggesting that SHG may be an additional measurement for damaged matrix, likely due to decreased collagen organization. Collagen organization was not determined because type II fibrils are generally sub-resolution in all types of optical microscopy. Overall, we were able to observe maximal information about the cellular and structural qualities of cartilage, while using a minimally invasive technique and labeling strategy.
MPM has been used as a diagnostic tool in other fields,5,8,9 and this study demonstrated the feasibility of applying MPM and fluorescein to arthroscopic evaluation of cartilage in vivo. Endoscopic MPM has been demonstrated,9 providing feasibility for MPM as an arthroscopic tool. Fluorescein could be readily added to fluids used routinely during arthroscopy. Other techniques for detecting cartilage injury in live tissue, such as the work by Changoor et al. in examining electrochemical properties, are valuable but do not measure biological or cellular changes.26 Optical coherence tomography (OCT) and ultrasound imaging (UI) have also been used for high resolution evaluation of live cartilage. OCT resolution is approximately 10-30 μm,27-29 and UI is about 30-65 μm.30 While their x-y-resolution is not as high as MPM, OCT and UI have z-depth capabilities of 110 mm31 and 1.65 mm,32 respectively. These techniques, however, only offer structural information. If UI is hybridized with fluorescence decay spectroscopy, biochemical information can also be ascertained,30 albeit without the imaging resolution of MPM. Overall, the present study demonstrated the unique high resolution capabilities of MPM to detect cartilage damage in intact, live samples with the expectation of adaptation for in vivo arthroscopy.
Using MPM, we were able to identify the distribution of chondrocyte death after injury. We utilized 30 MPa, which based on previous ground force reaction studies in the equine forelimb, is about 2- to 3-fold physiologic loading.33 These higher stresses have been shown to cause increased cell death19 and was similarly found to cause an increase in cell death in this study. Many biochemical and biomechanical changes occur following traumatic injuries,2,34 including decreased chondrocyte viability and increased catabolic gene expression.14-16,35 While these studies suggest that key changes such as gene expression occur immediately after injury, the immediate consequences of a single traumatic load on cell death distribution are not known and were therefore examined in the present study. OCBs were injured to evaluate death distribution as a model of rapid change after cartilage injury. Samples were compressed, based on previous work,19 with a loading rate similar to that which has been shown to result in surface fissures and large distribution of cell death in bovine metcarpal cartilage, 4 days after injury.35 In this latter study, Ewers et al stated that their unpublished preliminary data suggested that the majority of cell death occurred within three hours following injury.35 We specifically focused on cell death within this first hour to evaluate the immediate effects of mechanical injury and not of later apoptosis. MPM images of the most superficial 100 μm were collected. While other studies have removed the superficial layer prior to compression,36 Chen et al found that bovine cartilage subjected to sustained continuous or cyclical loading up to 5 MPa primarily has decreased viability in the most superficial 70 μm.16 After MPM acquisition, all lacunae were identified within the images, with the location of each dead chondrocyte being reconstructed and mapped. Overall, we found numerous dead chondrocytes at the periphery of the injured site, with fewer dead cells at the center of the injured site. This was not surprising because tissue under the center of the flat-ended indenter experiences high compressive strain and hydrostatic pressure, while the tissue at the edges of the indenter experiences high shear strains. Based on previous studies estimating shear stresses that produce cracks in cartilage in impact loading and finite element studies of local shear stresses during indentation, local shear strains at the indenter edge were estimated to be 3.3-5.4 MPa.27,37,38 As in previous studies,39,40 cell death appears to be more prevalent in regions of tissue that experience high shear strain. Both with respect to x-y location, where cell death occurred preferentially near the edge of the indenter, and with respect to z-depth, where cell death occurred in regions within 200-400 μm from the surface, is the region known to experience highest shear strains. The dead-chondrocyte maps in the x-y plane were then analyzed using eigenvector analysis, and subsequently the axes of the spatial pattern to be calculated. This method was effective at revealing the patterns of cell death.
The observed injured samples were grouped into either circular (n=7) or elliptical (n=4) distribution patterns of chondrocyte death. All elliptical patterns were found in metatarsus samples; however, due to the small metacarpus sample size, statistical analysis between the hind and forelimbs was not performed. These different precipitating patterns of cell death have not been previously described. Although care was taken to injure the same location in each specimen, there could have been slight variability in injury location due to the necessity of applying the load to the sample surface perpendicularly, and, therefore, also variability in cartilage matrix organization including orientation of collagen. Ugryumova et al has shown that the transverse orientation of collage in the superficial zone has a distinct pattern but varies highly by location.18 This suggests that in the present study, differences in collagen orientation between injured sites within a sample may have occurred even if the injury sites were within millimeters of each other. To minimize this variation in collagen orientation, the medial condyle was consistently used as the injury site. While samples were not imaged prior to injury, the immediate surrounding regions near the injury site had a similar death staining pattern as the controls. Although only samples with an ICRS gross score of 0 or 1 were used, the background of the horses was unknown, which may introduce inter-animal variability. Collectively, these results suggest that the physiological consequences of trauma to the articular surface are site-dependent, which is important for understanding progression of PTOA between anatomic sites in patients.14,15
In summary, this study demonstrates the successful use of MPM imaging to detect cartilage damage in live tissue just one hour after injury. Cellular and structural changes that are below the resolution of other imaging techniques were readily identified with the fluorescein and MPM. Two unique injury patterns were observed suggesting that the cellular and structural consequences of injury are site-dependent or biologically variable. These findings may be significant for understanding, diagnosing and preventing PTOA development after injury. This study demonstrated the feasibility of high resolution MPM imaging of live, intact cartilage for application in vivo to further the understanding about the early pathogenesis of cartilage injury that may lead to PTOA.
ACKNOWLEDGEMENTS
The authors would like to thank Robert Bowles for his expertise in helping develop the traumatic injury model and Jesse Silverberg and Derin Sevenler for their assistance in MATLAB code writing.
FUNDING SOURCES
This investigation was supported by the Harry M. Zweig Foundation for Equine Research (LAF), grant TL1RR000459 of the Clinical and Translational Science Center at Weill Cornell Medical College (KDN), and grant P41-EB01976 (WRZ) from the National Institute of Biomedical Imaging and Bioengineering, National Institutes of Health.
Footnotes
Publisher's Disclaimer: This is a PDF file of an unedited manuscript that has been accepted for publication. As a service to our customers we are providing this early version of the manuscript. The manuscript will undergo copyediting, typesetting, and review of the resulting proof before it is published in its final citable form. Please note that during the production process errors may be discovered which could affect the content, and all legal disclaimers that apply to the journal pertain.
AUTHOR CONTRIBUTIONS
Corresponding author Lawrence Bonassar, Kira Novakofski, and Lisa Fortier designed the project. Rebecca Williams and Warren Zipfel contributed to the MPM imaging collection design. Kira Novakofski performed data collection and analysis and drafted the paper; all other authors reviewed the paper for important intellectual content. Hussni Mohammed contributed to the statistical design. All authors approved the final submitted version.
REFERENCES
- 1.Woolf AD, Pfleger B. Burden of major musculoskeletal conditions. Bull.World Health Organ. 2003;81:646–56. [PMC free article] [PubMed] [Google Scholar]
- 2.Natoli RM, Scott CC, Athanasiou KA. Temporal effects of impact on articular cartilage cell death, gene expression, matrix biochemistry, and biomechanics. Ann.Biomed.Eng. 2008;36:780–92. doi: 10.1007/s10439-008-9472-5. [DOI] [PubMed] [Google Scholar]
- 3.Borrelli J, Jr, Silva MJ, Zaegel MA, Franz C, Sandell LJ. Single high energy impact load causes posttraumatic OA in young rabbits via a decrease in cellular metabolism. 2009;27:347–52. doi: 10.1002/jor.20760. [DOI] [PubMed] [Google Scholar]
- 4.Zipfel WR, Williams RM, Christie R, Nikitin AY, Hyman BT, Webb WW. Live tissue intrinsic emission microscopy using multiphoton-excited native fluorescence and second harmonic generation. Proc.Natl.Acad.Sci.U.S.A. 2003;100:7075. doi: 10.1073/pnas.0832308100. [DOI] [PMC free article] [PubMed] [Google Scholar]
- 5.Da Costa V, Wei R, Lim R, Sun CH, Brown JJ, Wong BJF. Nondestructive imaging of live human keloid and facial tissue using multiphoton microscopy. 2008;10:38. doi: 10.1001/archfacial.2007.18. [DOI] [PMC free article] [PubMed] [Google Scholar]
- 6.Pavlova I, Hume KR, Yazinski SA, Peters RM, Weiss RS, Webb WW. Multiphoton microscopy as a diagnostic imaging modality for lung cancer. 2010;7569:756918. doi: 10.1117/12.841017. [DOI] [PMC free article] [PubMed] [Google Scholar]
- 7.Wang CC, Li FC, Wu RJ, Hovhannisyan VA, Lin WC, Lin SJ, et al. Differentiation of normal and cancerous lung tissues by multiphoton imaging. J.Biomed.Opt. 2009;14:044034. doi: 10.1117/1.3210768. [DOI] [PubMed] [Google Scholar]
- 8.Skala MC, Squirrell JM, Vrotsos KM, Eickhoff JC, Gendron-Fitzpatrick A, Eliceiri KW, et al. Multiphoton microscopy of endogenous fluorescence differentiates normal, precancerous, and cancerous squamous epithelial tissues. Cancer Res. 2005;65:1180. doi: 10.1158/0008-5472.CAN-04-3031. [DOI] [PMC free article] [PubMed] [Google Scholar]
- 9.Rivera DR, Brown CM, Ouzounov DG, Pavlova I, Kobat D, Webb WW, et al. Compact and flexible raster scanning multiphoton endoscope capable of imaging unstained tissue. 2011;108:17598–603. doi: 10.1073/pnas.1114746108. [DOI] [PMC free article] [PubMed] [Google Scholar]
- 10.Yeh AT, Hammer-Wilson MJ, Van Sickle DC, Benton HP, Zoumi A, Tromberg BJ, et al. Nonlinear optical microscopy of articular cartilage. 2005;13:345–52. doi: 10.1016/j.joca.2004.12.007. [DOI] [PubMed] [Google Scholar]
- 11.Mokhtarzadeh M, Casey R, Glasgow BJ. Fluorescein punctate staining traced to superficial corneal epithelial cells by impression cytology and confocal microscopy. Invest.Ophthalmol.Vis.Sci. 2011;52:2127–35. doi: 10.1167/iovs.10-6489. [DOI] [PMC free article] [PubMed] [Google Scholar]
- 12.Andersson LO, Rehnström A, Eaker DL. Studies on “Nonspecific” Binding. 1971;20:371–80. doi: 10.1111/j.1432-1033.1971.tb01403.x. [DOI] [PubMed] [Google Scholar]
- 13.Anderson DD, Chubinskaya S, Guilak F, Martin JA, Oegema TR, Olson SA, et al. Post traumatic osteoarthritis: Improved understanding and opportunities for early intervention. 2011;29:802–9. doi: 10.1002/jor.21359. [DOI] [PMC free article] [PubMed] [Google Scholar]
- 14.Backus JD, Furman BD, Swimmer T, Kent CL, McNulty AL, DeFrate LE, et al. Cartilage viability and catabolism in the intact porcine knee following transarticular impact loading with and without articular fracture. 2011;29:501–10. doi: 10.1002/jor.21270. [DOI] [PMC free article] [PubMed] [Google Scholar]
- 15.Sauter E, Buckwalter JA, McKinley TO, Martin JA. Cytoskeletal dissolution blocks oxidant release and cell death in injured cartilage. 2012 doi: 10.1002/jor.21552. [DOI] [PMC free article] [PubMed] [Google Scholar]
- 16.Chen CT, Bhargava M, Lin PM, Torzilli PA. Time, stress, and location dependent chondrocyte death and collagen damage in cyclically loaded articular cartilage. 2003;21:888–98. doi: 10.1016/S0736-0266(03)00050-0. [DOI] [PubMed] [Google Scholar]
- 17.Buckley MR, Gleghorn JP, Bonassar LJ, Cohen I. Mapping the depth dependence of shear properties in articular cartilage. J.Biomech. 2008;41:2430–7. doi: 10.1016/j.jbiomech.2008.05.021. [DOI] [PubMed] [Google Scholar]
- 18.Ugryumova N, Jacobs J, Bonesi M, Matcher SJ. Novel optical imaging technique to determine the 3-D orientation of collagen fibers in cartilage: variable-incidence angle polarization-sensitive optical coherence tomography. 2009;17:33–42. doi: 10.1016/j.joca.2008.05.005. [DOI] [PubMed] [Google Scholar]
- 19.Milentijevic D, Rubel IF, Liew ASL, Helfet DL, Torzilli PA. An in vivo rabbit model for cartilage trauma: a preliminary study of the influence of impact stress magnitude on chondrocyte death and matrix damage. J.Orthop.Trauma. 2005;19:466. doi: 10.1097/01.bot.0000162768.83772.18. [DOI] [PubMed] [Google Scholar]
- 20.Bulkley GB, Zuidema GD, Hamilton SR, O'Mara CS, Klacsmann PG, Horn SD. Intraoperative determination of small intestinal viability following ischemic injury: a prospective, controlled trial of two adjuvant methods (Doppler and fluorescein) compared with standard clinical judgment. Ann.Surg. 1981;193:628. doi: 10.1097/00000658-198105000-00014. [DOI] [PMC free article] [PubMed] [Google Scholar]
- 21.Carter MS, Fantinl GA, Sammartano RJ, Mttsudo S, Silverman DG, Boley SJ. Qualitative and quantitative fluorescein fluorescence in determining intestinal viability. 1984;147:117–23. doi: 10.1016/0002-9610(84)90044-8. [DOI] [PubMed] [Google Scholar]
- 22.Williams RM, Zipfel WR, Tinsley ML, Farnum CE. Solute transport in growth plate cartilage: in vitro and in vivo. Biophys.J. 2007;93:1039–50. doi: 10.1529/biophysj.106.097675. [DOI] [PMC free article] [PubMed] [Google Scholar]
- 23.Ugryumova N, Attenburrow DP, Winlove CP, Matcher SJ. The collagen structure of equine articular cartilage, characterized using polarization-sensitive optical coherence tomography. J.Phys.D. 2005;38:2612. [Google Scholar]
- 24.Lewis JL, Deloria LB, Oyen - Tiesma M, Thompson RC, Jr, Ericson M, Oegema TR., Jr Cell death after cartilage impact occurs around matrix cracks. 2003;21:881–7. doi: 10.1016/S0736-0266(03)00039-1. [DOI] [PubMed] [Google Scholar]
- 25.Brockbank KGM, MacLellan WR, Xie J, Hamm-Alvarez SF, Chen ZZ, Schenke-Layland K. Quantitative second harmonic generation imaging of cartilage damage. Cell Tissue Banking. 2008;9:299–307. doi: 10.1007/s10561-008-9070-7. [DOI] [PubMed] [Google Scholar]
- 26.Changoor A, Coutu JP, Garon M, Quenneville E, Hurtig MB, Buschmann MD. Streaming Potential-based Arthroscopic Device is Sensitive to Cartilage Changes Immediately Post-impact in an Equine Cartilage Injury Model. J.Biomech.Eng. 2011;133:278. doi: 10.1115/1.4004230. [DOI] [PubMed] [Google Scholar]
- 27.Wilson W, van Burken C, van Donkelaar C, Buma P, van Rietbergen B, Huiskes R. Causes of mechanically induced collagen damage in articular cartilage. 2006;24:220–8. doi: 10.1002/jor.20027. [DOI] [PubMed] [Google Scholar]
- 28.Pan Y, Li Z, Xie T, Chu CR. Hand-held arthroscopic optical coherence tomography for in vivo high-resolution imaging of articular cartilage. J.Biomed.Opt. 2003;8:648–54. doi: 10.1117/1.1609201. [DOI] [PubMed] [Google Scholar]
- 29.Li X, Martin S, Pitris C, Ghanta R, Stamper DL, Harman M, et al. High-resolution optical coherence tomographic imaging of osteoarthritic cartilage during open knee surgery. 2005;7:R318. doi: 10.1186/ar1491. [DOI] [PMC free article] [PubMed] [Google Scholar]
- 30.Sun Y, Responte D, Xie H, Liu J, Fatakdawala H, Hu J, et al. Nondestructive evaluation of tissue engineered articular cartilage using time-resolved fluorescence spectroscopy and ultrasound backscatter microscopy. 2012;18:215–26. doi: 10.1089/ten.tec.2011.0343. [DOI] [PMC free article] [PubMed] [Google Scholar]
- 31.Chu CR, Lin D, Geisler JL, Chu CT, Fu FH, Pan Y. Arthroscopic microscopy of articular cartilage using optical coherence tomography. Am.J.Sports Med. 2004;32:699–709. doi: 10.1177/0363546503261736. [DOI] [PubMed] [Google Scholar]
- 32.Kaleva E, Virén T, Saarakkala S, Sahlman J, Sirola J, Puhakka J, et al. Arthroscopic Ultrasound Assessment of Articular Cartilage in the Human Knee Joint A Potential Diagnostic Method. 2011;2:246–53. doi: 10.1177/1947603510391781. [DOI] [PMC free article] [PubMed] [Google Scholar]
- 33.Witte T, Knill K, Wilson A. Determination of peak vertical ground reaction force from duty factor in the horse (Equus caballus). J.Exp.Biol. 2004;207:3639–48. doi: 10.1242/jeb.01182. [DOI] [PubMed] [Google Scholar]
- 34.Kurz B, Jin M, Patwari P, Cheng DM, Lark MW, Grodzinsky AJ. Biosynthetic response and mechanical properties of articular cartilage after injurious compression. 2001;19:1140–6. doi: 10.1016/S0736-0266(01)00033-X. [DOI] [PubMed] [Google Scholar]
- 35.Ewers B, Dvoracek-Driksna D, Orth M, Haut R. The extent of matrix damage and chondrocyte death in mechanically traumatized articular cartilage explants depends on rate of loading. 2001;19:779–84. doi: 10.1016/S0736-0266(01)00006-7. [DOI] [PubMed] [Google Scholar]
- 36.Loening AM, James IE, Levenston ME, Badger AM, Frank EH, Kurz B, et al. Injurious mechanical compression of bovine articular cartilage induces chondrocyte apoptosis. Arch.Biochem.Biophys. 2000;381:205–12. doi: 10.1006/abbi.2000.1988. [DOI] [PubMed] [Google Scholar]
- 37.Saxena R, Sahay K, Guha S. Shear properties of articular cartilage of a bovine knee joint subjected to moderate and high loads: an experimental study. Proc.Inst.Mech.Eng.Part H J.Eng.Med. 1991;205:89–93. doi: 10.1243/PIME_PROC_1991_205_273_02. [DOI] [PubMed] [Google Scholar]
- 38.Atkinson T, Haut R, Altiero N. Impact-induced fissuring of articular cartilage: an investigation of failure criteria. J.Biomech.Eng. 1998;120:181–7. doi: 10.1115/1.2798300. [DOI] [PubMed] [Google Scholar]
- 39.Buckwalter JA, Brown TD. Joint injury, repair, and remodeling: roles in post-traumatic osteoarthritis. Clin.Orthop. 2004;423:7. [PubMed] [Google Scholar]
- 40.Martin J, Buckwalter J. Post-traumatic osteoarthritis: the role of stress induced chondrocyte damage. Biorheology. 2006;43:517–21. [PubMed] [Google Scholar]