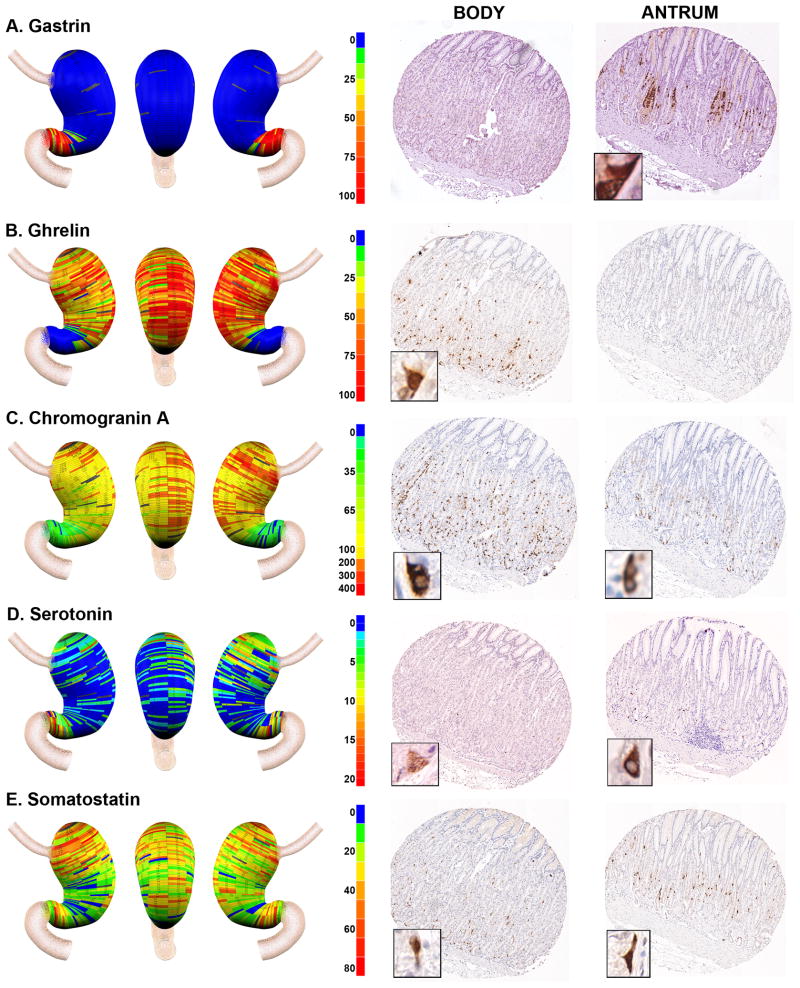
Figure 2. Geographic mapping of endocrine cell lineages.
Tissue array sections from Donor 2 were stained for A. Gastrin (G cells), B. Ghrelin (X cells), C. Chromogranin A (enteroendocrine cells), D. Serotonin (EC cells) and E. Somatostatin (D cells). Quantitated cell lineage numbers per core were mapped onto three dimensional stomach maps to demonstrate the distribution of cells in the stomach (left panels). The scale bars represent the range of positive cells in a core. Representative cores from the body and antrum are shown at the right of each panel with high magnification insets showing the individual cell staining pattern.

