

Background: Protein oligomers are implicated as cytotoxic membrane-disrupting agents in neurodegenerative diseases.
Results: The small molecule EGCG, which inhibits α-synuclein oligomer toxicity, moderately reduces membrane binding and immobilizing the oligomer C-terminal tail.
Conclusion: The α-synuclein oligomer may disrupt membranes by vesicle destabilization rather than pore formation.
Significance: Limited reduction of oligomer membrane affinity may be sufficient to prevent cytotoxicity.
Keywords: α-Synuclein, Dynamic Light Scattering, Isothermal Titration Calorimetry (ITC), Membrane, Nuclear Magnetic Resonance (NMR), X-ray Scattering, EGCG, Oligomer, Toxicity
Abstract
Oligomeric species of various proteins are linked to the pathogenesis of different neurodegenerative disorders. Consequently, there is intense focus on the discovery of novel inhibitors, e.g. small molecules and antibodies, to inhibit the formation and block the toxicity of oligomers. In Parkinson disease, the protein α-synuclein (αSN) forms cytotoxic oligomers. The flavonoid epigallocatechin gallate (EGCG) has previously been shown to redirect the aggregation of αSN monomers and remodel αSN amyloid fibrils into disordered oligomers. Here, we dissect EGCG's mechanism of action. EGCG inhibits the ability of preformed oligomers to permeabilize vesicles and induce cytotoxicity in a rat brain cell line. However, EGCG does not affect oligomer size distribution or secondary structure. Rather, EGCG immobilizes the C-terminal region and moderately reduces the degree of binding of oligomers to membranes. We interpret our data to mean that the oligomer acts by destabilizing the membrane rather than by direct pore formation. This suggests that reduction (but not complete abolition) of the membrane affinity of the oligomer is sufficient to prevent cytotoxicity.
Introduction
The intrinsically disordered protein α-synuclein (αSN)7 has been linked to Parkinson disease (PD) since 1997. The focus on αSN stems from the accumulation of αSN in intracellular amyloid-rich Lewy bodies (1, 2), which accumulate in the brain of PD patients. Also, certain mutations in the αSN gene are linked with familial PD (3); several of these mutations increase the propensity of the αSN monomer to form amyloid material in vitro (4, 5). Recently, we have come to view soluble non- or prefibrillar oligomers as the toxic species that lead to neuronal damage in PD (6, 7). This is further supported by reports on elevated concentrations of αSN oligomers in post-mortem brain extracts from patients with Lewy body dementia (8) and in cerebral spinal fluid from patients with PD (9).
A current challenge in the field of protein misfolding and neurodegeneration is to understand the molecular mechanism behind oligomer toxicity. One of the most widespread hypotheses is that oligomers can interact with and perturb membranes, thereby leading to cell death (6, 7, 10–12).
There is enormous interest in finding molecules that inhibit the formation of αSN oligomers with the ultimate aim of developing drugs toward PD. Given that these molecules should be able to cross the blood-brain barrier, the focus has been on small molecules. One remarkably potent and well studied small molecule is epigallocatechin gallate (EGCG). EGCG is reported to reduce toxicity in two ways. The first is by redirecting the aggregation pathway of monomeric αSN into unstructured nontoxic oligomers (13), similar to the two structurally related compounds baicalein (14) and dopamine (15). The second is by reducing the toxicity of αSN fibrils by remodeling them into nontoxic aggregates (16). EGCG is a strong antioxidant found in green tea and appears to counteract several diseases, including cancer (17). EGCG's benzene rings with vicinal dihydroxy groups (Fig. 1A) are also found in numerous other fibril inhibitors (14, 15, 18–20). EGCG is not specific toward αSN and has been shown to inhibit the fibrillation of numerous proteins (21–27). At equimolar concentrations, EGCG preferentially binds the C terminus of αSN (Asp-119, Ser-129, Glu-130, and Asp-135) (13). Similarly, dopamine predominantly targets the 125YEMPS129 region (28, 29). At higher EGCG/αSN molar ratios, EGCG binds nonspecifically throughout the whole amino acid sequence (13).
FIGURE 1.

EGCG inhibits oligomer toxicity. A, inhibition of the ability of oligomers to permeabilize membranes at 0.2 μm oligomer (monomer equivalents) as measured with the calcein release assay. Inset, structure of EGCG. B, EGCG inhibits oligomer cytotoxicity. OLN-93 cells were exposed to 5 μm αSN oligomer or monomer and 0–5 μm EGCG for 24 h. Cell viability was measured with the MTT assay and trypan nuclei staining. Both assays are given as triplicates with standard deviation. The curves on A and B are fitted to a simple binding isotherm.
Drugs that directly target and stabilize the αSN monomer, thereby keeping it in a soluble conformation, may compromise the (as yet unknown) physiological role of αSN. Instead of preventing oligomer formation, we here focus on inhibiting the toxicity of preformed toxic oligomers formed during the fibrillation process (30). These oligomers have not been chemically modified and on average consist of ∼30 monomers (31, 32), forming a rather compact β-sheet core with a disordered outer shell. αSN oligomers interact with and perturb membranes by a combination of electrostatic interactions between the N terminus of αSN and lipid head groups combined with hydrophobic interactions (33–38).
Here, we use in vitro assays to analyze how EGCG reduces the oligomer toxicity of αSN. EGCG potently inhibits the ability of αSN oligomers to permeabilize membranes, as probed by a calcein release assay and fluorescence confocal microscopy. The inhibition of oligomer activity is confirmed by EGCG's ability to rescue rat neuronal cells from oligomer toxicity. Gratifyingly, inhibition occurs at similar EGCG concentrations in the membrane permeabilization assay and the extracellular toxicity assay. Liquid-state NMR spectroscopy shows that the N terminus and the NAC region build up the oligomer core, whereas the C terminus remains disordered in the oligomer state. We show that the flexibility of the C terminus decreases upon EGCG binding. Importantly, EGCG binds to the oligomers without changing either oligomer secondary structure or its size distribution. Thus, inhibition of membrane permeabilization and extracellular toxicity is not due to dissociation or aggregation of the oligomers. Rather, asymmetrical flow field-flow fractionation (AF4) and calorimetric analysis show that EGCG inhibits the toxicity of αSN oligomers by decreasing their interaction with membranes, thus highlighting reduction of oligomer-membrane interactions as a viable therapeutic approach against Parkinson disease.
EXPERIMENTAL PROCEDURES
αSN Production and Handling
αSN was produced and purified according to Ref. 34. 15N-Labeled αSN was produced and purified in the same way, with the exception that Escherichia coli was grown in M9 minimal media with 15NH4Cl as the only nitrogen source. A 100-ml preculture was inoculated with a transformed colony and grown overnight at 37 °C. The preculture was subsequently split into growth media and incubated at 37 °C until an A600 ∼0.6 was reached. Protein expression was induced by addition of isopropyl 1-thio-β-d-galactopyranoside to a final concentration of 0.1 mm followed by a 4-h incubation prior to harvest. Freshly dissolved αSN was filtered (0.2 μm) prior to use, and protein concentration was determined by absorption measurements with a NanoDrop UV-visible spectrophotometer (ND-1000, Thermo Scientific) using a theoretical extinction coefficient of 0.412 (mg/ml)−1 cm−1 for 280 nm. All experiments were carried out in phosphate-buffered saline (PBS) (20 mm phosphate, 150 mm NaCl (pH 7.4)).
Oligomer Production
Monomeric αSN was incubated at 840 μm in PBS buffer for 5 h at 37 °C and 900 rpm shaking in a Biosan TS-100 Thermo shaker. Soluble material was separated from insoluble material by centrifugation at 13,400 rpm at room temperature and loaded on an ∼24-ml Superose 6 10/30 GL SEC column at 0.5 ml/min in PBS buffer. Small oligomers were separated from larger aggregates and monomers. The concentration of oligomers was estimated the same way as described above for monomers. When necessary, oligomers were concentrated using 0.5- and 15-ml Amicon ultracentrifugal filters (Merck).
Preparation of Large Unilamellar Vesicles (LUVs)
LUVs of pure 1,2-dimyristoyl-sn-3-phosphatidylglycerol (DMPG) or 1,2-dioleoyl-sn-3-phosphatidylglycerol (DOPG) were dissolved at 5 mg/ml in PBS. The samples were subjected to 10 freeze-thaw cycles between liquid N2 and a 50 °C water bath, followed by 21 extrusions to a diameter of 100 or 200 nm. During extrusion of DMPG vesicles, the extruder was kept at 50 °C to keep the lipid in the liquid-disordered phase. DOPG vesicles for calcein release were prepared in the presence of 70 mm calcein. After extrusion, vesicles were separated from free calcein with a PD-10 desalting column (GE Healthcare).
Calcein Release Assay
The fluorophore calcein was entrapped at self-quenching concentrations (70 mm) inside DOPG vesicles. Upon membrane permeabilization, calcein was released from the vesicles and diluted, leading to a fluorescence increase. Oligomers were mixed with varying concentrations of EGCG and 1% DMSO and loaded in triplicate in a 148-μl assay solution onto a 96-well plate (Nunc, Thermo Fisher Scientific, Roskilde, Denmark). The plates were sealed with crystal clear sealing tape (Hampton Research, Aliso Viejo, CA) and incubated in a Genios Pro fluorescence plate reader (Tecan, Mänerdorf, Switzerland) for 1 h at 37 °C and a 2-s autoshake. Subsequently, DOPG vesicles with calcein were added to a final lipid concentration of ∼42 μm and a final volume of 150 μl of assay solution. Calcein release was monitored with excitation at 485 nm and emission at 520 nm for at least 1 h under the same conditions used for incubation. Titration of EGCG to vesicles did not lead to any changes in fluorescence signal nor did EGCG affect the fluorescence signal of free calcein, ruling out artifacts from fluorescence quenching (data not shown).
Cell Line and Culture Conditions
The cell line used was OLN-93, an immortalized oligodendroglial cell line derived from primary Wistar rat brain glial cultures (39). Cells were kept at 37 °C under 5% CO2 and grown in Dulbecco's modified Eagle's medium (Lonza) supplemented with 10% fetal calf serum, 50 units/ml penicillin, and 50 μg/ml streptomycin.
Measurement of Cell Viability by MTT Assay and Trypan Staining
Briefly, 5000 cells/well were seeded into poly-l-lysine-coated 96-well plates with growth medium and allowed to attach for 24 h. αSN monomer or oligomer was added (final concentration 5 μm) to the cells with or without various concentrations of EGCG or αSN-specific antibody (ASY-1) and incubated for an additional 24 h. Cells were washed in RPMI 1640 medium (Sigma, R7509), after which 50 μl of MTT (5 mg/ml in RPMI medium) was added. After 3 h, cells and the formed formazan crystals were dissolved in lysis buffer (1% Triton X-100, 40 mm HCl diluted in isopropyl alcohol) and incubated on a shaker overnight shielded from light. The absorbance at 570 nm was measured, and background (650 nm) was subtracted in a VersaMax microplate reader (Molecular Devices). 5000 cells/well were seeded into poly-l-lysine-coated 96-well plates with growth medium and allowed to attach for 24 h. αSN monomer or oligomer was added (final concentration 5 μm) to the cells with or without various concentrations of EGCG or αSN-specific antibody (ASY-1) and incubated for additional 24 h. Cells were washed in RPMI 1640 medium (Sigma, R7509), and 0.02% trypan blue in RPMI 1640 medium was subsequently added. Cells were visualized on an Olympus inverted microscope CKX41 connected to a camera, ×100 magnifications, and cell fractions with blue-stained nuclei were quantified.
Preparation of Giant Unilamellar Vesicles (GUVs)
GUVs were prepared by the electroformation method originally described by Angelova and Dimitrov (40). The GUVs were made using a home-built electroformation chamber partly built on the specifications published by Bagatolli and Gratton (41). GUVs were prepared from chloroform stocks containing 10 g/liter. The chloroform lipid stocks were spread on platinum electrodes with ∼10 μl on each, and the solvent was allowed to evaporate. The chamber was filled with a solution of 200 mm sucrose containing Alexa 488. The platinum wires were connected to a function generator (Digimess FG 100, Grundig Instruments, Nürnberg, Germany), and a low frequency alternating field sinusoidal function with a frequency of 10 Hz and amplitude of 1.5 V was applied for 90 min followed by 30 min at 1 Hz and amplitude of 3 V. To remove free fluorophore, the GUVs were run over a PD10 column pre-equilibrated with 200 mm glucose. The eluent from the column was collected and transferred to an eight-well microscopy chamber (Lab-Tek Brand Products, Naperville, IL). GUVs were left overnight at 4 °C to allow them to sediment at the bottom of the viewing chamber prior to analysis.
Fluorescence Labeling of αSN Oligomers
A single cysteine mutant of αSN (A140C) was produced and purified as described above. Labeling with Alexa 633 maleimide was carried out according to the procedures provided by the manufacturer (Invitrogen). Alexa-labeled αSNs were mixed with unlabeled monomer at a ratio of 1:10, and oligomers were produced as described above.
Laser Scanning Confocal Microscopy Measurements
GUVs were equilibrated to room temperature in the microscopy wells for 15–20 min before measuring. 5 μl of Alexa 633-labeled αSN oligomer solution was injected into the microscope, and images were recorded every 6 s. GUVs were analyzed with an LSM 510 scanning confocal microscope (Zeiss GmbH, Jena, Germany). Excitation of Alexa 488 and 633 was done at 488 and 588 nm, and fluorescence emission was measured over 505–548 and 612–750 nm for Alexa 488 and 633, respectively.
NMR Spectroscopy
The NMR samples contained 200 μm protein in (monomer equivalents) PBS buffer, with about 6% (v/v) D2O and 0.1 mm sodium 4,4-dimethyl-4-silapentane-1-sulfonate as an internal chemical shift reference. 1H-15N heteronuclear single-quantum coherence (HSQC) spectra were recorded on a Bruker Avance NMR spectrometer at 500 MHz 1H frequency at 1 °C. The spectra were processed using NMRPipe and analyzed with Sparky (42, 51). Spectral assignment was taken from BMRB entry ID 18857.
Transmission Electron Microscopy (TEM)
5-μl aliquots of 28 μm oligomer (monomer equivalents) with varying molar ratios of EGCG (1:0, 1:1, and 1:5 (αSN/EGCG)) in PBS buffer were transferred to 400-mesh carbon-coated, glow-discharged grids for 30 s. The grids were washed using 2 drops of doubly distilled water, stained with 1% phosphotungstic acid (pH 6.8), and blotted dry on filter paper. The samples were viewed in a microscope (JEM-1010; JEOL, Tokyo, Japan) operating at 60 kV. Images were obtained using an Olympus KeenViewG2 camera.
Far-UV Circular Dichroism (CD)
Far-UV CD spectra were recorded on a Jasco J-810 spectropolarimeter (Jasco Spectroscopic Co. Ltd.). Ellipticity was measured at 25 °C, and five accumulations were averaged to yield the final spectrum. A 1.0-mm path length cuvette was used for 14 μm oligomer (monomer equivalents). The contribution from PBS buffer was subtracted, and the CD signal given as mean residue ellipticity expressed as degrees cm2 dmol−1.
Dynamic Light Scattering (DLS)
A ZS Zetasizer Nano ZS (Malvern Instruments) was used to measure the hydrodynamic radius (Rh) of oligomer and vesicles at 25 °C. 21 μm oligomer (monomer equivalent) and 1.26 mm DOPG vesicles (molar ratio 1:60) were prepared with 100 nm diameter as described above. All samples were measured three to five times using 15–40 accumulated scans. We have given the Z-average with standard deviation of the accumulation scans.
Small Angle X-ray Scattering (SAXS)
Data were recorded on an in-house instrument at Aarhus University (43). The acquisition time was 1 h for the samples and buffer solution. The concentration of the oligomer sample without EGCG was 127 μm, and 105 μm (monomer equivalents) was used in the sample with EGCG (1:1 molar ratio). Background subtraction and conversion to absolute scale was performed with home-written software.8 The data are expressed as the intensity versus the modulus of the scattering vector shown in Equation 1,
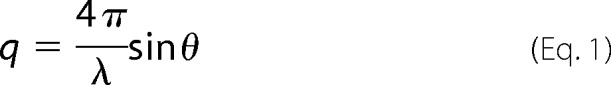 |
where λ is the x-ray wavelength (1.54 Å) and 2θ is the scattering angle.
For dilute solutions with no interactions between the individual particles, the scattering can be expressed as I(q) = nV2Δρ2P(q). Here, n is the particle number density; V is the volume of the particle, and Δρ is the difference in scattering length density of the particle and solvent. P(q) is the particle form factor that depends on its shape and is normalized to 1 at P(q = 0). Therefore, knowing the concentration and the scattering length density of a protein, the forward scattering can be used to estimate the molecular weight of the particles in the solution and thereby the oligomer aggregation number.
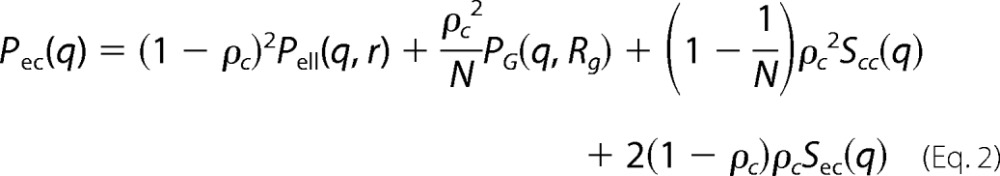
In this study, we have used form factor developed and described in detail earlier (32), based on the work of Pedersen and Gerstenberg (44). In short, the particles are described as a compact ellipsoid of revolution with flexible protein chains on the surface, giving the expression shown in Equation 2,
 |
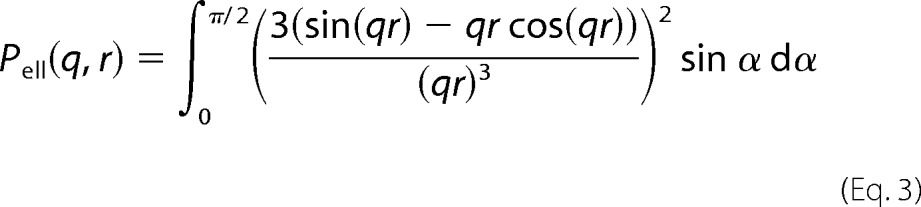
This expression includes the form factor of the ellipsoidal core (45), shown in Equation 3,
 |
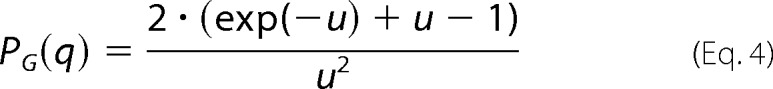
the form factor of a random coil (46), shown in Equation 4,
 |
the cross-correlation between the core and the chains, shown in Equation 5,
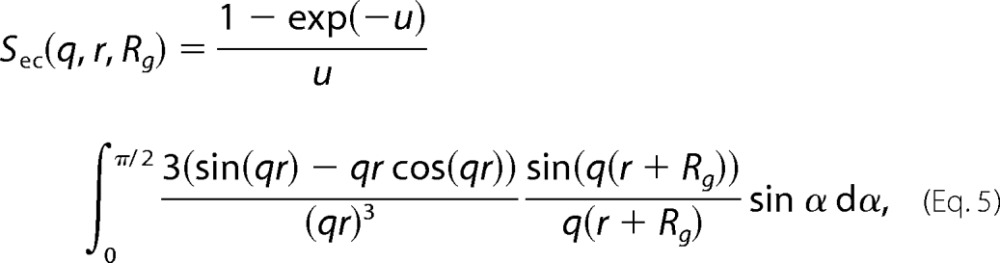 |
and the cross-correlation between different chains, shown in Equation 6.
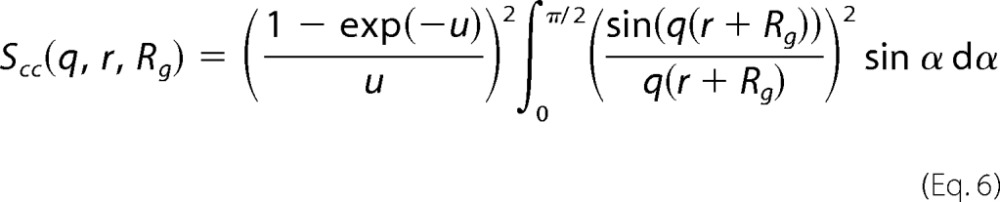 |
In the above equations, r = R(sin2α + ϵ2cos2 α)1/2, where R is the short radius of the core; ϵ is the aspect ratio of the short and long radii; N is the number of random coils on the ellipsoid surface; u = 〈Rg2〉q2, Rg is the random coil radius of gyration, and ρc is the fraction of the protein that is situated in the random coil configuration. The centers of mass of the random coils are placed at a distance of Rg from the surface of the core.
SEC and Asymmetrical Flow Field-flow Fractionation (AF4)
SEC and AF4 was carried out using a Postnova AF2000 field-flow fractionation system (Postnova Analytics GmbH, Germany) operating in SEC or AF4 mode and equipped with UV-visible (S3240) detector (A214 nm) and a PN3140 refractive index detector (listed in flow order).
Analysis of αSN oligomer samples and the effect of EGCG were done in SEC mode using a Superose 6 10/300 GL SEC column with PBS as the mobile phase. 100 μl of the 0.5 mg/ml sample mixed with or without equimolar amounts of EGCG was incubated for 1 h at 37 °C prior to injection and separation at a flow rate of 0.75 ml/min. Eluting species was detected by the RI detector.
Analysis of the interaction of αSN oligomers with 100 nm diameter DOPG vesicles was carried out in AF4 mode using a 10-kDa membrane (regenerated cellulose), and a flow program similar to that in Ref. 34 was used to allow separation of monomers, oligomers, and vesicles within the same run. αSN and vesicles were mixed at a molar ratio of 1:100 (21 μm αSN and 2.1 mm DOPG) and incubated for 1 h at 37 °C prior to injection. The sample was focused for 7 min with an injection tip flow of 0.2 ml/min and a cross-flow (CF) of 2 ml/min followed by isocratic elution at 2 ml/min CF for 10 min during which αSN monomers elute from the channel. A linear CF gradient from 2 to 0.35 ml/min over 25 min was then applied to elute oligomers followed by a linear CF gradient to 0 ml/min over 25 min where the vesicles eluted. Finally, the channel was flushed at 0 ml/min CF for 5 min (no separation force) and further purged for 5 min at 2 ml/min focus and tip flows. A constant detector flow of 0.5 ml/min was maintained throughout the separation. A relative calibration was achieved by injection of 100 μl of 1–2 mg/ml ribonuclease A (13.7 kDa), ovalbumin (45 kDa), BSA (66 kDa), and thyroglobulin (669 kDa).
Differential Scanning Calorimetry (DSC)
DSC experiments were carried out on a VP-DSC Microcalorimeter (MicroCal, Inc.), with a cell volume of 0.5 ml. The sample cell was carefully cleaned, emptied, reloaded with sample, and equilibrated for 30 min at the scan starting temperature of 10 °C. Thermograms were recorded with a scan rate of 60 °C/h. Initially, three consecutive background scans on PBS buffer were conducted. Hereafter, 1.45 mm (1 mg/ml) DMPG vesicles with a diameter of 200 nm was analyzed alone and in the presence of 70 μm EGCG (i.e. molar ratio 1:20.8 (EGCG/lipid)), 35 μm monomer, or oligomer that had been preincubated with or without 70 μm EGCG. All samples were preincubated at 37 °C for 1 h prior to the experiment.
Isothermal Titration Calorimetry (ITC)
ITC analysis was carried out with a MicroCal VP-ITC system. The cell was equilibrated at 37 °C and filled with 1.25 mm DOPG vesicles extruded to a diameter of 100 nm. The αSN monomer or oligomer with or without EGCG was incubated for 1 h at 37 °C prior to titration in the calorimeter. Monomers or oligomers were titrated at a concentration of 17.5 μm (monomer equivalents) ± 35 μm EGCG (molar ratio 1:2). In total, 30 injections of 4 μl, each with a duration of 8 s, were carried out with a spacing time of 300 s. The cell was continuously stirred at 307 rpm; the reference power was set to 15 μcal/s, and the initial delay was 1800 s. For relevant control titrations, the protein titrated to buffer and buffer titrated to lipid gave a small and constant signal over the 30 injections. These contributions were averaged over the 30 injections and subtracted from the spectra. When EGCG was present in the titrant, the control EGCG titrated to lipid was also subtracted. Buffer titrated to buffer did not give a signal and has not been included in the subtraction of control titrations.
RESULTS
Production of αSN Oligomers
We produced αSN oligomers by incubating monomeric αSN at high concentrations in PBS buffer (pH 7.4) at 37 °C under shaking for several hours in the absence of chemically modifying agents. Oligomers were purified as a single well defined peak on a gel filtration column (see below) with a size estimated to ∼30 monomers according to multiangle light scattering and SAXS (32).
Extracellular Toxicity
To evaluate oligomer cytotoxicity, we analyzed their effect on viability of a rat oligodendroglial cell line using the MTT assay that quantifies functional mitochondrial activity. Oligomers decreased viability by about 15% compared with controls (monomer and buffer) (Fig. 1B). However, preincubation of oligomers with EGCG led to complete rescue of OLN-93 cells as measured both by MTT assay (Fig. 1, B and C) and trypan blue staining of nuclei in the permeable cell membranes of dead cells (Fig. 1C). EGCG is able to halve the deleterious effect of oligomers on cell viability (i.e. from 15 to 7.5% reduction in viability) at a molar ratio of 0.36:1 (EGCG/αSNmonomer) (Fig. 1, B and C, and Table 1), corresponding to ∼11 EGCG molecules per oligomer (each of which contains ∼30 monomers).
TABLE 1.
EGCG/αSN molar ratios needed for 50% inhibition of oligomer membrane permeabilization and cytotoxicity
| Assays | MI50%, EGCG/oligomer (EGCG/monomer)a |
|---|---|
| Calcein release | ∼7 (±2):1 (0.23:1) |
| OLN-93 toxicity | ∼11 (±2):1 (0.36:1) |
a Molar ratio of EGCG was needed for 50% inhibition of calcein release and for 50% reduction in the decrease in cell viability caused by oligomer (i.e. from 15 to 7.5%). Ratios are given in units of oligomer concentration (monomer equivalents in parentheses based on 30 monomers/oligomer). Data were from fits to Fig. 1, A and C.
Membrane Permeabilization
We used a simple in vitro assay to investigate EGCG inhibition of membrane permeabilization by αSN oligomers; we monitored the release of the fluorescent dye calcein from LUVs made of the lipid DOPG. Similar assays have previously been used to analyze membrane permeabilization of anionic LUVs induced by αSN oligomers (10, 35, 38). Preincubation of αSN oligomers with EGCG (1 h, 37 °C) leads to inhibition in a dose-response fashion, reaching complete inhibition around 1 μm (Fig. 1A), with 50% inhibition (MI50%, indicates the molar ratio of EGCG needed for 50% effect) at an EGCG/αSNmonomer molar ratio of 0.23:1 (Table 1), i.e. ∼7 EGCG molecules per oligomer. EGCG had no effect on calcein's fluorescence spectrum. Remarkably, the MI50% values based on the extracellular toxicity assay and the calcein release assay are essentially identical within error (Table 1).
Oligomer Interactions with GUVs
We also probed the membrane permeabilizing properties of the αSN oligomers with fluorescence confocal microscopy, in which we entrapped the fluorophore Alexa 488 inside GUVs of either pure DOPG or DOPC. For the zwitterionic lipid DOPC, we observed no vesicle permeabilization (data not shown). With the anionic lipid DOPG, oligomers permeabilized the membrane by vesicle lysis (Fig. 2, A–D). To address whether oligomers preincubated with EGCG were able to bind membranes without inducing membrane permeabilization, we introduced the fluorophore Alexa 633 at the C terminus using the single cysteine mutant A140C. The C terminus is not involved in oligomer-membrane interaction (36). We labeled every 10th αSN molecule prior to oligomerization to ensure ∼3 labeled monomers per oligomer. When preincubated with EGCG at a molar ratio of 1:1 (EGCG/αSNmonomer), the oligomers colocalized with the GUV vesicle but did not cause rupture, and membrane permeabilization was only rarely observed (Fig. 2, E–G). Note that our confocal fluorescence microscopy data do not allow a quantitative estimate of the ratio of membrane-associated and free oligomers. This is measured by AF4 (see below).
FIGURE 2.

Fluorescence confocal microscopy of the effect of αSN oligomers on DOPG vesicles. A–D show vesicles before (A and C) and after (B and D) disruption by EGCG-free oligomers. E and F show images double-stained with Alexa 633-labeled oligomers (green) preincubated with equimolar amounts of EGCG and subsequently added to vesicles containing encapsulated Alexa 488 (red). G, combines E and F. Bar in E–G is 200 μm.
Liquid-state NMR Shows That EGCG Reduces the Flexibility of the C Terminus
Liquid-state NMR does not readily provide structural information on large protein complexes such as αSN oligomers (∼420 kDa). Instead, we exploit this size limitation to detect signals from unstructured (and therefore highly mobile) regions that remain visible by NMR. We compare spectra of monomeric and oligomeric αSN to determine which parts of the αSN sequence become structured in the oligomer (and hence invisible) and which parts remain flexible. Because of the presence of a significant fraction of monomeric protein in the oligomer sample, the contribution from monomer first needs to be subtracted from the oligomer spectra. We therefore recorded the same experiment for monomeric αSN (Fig. 3A), and subtracted that spectrum from the mixed monomer/oligomer spectrum in such a way that no peaks were visible for the NAC region anymore (Fig. 3, B and C). In the oligomeric state, the NAC region is known to be structured and thus invisible (47, 48). This procedure at the same time eliminated all signals stemming from the N-terminal region, as these were apparently exclusively due to monomeric protein. The lack of signals from the region N-terminal to the NAC region indicates that this part of αSN is also immobile in the oligomer (Fig. 3D, black line). Evidently, only residues 86 and onward are flexible in the oligomers described here.
FIGURE 3.

NMR analysis of oligomer-EGCG interactions. A, 1H-15N HSQC spectrum of αSN monomer. B, 1H-15N HSQC spectrum of αSN oligomer where the signal contribution from monomeric αSN is subtracted. C, zoomed region of the superimposed spectra of αSN monomer (black) and oligomer where the signal contribution from monomeric αSN is subtracted (red). D, loss of the NMR signals from the αSN oligomer upon addition of different amounts of EGCG (molar ratios in terms of monomer αSN concentrations). a.u., arbitrary units.
Stepwise addition of EGCG to the oligomers led to a pronounced decrease in the 1H-15N HSQC signal in the C terminus, where ∼50% signal was lost at a molar ratio of 1:1 (EGCG/αSNmonomer) (Fig. 3D). We attribute this loss of flexibility to structural formation in the C terminus upon binding of EGCG. No aggregation was observed as analyzed with DLS before and after EGCG titration (data not shown).
EGCG Does Not Change the Size Distribution and Secondary Structure of Oligomers
We have employed a wide range of techniques to investigate whether EGCG affected the size, shape, and molecular structure of the αSN oligomer. Free oligomers are compared with oligomers preincubated with EGCG for 1 h at 37 °C and a 1:1 molar ratio (EGCG/αSNmonomer), conditions that lead to near complete inhibition of membrane permeabilization and cell toxicity (Fig. 1, A–C). TEM did not detect any aggregation of oligomers incubated with 0:1 (Fig. 4A), 1:1 (data not shown), and 5:1 (Fig. 4B) (molar ratios EGCG/αSNmonomer). However, because TEM sample preparation can affect oligomer size and shape, we included other biophysical techniques to evaluate the effect of EGCG. Batch-mode DLS reveals no significant changes in the size of oligomers upon incubation with EGCG (Table 2). This is confirmed by SEC coupled with refractive index meter analysis where oligomers incubated with and without EGCG lead to similar traces, suggesting similar size distributions (Fig. 5A). Superose 6 10/30 GL with an exclusion limit of ∼4 × 10⁷ Da was used as SEC matrix. The oligomers elute within this separation range, consistent with our previous work (32).
FIGURE 4.

TEM images show no effect of EGCG on oligomer structure. A, free oligomers. B, oligomers incubated with EGCG at an EGCG/αSNmonomer molar ratio of 5:1.
TABLE 2.
Rh value determined with DLS
| Sample | Rh |
|---|---|
| nm | |
| Oligomer | 34.5 ± 2.6 |
| EGCG oligomer (1:1) | 36.6 ± 7.9 |
| EGCG oligomer (5:1) | 31.5 ± 2.4 |
| DOPG | 109.4 ± 1.4 |
| DOPG EGCG | 109.4 ± 0.7 |
| DOPG oligomer | 140.1 ± 2.8 |
| DOPG EGCG oligomer (1:1) | 115.2 ± 1.0 |
| DOPG EGCG oligomer (5:1) | 111.0 ± 1.0 |
| DOPG monomer | 106.9 ± 0.2 |
FIGURE 5.

EGCG does not induce any major structural changes in the oligomer. A, SEC-refraction index analysis of oligomers incubated alone (black) and with EGCG (red). B, SAXS spectra of oligomers (black) and oligomers preincubated with EGCG (red) with the best fit to data of the models described in the text. For visual comparison, the EGCG data and fit have been displaced down by a factor of 10. C, far-UV CD spectra of monomer, oligomer, and oligomer and EGCG at a molar ratio of 1:1 (□ and gray line).
We next used SAXS to evaluate whether EGCG affects the form and size distribution of the oligomers. In fact, SAXS spectra of the oligomers with and without EGCG were highly similar (Fig. 5B). We have previously been able to fit data for the isolated oligomer to a model with a slightly elongated core of folded protein with almost half of the protein protruding as random coils into the solution (32). The EGCG-oligomer complex can be fitted very well to this model, allowing us to disregard the structural contribution of EGCG. The presence of EGCG does not change these parameters (Table 3).
TABLE 3.
Fitting results from the SAXS analysis
| Sample | Radiusa | Aspect ratiob | Rg of chainsc | No. of monomersd | Coil fractione |
|---|---|---|---|---|---|
| Å | Å | ||||
| Oligomer | 47 ± 2 | 2.0 ± 0.2 | 25 ± 2 | 29 | 0.46 ± 0.02 |
| Oligomer + EGCG | 47 ± 1 | 1.7 ± 0.5 | 27 ± 4 | 28 | 0.45 ± 0.08 |
a Short radius of the core prolate ellipsoid of revolution is shown.
b Ratio between long and short radius of ellipsoidal core is shown.
c Radius of gyration of the random coil scattering in the oligomer shell is shown.
d Number of monomers in the oligomer is shown.
e Fraction of the protein that is in random coil configuration in the oligomers is shown.
The number of monomers per oligomer, determined from the forward scattering, is also similar for the oligomer with and without EGCG (29 and 28, respectively). Thus EGCG has no significant effect on the overall size and shape of the oligomers.
Far-UV CD measures the average content of secondary structure. Whereas monomers show a spectrum typical of disordered structure, the oligomer spectrum indicates a significant increase in β-sheet structure (Fig. 5C), consistent with Fourier transform infrared spectroscopy (32). There were no significant changes in the secondary structure of oligomers preincubated with EGCG at a molar ratio of 1:1 (EGCG/αSNmonomer). The oligomer is highly stable and does not undergo conformational changes over 5–85 °C as measured with far-UV CD thermal scans; this is not affected by the presence of EGCG (data not shown).
EGCG Inhibits Oligomer-Membrane Interactions
The effect of oligomers on the calcein release assay and confocal microscopy analysis makes it evident that the oligomers interact with DOPG vesicles. We used AF4 and DLS as two additional assays to probe the interaction of oligomers and vesicles and to test whether EGCG inhibits this interaction.
We utilized the broad separation range of the AF4 method to obtain near baseline separation of monomers (Rh = 2.7 nm) (49), oligomers (Rh = 34.5 ± 2.6 nm), and LUVs (Rh = 109.4 ± 1.4) (Table 2). As shown in Fig. 6A, the oligomer sample includes a monomeric αSN component eluting between the 13.7- and 45-kDa globular standards (data not shown), in agreement with αSN being an intrinsically disordered protein. The αSN oligomer elutes as a single relatively broad peak over 23–39 min. When αSN oligomers were incubated with 100-nm DOPG vesicles at a molar ratio of 100:1 (lipid/αSNmonomer) for 1 h at 37 °C, the monomer peak height decreases to ∼20% of the initial sample. This indicates that αSN monomers also interact with the vesicles (Fig. 6A), which is consistent with many earlier reports and our own AF4-based measurements of monomer-vesicle interactions (34). Furthermore, the oligomer peak essentially disappears (∼5–10% of original size). We note that the vesicle signal (∼60–80 min) represents a combination of signals arising from αSN bound to vesicles and from light scattering by the vesicles, and therefore it cannot be used as a direct measure of the degree of binding. When the oligomer is preincubated with EGCG at a molar ratio of 1:1 (EGCG/αSNmonomer) and mixed with DOPG vesicles, the monomer peak height is decreased to ∼20% (Fig. 6B), just as in the absence of EGCG (Fig. 6A). Together with the near-identical gel filtration profiles for αSN with and without EGCG (Fig. 5A), this indicates that EGCG does not affect the interaction of monomeric αSN with vesicles and does not significantly displace the equilibrium between monomeric and oligomeric αSN. However, the oligomer peak only decreases to ∼40%. This suggests that EGCG reduces but does not completely abolish oligomer interactions with the membrane.
FIGURE 6.

Inhibition of oligomer-membrane interactions. A, AF4-UV size separation of monomer and oligomer from an oligomer preparation incubated without (black) and with (red) DOPG vesicles. B, as A, but here oligomers have been preincubated with EGCG. mAU, milli-absorption units.
DLS measures the Rh of the DOPG vesicles to 109.4 ± 1.4 nm (Table 2), consistent with vesicles extruded with a 100-nm filter. When DOPG vesicles were mixed with oligomers, the Rh increased to 140.1 ± 2.8 nm. The results indicate that oligomers associate with the surface of the vesicles and possibly expand or distort the vesicles. When vesicles were mixed with oligomers preincubated with EGCG, the Rh value was only slightly larger than DOPG vesicles without oligomers, suggesting a much smaller degree of oligomer-membrane interaction (Table 2).
Monomer addition to DOPG vesicles did not lead to any significant increase in the Rh values. All DLS analyses of vesicles with and without oligomer or monomer led to only one peak in the volume and intensity size distribution.
As another measure of oligomer-membrane interactions, we have used the calorimetric methods ITC and DSC. The ITC experiment revealed a clear inhibitory effect of EGCG on oligomer-membrane interactions. The oligomer gives a considerably lower endothermic signal when it has been preincubated with EGCG (Fig. 7A). This suggests that EGCG interferes strongly with oligomer-membrane interactions. In contrast, there is only a small decrease in the signal of monomer-membrane interactions when EGCG is present.
FIGURE 7.

Calorimetric analysis of the interactions between vesicles and either αSN monomer or αSN oligomer, which have been incubated with or without EGCG. A, ITC analysis of the interaction energy between protein samples and DOPG vesicles. B, DSC analysis of the effect of protein samples in the phase transition of DMPG vesicles.
DSC is routinely used to analyze the phase transition of lipids going from the gel phase to the liquid phase. We have previously demonstrated how the αSN monomer folds into DMPG lipids dependent on the lipid phase transition, folding into an α-helical structure as the lipid goes into the liquid-disordered phase (34, 50). Here, we investigate how folding of the αSN monomer and oligomer into DMPG vesicles affects the lipid phase transition (Fig. 7B). Interestingly, the αSN monomer induces a broader phase transition with a Tm slightly shifted toward lower temperatures. In contrast, oligomer shifts the phase transition toward a slightly higher Tm. In good agreement with the ITC experiment, EGCG shifts the Tm toward the Tm of DMPG alone, again indicating that EGCG inhibits oligomer-membrane interactions. Altogether, the AF4, DLS, DSC, and ITC assays strongly suggest that EGCG reduces oligomer-membrane interactions.
Direct EGCG-Membrane Interactions
Inhibition of oligomer-membrane interactions could in principle be caused by EGCG-membrane interactions, e.g. because of screening of charges at the bilayer interphase by EGCG. However, isothermal titration calorimetry revealed no endo- or exothermic signals when EGCG was titrated into DOPG vesicles (data not shown). Finally, we used DSC to analyze the transition of DMPG vesicles from gel phase to the liquid-disordered phase. The melting temperature was highly sensitive toward ligand interactions with the bilayer surface and hydrophobic core. However, we saw no significant effect from EGCG (data not shown). Furthermore, DLS measurements revealed no change in vesicle size upon adding EGCG (Table 2). This confirms that free EGCG had no significant interaction with vesicles.
DISCUSSION
EGCG is an effective inhibitor of αSN oligomers' extracellular toxicity toward OLN-93 cells (Fig. 1B). Within error, the molar ratio of EGCG/αSNoligomer needed for 50% inhibition (∼11:1) is within the range of the one needed in our in vitro calcein release assay (∼7:1) (Table 1), which we use as a simple measure of toxicity (Fig. 1A). The enormous difference in complexity between a cell membrane and a vesicle membrane makes it inappropriate to equate conclusions from the two assays. However, the similar effect of EGCG in these assays provides a direct link between oligomer membrane permeabilization and toxicity. Furthermore, this suggests that simple membrane permeabilization assays might be useful as a first-round screen to evaluate inhibition of oligomer toxicity.
Wanker and co-workers (13) found EGCG to have a dramatic effect both on αSN monomers that formed disordered oligomers and on mature αSN fibrils that were remodeled by EGCG (16). Our study differs from that of Wanker and co-workers (13) in that we focused on how EGCG affects oligomers. We find it remarkable that no pronounced structural changes are induced in the oligomer structure by EGCG. At a molar ratio of 1:1 (EGCG/αSNmonomer) where near-complete inhibition is reached in the extracellular toxicity and membrane permeabilization assay, we see no changes in the oligomer structure according to TEM, SEC-refraction index, SAXS, CD, and DLS. We do detect a difference in the degree of disorder according to NMR, whose spectra demonstrate that the otherwise highly mobile C terminus loses flexibility. Nevertheless, the loss of mobility does not imply that the oligomer collapses to a more compact state, because SAXS data do not detect any significant decrease in the size of the disordered shell. Thus, there is only a limited decrease in C-terminal tail flexibility. At higher molar ratios (10:1, Fig. 3D), EGCG can likely associate less specifically with all residues that are exposed at the oligomer surface (13). Note that we cannot determine stoichiometry of binding from these data, first because we cannot monitor binding to regions outside the C terminus, and second because there might be additional binding after the signals from the C-terminal residues disappear.
To complement the permeabilization assays, we used AF4, DLS, ITC, and DSC as oligomer-membrane binding assays. The AF4 assay demonstrated that nearly all oligomer associated with DOPG vesicles (Fig. 6A). This was supported by DLS measurements where an ∼30% increase in the Rh value of vesicles was observed when oligomers were bound (Table 1). Furthermore, ITC showed large endothermic responses for oligomer binding to the membrane, and DSC revealed changes to the lipid-phase transition. Oligomers preincubated with EGCG at a 1:1 molar ratio (EGCG/αSNmonomer) completely inhibited membrane permeabilization and cell toxicity (Fig. 6B), even though ∼60% of oligomers remain membrane-associated. ITC and DSC show clear inhibition of oligomer-membrane interactions at a molar ratio of 2:1 (EGCG/αSNmonomer); however, similarly to AF4 data, this inhibition was only partial (Fig. 7, A and B). Confocal fluorescence microscopy also shows that oligomers, preincubated with EGCG, are bound to vesicles without inducing membrane permeabilization (Fig. 2, E–G).
EGCG could in principle be acting by different mechanisms as follows. (a) The oligomer acts as a pore, as suggested in the literature, and EGCG directly blocks the pore. (b) A critical concentration of oligomer in the membrane is required to permeabilize the membrane as suggested by Subramaniam and co-workers (38), and EGCG reduces the concentration of membrane-bound oligomers. Thus EGCG simply shifts the equilibrium away from the bound state, and we would expect lysis or permeabilization to occur (albeit at lower frequency) at sufficiently high oligomer concentrations. Direct evidence for pore formation generally comes in the form of atomic force microscopy and TEM images, showing oligomers as ring-shaped structures with hollow interiors. However, these images are typically measured in the dry state. It is not clear to what extent binding to a solid surface will compromise these structures. SAXS measures oligomer structures in solution, reducing the risk of artifacts. A SAXS study of the αSN oligomer highlighted a wreath-like structure with low density in the middle, although it remains unclear whether this indeed constitutes a pore channel (30). An indirect support of the critical concentration destabilization model is that it will likely distort membranes to a greater extent than pore formation, and indeed we see a significant expansion of vesicle size upon addition of oligomers, but not when EGCG is added together with the oligomers.
AF4, SEC, and NMR identified a significant amount of monomer in the oligomer batches (10–20%) (Figs. 3A, 5A, and 6A). However, the monomers are considerably less potent in the vesicle permeabilization assay and cell toxicity assay. Furthermore, we observe no changes in the oligomer and monomer populations as a result of EGCG or incubation time (Fig. 5A). Therefore, we do not expect any major effect from monomers in our assays. Also, we do not observe pronounced interaction between vesicles and EGCG, and we do not believe that this could lead to the observed inhibition.
In conclusion, our data suggest that an in vitro membrane permeabilization assay can be used as a simple model of the highly more complex extracellular toxicity assay, because EGCG potently inhibits oligomer activity in both assays at similar concentrations. Contrary to our initial expectations, EGCG has no major effects on the oligomer structure. From our oligomer-membrane binding assays, moderate inhibition is observed by EGCG on oligomer-membrane interactions. However, the inhibition is only partial, and we therefore speculate that membrane permeabilization by αSN oligomers is caused by membrane destabilization events rather than pore formation. Our inhibition model is summarized in Fig. 8.
FIGURE 8.

Schematic representation of EGCG inhibition of oligomer toxicity. Illustration courtesy of Simon Lykkemark.
Acknowledgments
We are grateful to Professor Luis Bagatolli from Southern University of Denmark and Dr. Nelson Ferreira from University of Porto for valuable discussions. We also thank Jørgen Kjems for the use of Zetasizer Nano ZS in his laboratory.
This article was selected as a Paper of the Week.
C. L. P. Oliveira and J. S. Pedersen, unpublished data.
- αSN
- α-synuclein
- AF4
- asymmetrical flow field-flow fractionation
- DLS
- dynamic light scattering
- DMPG
- 1,2-dimyristoyl-sn-3-phosphatidylglycerol
- DOPG
- 1,2-dioleoyl-sn-3-phosphatidylglycerol
- DSC
- differential scanning calorimetry
- EGCG
- epigallocatechin gallate
- GUV
- giant unilamellar vesicles
- HSQC
- 1H-15N heteronuclear single-quantum coherence
- ITC
- isothermal titration calorimetry
- PD
- Parkinson disease
- Rh
- hydrodynamic radius
- SAXS
- small angle x-ray scattering
- SEC
- size exclusion chromatography
- TEM
- transmission electron microscopy
- LUV
- large unilamellar vesicle
- MTT
- 3-(4,5-dimethylthiazol-2-yl)-2,5-diphenyltetrazolium bromide
- CF
- cross-flow
- NAC
- non-amyloid component.
REFERENCES
- 1. Spillantini M. G., Schmidt M. L., Lee V. M., Trojanowski J. Q., Jakes R., Goedert M. (1997) α-Synuclein in Lewy bodies. Nature 388, 839–840 [DOI] [PubMed] [Google Scholar]
- 2. Spillantini M. G., Crowther R. A., Jakes R., Hasegawa M., Goedert M. (1998) α-Synuclein in filamentous inclusions of Lewy bodies from Parkinson's disease and dementia with Lewy bodies. Proc. Natl. Acad. Sci. U.S.A. 95, 6469–6473 [DOI] [PMC free article] [PubMed] [Google Scholar]
- 3. Polymeropoulos M. H., Lavedan C., Leroy E., Ide S. E., Dehejia A., Dutra A., Pike B., Root H., Rubenstein J., Boyer R., Stenroos E. S., Chandrasekharappa S., Athanassiadou A., Papapetropoulos T., Johnson W. G., Lazzarini A. M., Duvoisin R. C., Di Iorio G., Golbe L. I., Nussbaum R. L. (1997) Mutation in the α-synuclein gene identified in families with Parkinson's disease. Science 276, 2045–2047 [DOI] [PubMed] [Google Scholar]
- 4. Conway K. A., Harper J. D., Lansbury P. T. (1998) Accelerated in vitro fibril formation by a mutant α-synuclein linked to early-onset Parkinson disease. Nat. Med. 4, 1318–1320 [DOI] [PubMed] [Google Scholar]
- 5. Narhi L., Wood S. J., Steavenson S., Jiang Y., Wu G. M., Anafi D., Kaufman S. A., Martin F., Sitney K., Denis P., Louis J. C., Wypych J., Biere A. L., Citron M. (1999) Both familial Parkinson's disease mutations accelerate α-synuclein aggregation. J. Biol. Chem. 274, 9843–9846 [DOI] [PubMed] [Google Scholar]
- 6. Lashuel H. A., Hartley D., Petre B. M., Walz T., Lansbury P. T., Jr. (2002) Neurodegenerative disease: amyloid pores from pathogenic mutations. Nature 418, 291. [DOI] [PubMed] [Google Scholar]
- 7. Winner B., Jappelli R., Maji S. K., Desplats P. A., Boyer L., Aigner S., Hetzer C., Loher T., Vilar M., Campioni S., Tzitzilonis C., Soragni A., Jessberger S., Mira H., Consiglio A., Pham E., Masliah E., Gage F. H., Riek R. (2011) In vivo demonstration that α-synuclein oligomers are toxic. Proc. Natl. Acad. Sci. U.S.A. 108, 4194–4199 [DOI] [PMC free article] [PubMed] [Google Scholar]
- 8. Paleologou K. E., Kragh C. L., Mann D. M., Salem S. A., Al-Shami R., Allsop D., Hassan A. H., Jensen P. H., El-Agnaf O. M. (2009) Detection of elevated levels of soluble α-synuclein oligomers in post-mortem brain extracts from patients with dementia with Lewy bodies. Brain 132, 1093–1101 [DOI] [PubMed] [Google Scholar]
- 9. Tokuda T., Qureshi M. M., Ardah M. T., Varghese S., Shehab S. A., Kasai T., Ishigami N., Tamaoka A., Nakagawa M., El-Agnaf O. M. (2010) Detection of elevated levels of α-synuclein oligomers in CSF from patients with Parkinson disease. Neurology 75, 1766–1772 [DOI] [PubMed] [Google Scholar]
- 10. Volles M. J., Lee S. J., Rochet J. C., Shtilerman M. D., Ding T. T., Kessler J. C., Lansbury P. T., Jr. (2001) Vesicle permeabilization by protofibrillar α-synuclein: implications for the pathogenesis and treatment of Parkinson's disease. Biochemistry 40, 7812–7819 [DOI] [PubMed] [Google Scholar]
- 11. Quist A., Doudevski I., Lin H., Azimova R., Ng D., Frangione B., Kagan B., Ghiso J., Lal R. (2005) Amyloid ion channels: a common structural link for protein-misfolding disease. Proc. Natl. Acad. Sci. U.S.A. 102, 10427–10432 [DOI] [PMC free article] [PubMed] [Google Scholar]
- 12. Kayed R., Head E., Thompson J. L., McIntire T. M., Milton S. C., Cotman C. W., Glabe C. G. (2003) Common structure of soluble amyloid oligomers implies common mechanism of pathogenesis. Science 300, 486–489 [DOI] [PubMed] [Google Scholar]
- 13. Ehrnhoefer D. E., Bieschke J., Boeddrich A., Herbst M., Masino L., Lurz R., Engemann S., Pastore A., Wanker E. E. (2008) EGCG redirects amyloidogenic polypeptides into unstructured, off-pathway oligomers. Nat. Struct. Mol. Biol. 15, 558–566 [DOI] [PubMed] [Google Scholar]
- 14. Hong D. P., Fink A. L., Uversky V. N. (2008) Structural characteristics of α-synuclein oligomers stabilized by the flavonoid baicalein. J. Mol. Biol. 383, 214–223 [DOI] [PMC free article] [PubMed] [Google Scholar]
- 15. Conway K. A., Rochet J. C., Bieganski R. M., Lansbury P. T., Jr. (2001) Kinetic stabilization of the α-synuclein protofibril by a dopamine-α-synuclein adduct. Science 294, 1346–1349 [DOI] [PubMed] [Google Scholar]
- 16. Bieschke J., Russ J., Friedrich R. P., Ehrnhoefer D. E., Wobst H., Neugebauer K., Wanker E. E. (2010) EGCG remodels mature α-synuclein and amyloid-β fibrils and reduces cellular toxicity. Proc. Natl. Acad. Sci. U.S.A. 107, 7710–7715 [DOI] [PMC free article] [PubMed] [Google Scholar]
- 17. Singh B. N., Shankar S., Srivastava R. K. (2011) Green tea catechin, epigallocatechin-3-gallate (EGCG): mechanisms, perspectives and clinical applications. Biochem. Pharmacol. 82, 1807–1821 [DOI] [PMC free article] [PubMed] [Google Scholar]
- 18. Zhu M., Rajamani S., Kaylor J., Han S., Zhou F., Fink A. L. (2004) The flavonoid baicalein inhibits fibrillation of α-synuclein and disaggregates existing fibrils. J. Biol. Chem. 279, 26846–26857 [DOI] [PubMed] [Google Scholar]
- 19. Li J., Zhu M., Manning-Bog A. B., Di Monte D. A., Fink A. L. (2004) Dopamine and l-dopa disaggregate amyloid fibrils: implications for Parkinson's and Alzheimer's disease. FASEB J. 18, 962–964 [DOI] [PubMed] [Google Scholar]
- 20. Meng X., Munishkina L. A., Fink A. L., Uversky V. N. (2010) Effects of various flavonoids on the α-synuclein fibrillation process. Parkinsons Dis. 2010, 650794. [DOI] [PMC free article] [PubMed] [Google Scholar]
- 21. Ehrnhoefer D. E., Duennwald M., Markovic P., Wacker J. L., Engemann S., Roark M., Legleiter J., Marsh J. L., Thompson L. M., Lindquist S., Muchowski P. J., Wanker E. E. (2006) Green tea (−)-epigallocatechin-gallate modulates early events in huntingtin misfolding and reduces toxicity in Huntington's disease models. Hum. Mol. Genet. 15, 2743–2751 [DOI] [PubMed] [Google Scholar]
- 22. Meng F., Abedini A., Plesner A., Verchere C. B., Raleigh D. P. (2010) The flavanol (−)-epigallocatechin 3-gallate inhibits amyloid formation by islet amyloid polypeptide, disaggregates amyloid fibrils, and protects cultured cells against IAPP-induced toxicity. Biochemistry 49, 8127–8133 [DOI] [PMC free article] [PubMed] [Google Scholar]
- 23. Ferreira N., Saraiva M. J., Amleida M. R. (2011) Natural polyphenols inhibit different steps of the process of transthyretin (TTR) amyloid fibril formation. FEBS Lett. 585, 2424–2430 [DOI] [PubMed] [Google Scholar]
- 24. Chandrashekaran I. R., Adda C. G., MacRaild C. A., Anders R. F., Norton R. S. (2010) Inhibition by flavonoids of amyloid-like fibril formation by Plasmodium falciparum merozoite surface protein 2. Biochemistry 49, 5899–5908 [DOI] [PubMed] [Google Scholar]
- 25. Hudson S. A., Ecroyd H., Dehle F. C., Musgrave I. F., Carver J. A. (2009) (−)-Epigallocatechin-3-gallate (EGCG) maintains κ-casein in its pre-fibrillar state without redirecting its aggregation pathway. J. Mol. Biol. 392, 689–700 [DOI] [PubMed] [Google Scholar]
- 26. Roberts B. E., Duennwald M. L., Wang H., Chung C., Lopreiato N. P., Sweeny E. A., Knight M. N., Shorter J. (2009) A synergistic small-molecule combination directly eradicates diverse prion strain structures. Nat. Chem. Biol. 5, 936–946 [DOI] [PMC free article] [PubMed] [Google Scholar]
- 27. Palhano F. L., Lee J., Grimster N. P., Kelly J. W. (2013) Toward the molecular mechanism(s) by which EGCG treatment remodels mature amyloid fibrils. J. Am. Chem. Soc. 135, 7503–7510 [DOI] [PMC free article] [PubMed] [Google Scholar]
- 28. Herrera F. E., Chesi A., Paleologou K. E., Schmid A., Munoz A., Vendruscolo M., Gustincich S., Lashuel H. A., Carloni P. (2008) Inhibition of α-synuclein fibrillization by dopamine is mediated by interactions with five C-terminal residues and with E83 in the NAC region. PLoS One 3, e3394. [DOI] [PMC free article] [PubMed] [Google Scholar]
- 29. Norris E. H., Giasson B. I., Hodara R., Xu S., Trojanowski J. Q., Ischiropoulos H., Lee V. M. (2005) Reversible inhibition of α-synuclein fibrillization by dopaminochrome-mediated conformational alterations. J. Biol. Chem. 280, 21212–21219 [DOI] [PubMed] [Google Scholar]
- 30. Giehm L., Svergun D. I., Otzen D. E., Vestergaard B. (2011) Low-resolution structure of a vesicle disrupting α-synuclein oligomer that accumulates during fibrillation. Proc. Natl. Acad. Sci. U.S.A. 108, 3246–3251 [DOI] [PMC free article] [PubMed] [Google Scholar]
- 31. Zijlstra N., Blum C., Segers-Nolten I. M., Claessens M. M., Subramaniam V. (2012) Molecular composition of sub-stoichiometrically labeled α-synuclein oligomers determined by single-molecule photobleaching. Angew. Chem. Int. Ed. Engl. 51, 8821–8824 [DOI] [PubMed] [Google Scholar]
- 32. Lorenzen N., Nielsen S. B., Buell A. K., Kaspersen J. D., Arosio P., Vad B. S., Paslawski W., Christiansen G., Valnickova-Hansen Z., Andreasen M., Enghild J. J., Pedersen J. S., Dobson C. M., Knowles T. P., Otzen D. E. (2014) The role of stable α-synuclein oligomers in the molecular events underlying amyloid formation. J. Am. Chem. Soc. 136, 3859–3868 [DOI] [PubMed] [Google Scholar]
- 33. van Rooijen B. D., Claessens M. M., Subramaniam V. (2008) Membrane binding of oligomeric α-synuclein depends on bilayer charge and packing. FEBS Lett. 582, 3788–3792 [DOI] [PubMed] [Google Scholar]
- 34. Lorenzen N., Lemminger L., Pedersen J. N., Nielsen S. B., Otzen D. E. (2014) The N terminus of α-synuclein is essential for both monomeric and oligomeric interactions with membranes. FEBS Lett. 588, 497–502 [DOI] [PubMed] [Google Scholar]
- 35. van Rooijen B. D., Claessens M. M., Subramaniam V. (2009) Lipid bilayer disruption by oligomeric α-synuclein depends on bilayer charge and accessibility of the hydrophobic core. Biochim. Biophys. Acta 1788, 1271–1278 [DOI] [PubMed] [Google Scholar]
- 36. van Rooijen B. D., van Leijenhorst-Groener K. A., Claessens M. M., Subramaniam V. (2009) Tryptophan fluorescence reveals structural features of α-synuclein oligomers. J. Mol. Biol. 394, 826–833 [DOI] [PubMed] [Google Scholar]
- 37. Stöckl M. T., Zijlstra N., Subramaniam V. (2013) α-Synuclein oligomers: an amyloid pore? Insights into mechanisms of α-synuclein oligomer-lipid interactions. Mol. Neurobiol. 47, 613–621 [DOI] [PubMed] [Google Scholar]
- 38. van Rooijen B. D., Claessens M. M., Subramaniam V. (2010) Membrane permeabilization by oligomeric α-synuclein: In search of the mechanism. PLoS One 5, e14292. [DOI] [PMC free article] [PubMed] [Google Scholar]
- 39. Richter-Landsberg C., Heinrich M. (1996) OLN-93: a new permanent oligodendroglia cell line derived from primary rat brain glial cultures. J. Neurosci. Res. 45, 161–173 [DOI] [PubMed] [Google Scholar]
- 40. Angelova M. I., Dimitrov D. S. (1986) Liposome electroformation. Faraday Discuss. Chem. Soc. 81, 303–311 [Google Scholar]
- 41. Bagatolli L. A., Gratton E. (1999) Two-photon fluorescence microscopy observation of shape changes at the phase transition in phospholipid giant unilamellar vesicles. Biophys. J. 77, 2090–2101 [DOI] [PMC free article] [PubMed] [Google Scholar]
- 42. Delaglio F., Grzesiek S., Vuister G. W., Zhu G., Pfeifer J., Bax A. (1995) NMRPipe: a multidimensional spectral processing system based on UNIX pipes. J. Biomol. NMR 6, 277–293 [DOI] [PubMed] [Google Scholar]
- 43. Pedersen J. S. (2004) A flux- and background-optimized version of the NanoSTAR small-angle x-ray scattering camera for solution scattering. J. Appl. Crystallogr. 37, 369–380 [Google Scholar]
- 44. Pedersen J. S., Gerstenberg M. C. (1996) Scattering form factor of block copolymer micelles. Macromolecules 29, 1363–1365 [Google Scholar]
- 45. Guinier A. (1939) La diffraction des rayons X aux tres petits angles; application a l'etude de phenomenes ultramicroscopiques. Ann. Phys. 12, 161–237 [Google Scholar]
- 46. Debye P. (1947) Molecular-weight determination by light scattering. J. Phys. Colloid. Chem. 51, 18–32 [DOI] [PubMed] [Google Scholar]
- 47. Mysling S., Betzer C., Jensen P. H., Jorgensen T. J. (2013) Characterizing the dynamics of α-synuclein oligomers using hydrogen/deuterium exchange monitored by mass spectrometry. Biochemistry 52, 9097–9103 [DOI] [PubMed] [Google Scholar]
- 48. Paslawski W., Mysling S., Thomsen K., Jørgensen T. J. D., Otzen D. E. (2014) Co-existence of two different α-synuclein oligomers with different core structures determined by hydrogen/deuterium exchange mass spectrometry. Angew. Chem. Int. Ed. Engl. 10.1002/anie.201400491 [DOI] [PubMed] [Google Scholar]
- 49. Morar A. S., Olteanu A., Young G. B., Pielak G. J. (2001) Solvent-induced collapse of α-synuclein and acid-denatured cytochrome c. Protein Sci. 10, 2195–2199 [DOI] [PMC free article] [PubMed] [Google Scholar]
- 50. Kjaer L., Giehm L., Heimburg T., Otzen D. (2009) The influence of vesicle size and composition on α-synuclein structure and stability. Biophys. J. 96, 2857–2870 [DOI] [PMC free article] [PubMed] [Google Scholar]
- 51. Goddard T. D., Kneller D. G. (2008) SPARKY, Version 3, University of California, San Francisco [Google Scholar]