

Background: Mitochondrial dysfunction and aggregation of α-synuclein both contribute to Parkinson disease.
Results: Prefibrillar α-synuclein oligomers reduce the Ca2+ retention time of isolated mitochondria respiring with complex I but not II substrates.
Conclusion: Oligomeric α-synuclein promotes mitochondrial dysfunction in a Ca2+- and respiratory substrate-dependent manner.
Significance: The Ca2+-dependence of α-synuclein's effects may contribute to selective neuronal vulnerability in Parkinson disease.
Keywords: alpha-Synuclein, Electron Transport System (ETS), Mitochondria, Mitochondrial Permeability Transition (MPT), Parkinson Disease, Protein Aggregation, Complex I
Abstract
α-Synuclein (αSyn) aggregation and mitochondrial dysfunction both contribute to the pathogenesis of Parkinson disease (PD). Although recent studies have suggested that mitochondrial association of αSyn may disrupt mitochondrial function, it is unclear what aggregation state of αSyn is most damaging to mitochondria and what conditions promote or inhibit the effect of toxic αSyn species. Because the neuronal populations most vulnerable in PD are characterized by large cytosolic Ca2+ oscillations that burden mitochondria, we examined mitochondrial Ca2+ stress in an in vitro system comprising isolated mitochondria and purified recombinant human αSyn in various aggregation states. Using fluorimetry to simultaneously measure four mitochondrial parameters, we observed that soluble, prefibrillar αSyn oligomers, but not monomeric or fibrillar αSyn, decreased the retention time of exogenously added Ca2+, promoted Ca2+-induced mitochondrial swelling and depolarization, and accelerated cytochrome c release. Inhibition of the permeability transition pore rescued these αSyn-induced changes in mitochondrial parameters. Interestingly, the mitotoxic effects of αSyn were specifically dependent upon both electron flow through complex I and mitochondrial uptake of exogenous Ca2+. Our results suggest that soluble prefibrillar αSyn oligomers recapitulate several mitochondrial phenotypes previously observed in animal and cell models of PD: complex I dysfunction, altered membrane potential, disrupted Ca2+ homeostasis, and enhanced cytochrome c release. These data reveal how the association of oligomeric αSyn with mitochondria can be detrimental to the function of cells with high Ca2+-handling requirements.
Introduction
Parkinson disease (PD),2 the second most common neurodegenerative disease, is characterized by the conversion of the normally soluble cytoplasmic protein α-synuclein (αSyn) into insoluble amyloid fibrils that accumulate as cytoplasmic aggregates termed Lewy bodies and Lewy neurites (1). Duplication or triplication of the wild-type αSyn locus causes gene dose-dependent early onset PD (2, 3), and five pathogenic missense mutations have been reported to cause autosomal dominant PD (4). Moreover, 3′-UTR variants and other single nucleotide polymorphisms in the SNCA gene that lead to increased αSyn expression are found in a subset of cases of sporadic PD (5). In addition, mutations in glucocerebrosidase (GBA1), the most common genetic risk factor for PD, can elevate αSyn protein levels, perhaps via reduced lysosomal degradation (6). Thus, impaired proteostasis of αSyn is probably a key step in the pathogenesis of PD and related human synucleinopathies.
A growing body of evidence suggests that αSyn normally exits in an equilibrium between partially helical tetramers and unfolded monomers (7–10). Helical, oligomeric αSyn is aggregation-resistant in vitro (7), whereas the unfolded monomer readily aggregates into insoluble, β-sheet-rich amyloid-type fibrils through soluble oligomeric intermediates (11). Recent studies indicate that these abnormal soluble oligomers, in contrast to the fibrillar end products, are neurotoxic in vitro and in disease models (12–15). The pathological mechanisms of these toxic oligomeric intermediates and the basis for the selective vulnerability of certain brain regions to their effects are as yet undetermined.
Many observations suggest that mitochondrial dysfunction is associated with PD. Toxins targeting complex I of the electron transport chain (ETC) can cause parkinsonism in humans and animal models (16–18), and postmortem brain tissue of PD patients shows deficits in mitochondrial complex I activity (19–21). Markers of mitochondrial oxidative stress, including oxidized complex I subunits (22) and mitochondrial DNA mutations (23), are also elevated in PD patients, although it is unclear whether these are a cause or consequence of ETC dysfunction. The neuronal populations most impaired in PD, including the substantia nigra pars compacta, locus ceruleus, and dorsal motor nucleus of the vagus, share an unusual physiological phenotype; they consist primarily of broad-spike pacemaking neurons with high transmembrane Ca2+ currents and low Ca2+ buffering capacities (24). This combination places a great metabolic burden on mitochondria to continually reestablish the resting cytosolic Ca2+ concentration. Mitochondria-targeted, redox-sensitive GFP reveals a more oxidative mitochondrial environment in these neurons relative to those of regions less affected in PD (25, 26). The basal level of oxidant stress in the mitochondria of vulnerable neurons may put them at risk of dysfunction caused by an additional stressor.
αSyn may associate abnormally with mitochondria in PD patients and animal models (27–33). An apparent partial subcellular redistribution of αSyn from the cytoplasm to the inner and outer mitochondrial membranes (27, 34, 35) is correlated with mitochondrial dysfunction, including increased oxidative stress, reduced mitochondrial membrane potential (ΔΨm), altered Ca2+ homeostasis, and cytochrome c release (27, 29–31, 33, 36, 37). Few studies have directly investigated the effect of different forms of αSyn on mitochondrial function. One reported that incubation of isolated mitochondria with aggregated αSyn can increase markers of oxidative stress, but the aggregation state (fibrillar or oligomeric) was not thoroughly characterized (36). No previous studies have tested the role of mitochondrial Ca2+ stress or specific respiratory substrates in the ability of diverse αSyn species to induce mitochondrial dysfunction. It therefore remains unclear what form of αSyn is most damaging to mitochondrial function and which conditions promote or inhibit the effect of toxic αSyn species.
We sought to investigate the functional consequences of αSyn on Ca2+-challenged mitochondria, with a particular focus on the αSyn aggregation state. We modeled mitochondrial Ca2+ stress in an in vitro system comprising isolated mitochondria from liver and brain and pure, recombinant human αSyn at various aggregation states. Soluble, oligomeric αSyn aggregates generated by two independent methods, but not monomeric αSyn or mature fibrils, sensitized mitochondria to Ca2+-induced dysfunction. The effects of oligomeric αSyn were observed only when mitochondria were respiring under complex I-dependent conditions and were challenged with exogenous Ca2+ addition. Our results demonstrate a specific effect of oligomeric αSyn on complex I-dependent function and reveal a mechanism by which the physical association of αSyn with mitochondria impairs their function.
EXPERIMENTAL PROCEDURES
Purification and Preparation of αSyn Species
Purification
Recombinant human αSyn was purified essentially as described (38). Briefly, E. coli transformed with human wild type αSyn were grown to A600 = 0.5–1, at which time isopropyl 1-thio-β-d-galactopyranoside was added to 1 mm to induce αSyn expression. At A600 = 1.5–1.8, bacteria were pelleted by centrifugation and boiled in anion exchange buffer (20 mm Tris, 25 mm NaCl, pH 8.0). Boiled bacterial lysate was purified sequentially by anion exchange chromatography (using two 5-ml HiTrap Q HP columns, GE Healthcare) and size exclusion chromatography (using a Superdex 200 XK26/00 column, GE Healthcare). Protein not used immediately was lyophilized and stored at 4 °C. Lyophilized protein was reconstituted either in PBS or 10 mm ammonium acetate, depending on the method used to prepare oligomers (see below).
Lag Phase Preparation
0.6 mg/ml recombinant αSyn in 10 mm ammonium acetate was incubated at 37 °C with nutation. The aggregation state was monitored using Thioflavin T (ThT) fluorescence (see below). “Unaged” αSyn was sampled at time 0 (prior to 37 °C incubation or nutation). αSyn aged 3–9 days without ThT fluorescence above background was considered “ThTneg”; αSyn that had plateaued in ThT fluorescence was considered “ThTpos.”
Sonicated Preparation
2 mg/ml recombinant αSyn in PBS was aggregated for 5 days at 37 °C with nutation to form ThTpos fibrils. To generate oligomers, αSyn fibrils were diluted to 1 mg/ml and sonicated at power level 50 for 5 × 10 s using a Sonic Dismembrator model 300 (Fisher). Aliquots of the resultant material were flash-frozen in liquid nitrogen and stored at −80 °C. Fractions of this material were prepared by serial differential centrifugation, first at 16,000 × g for 5 min. The supernatant was transferred to a new tube, and the pellet was resuspended in an equal volume of PBS. The 16,000 × g supernatant was then spun at 100,000 × g for 30 min at 4 °C. The supernatant was transferred to a new tube, and the pellet was resuspended in an equal volume of PBS. The use of a programmable Ultrasonic Liquid Processor (Misonix) equipped with a microtip (settings: amplitude of 20, sonication for 1 s on and 1 s off for a total of 60 s) also produced αSyn oligomers with bioactivity on mitochondria comparable with the bioactivity of oligomers produced via our standard manual sonication technique. For both sonicated and lag phase preparations, concentrations of fibrillar and oligomeric αSyn listed are estimated based on the monomer concentration before aggregation as determined by A280 using a NanoDrop spectrophotometer (Thermo Scientific).
Electron Microscopy
αSyn fibrils, total sonicated αSyn, and 100,000 × g soluble sonicated αSyn were each diluted 1:10 in PBS. 5 μl of these αSyn samples were adsorbed for 1 min to a carbon-coated grid that had been made hydrophilic by a 30-s exposure to a glow discharge. Excess liquid was removed with filter paper (Whatman), and the samples were stained with 0.75% uranyl formate for 30 s. After removing the excess uranyl formate with filter paper, the grids were examined using a TecnaiG2 Spirit BioTWIN transmission electron microscope. Images were acquired with an AMT 2k CCD camera.
Aliquots of mitochondrial suspensions (see below) were spun at 14,000 × g for 5 min to pellet mitochondria. Mitochondrial pellets were fixed in 2.5% glutaraldehyde, 1.25% paraformaldehyde, and 0.03% picric acid in 0.1 m sodium cacodylate buffer (pH 7.4) for at least 2 h at room temperature and then washed in 0.1 m cacodylate buffer and postfixed with 1% osmium tetroxide (OsO4), 1.5% potassium ferrocyanide (KFeCN6) for 1 h. Samples were then washed three times in H2O and incubated in 1% aqueous uranyl acetate for 1 h followed by two washes in H2O and subsequent dehydration in grades of alcohol (10 min each: 50%, 70%, 90%: twice for 10 min each: 100%). The samples were then put in propylene oxide for 1 h and infiltrated overnight in a 1:1 mixture of propylene oxide and TAAB Epon (Marivac Canada Inc., St. Laurent, Canada). The following day, the samples were embedded in TAAB Epon and polymerized at 60 °C for 48 h. Ultrathin sections (∼60 nm) were cut on a Reichert Ultracut-S microtome and transferred onto copper grids stained with lead citrate. Sections were examined in a JEOL 1200EX Transmission electron microscope or a TecnaiG2 Spirit BioTWIN, and images were recorded with an AMT 2k CCD camera. Measurements of mitochondrial diameter were obtained using ImageJ (National Institutes of Health).
Dynamic Light Scattering
Experiments were performed using a DynaPro (Wyatt Technology) instrument equipped with a 20 °C temperature-controlled microsampler. αSyn samples in PBS were placed in a 1.5-mm path length quartz cuvette, and light scattering was measured in 10-s intervals for 20 cycles. Data were analyzed using Dynamic version 5 software.
Thioflavin T Assays
2.5 μm αSyn at various aggregation states (i.e. unaged/monomer, fibrils, sonicated oligomers and fractions thereof, and lag phase samples) was added in triplicate to 10 μm ThT in 10 mm glycine buffer, pH 9, to a total of 200 μl. Fluorescence at excitation/emission of 447/485 nm was measured in a black 96-well plate using the Synergy H1 Hybrid Reader (BioTek). Background fluorescence of buffer (PBS or 10 mm ammonium acetate) was subtracted from αSyn-containing samples. For aggregation seeding assays, 100 μl of 7–20 μm monomeric αSyn in PBS plus 1 mol % of αSyn “seeds” at various aggregation states and 10 μm ThT were added in triplicate to a black 96-well plate. Plates were incubated at 37 °C under constant agitation at 300 rpm using a titer plate shaker (Lab Line Instruments). ThT fluorescence at excitation/emission of 447/485 nm was measured periodically as above.
Mitochondrial Isolation
All chemicals were purchased from Sigma-Aldrich unless stated otherwise. All procedures for animal use and euthanasia were approved by the institutional animal care and use committee. Liver mitochondria were isolated from ∼11–13-week-old mice by the standard differential centrifugation method in sucrose-based buffers as described previously (39, 40) with some modifications. Briefly, the liver was homogenized in a buffer containing 240 mm sucrose, 10 mm K+-HEPES, pH 7.4, 1 mm K+-EGTA, and 0.5% fatty acid-free bovine serum albumin (BSA) and centrifuged at 1,000 × g for 10 min. The supernatant was then centrifuged for 8 min at 8,000 × g. The resulting pellet was resuspended in the same buffer and centrifuged for 8 min at 8,000 × g. The pellet from this spin was resuspended in 240 mm sucrose, 10 mm K+-HEPES, pH 7.4, and centrifuged again for 8 min at 8,000 × g. The final mitochondrial pellet was resuspended in 0.2 ml of 240 mm sucrose, 10 mm K+-HEPES, pH 7.4. All centrifugation steps were performed at 4 °C. Mitochondrial protein concentration was determined by the DC protein assay (Bio-Rad) using BSA as a standard. The quality of isolated mitochondria was assessed by the respiratory control ratio, calculated as the ratio between the rates of respiration in states 3 (ADP-stimulated) and 4 (ADP-exhausted) (41). The respiratory control ratio for mitochondria used in this study was measured to be 4.9 ± 0.18 under the following conditions: 10 mm succinate, 1 μm rotenone, and 200 μm ADP.
Non-synaptosomal brain mitochondria were isolated from ∼4–5-week-old mice using a discontinuous Ficoll gradient according to the commonly used method of Lai and Clark (42), with slight modifications as described previously (40). Briefly, the cerebral corticies from 10–12 mice were homogenized in a buffer containing 320 mm sucrose, 10 mm K+-HEPES, pH 7.4, 1 mm K+-EGTA, and 0.2% BSA and centrifuged at 2,000 × g for 3 min. The supernatant was then centrifuged again for 3 min at 2,000 × g and then for 8 min at 12,000 × g. The pellet from this spin was resuspended in 5 ml of 320 mm sucrose, 10 mm K+-HEPES, pH 7.4, 1 mm K+-EGTA buffer, layered on Ficoll gradient (7.5%/10%), and centrifuged again for 12 min at 100,000 × g (23,400 rpm; Beckman ultracentrifuge with swinging rotor SW28). The resulting pellet was resuspended in 240 mm sucrose, 10 mm K+-HEPES buffer and centrifuged for 8 min at 12,000 × g. This step was performed twice. The final mitochondrial pellet was resuspended in 0.05 ml of 240 mm sucrose, 10 mm K+-HEPES, pH 7.4.
Measurement of Mitochondrial Ca2+ Uptake Capacity, Membrane Potential, NAD(P)H Oxidation, and Swelling
All chemicals were purchased from Sigma-Aldrich unless stated otherwise. The measurement of these parameters was performed simultaneously on a multichannel dye fluorimeter (C&L Instruments, Inc.) as described previously (39, 40). Liver mitochondria were incubated in buffer containing 240 mm sucrose, 10 mm HEPES, pH 7.2, 1 mm KH2PO4, 3 μm EDTA, and either 5 mm glutamate/malate or 5 mm succinate plus 1 μm rotenone and were used at a concentration of 0.25 mg of mitochondrial protein/ml. Changes to mitochondrial membrane potential (ΔΨm) were estimated by measuring changes in the fluorescence intensity of tetramethylrhodamine methyl ester (TMRM) (60 nm) (Invitrogen) at excitation and emission wavelengths of 543 and 590 nm, respectively. Mitochondrial Ca2+ flux was measured as change in extramitochondrial Ca2+ concentration, measured by fluorescence of CaGreen-5N (125 nm) (Invitrogen) at excitation and emission wavelengths of 482 and 535 nm, respectively. The redox state of pyridine nucleotides in the mitochondrial suspension was followed by monitoring NAD(P)H autofluorescence at excitation and emission wavelengths of 350 and 450 nm, respectively. Mitochondrial swelling was measured by light scattering at a wavelength of 587 nm. Mitochondria were challenged by single Ca2+ additions of 20–40 nmol Ca2+/mg mitochondrial protein. Mitochondrial Ca2+ retention time (CRT) was defined as the time between the Ca2+ addition and the plateau in CaGreen-5N fluorescence. To induce maximal swelling, the nonspecific pore-forming agent alamethicin was added to a final concentration of 2.5 μm at the conclusion of each run.
Measurements of Ca2+ retention capacity (CRC) in isolated brain mitochondria in the presence or absence of αSyn were achieved by incubating mitochondria in buffer containing 100 mm sucrose, 75 mm KCl, 10 mm HEPES, pH 7.4, 3 μm EDTA, 2 mm KH2PO4, 150 μm ATP, 150 μm MgCl2. Mitochondrial parameters were measured as mentioned above for liver mitochondria. Mitochondria were challenged with multiple Ca2+ additions of 10 nmol Ca2+/mg mitochondrial protein. CRC was defined as the maximum amount of Ca2+ that could be completely buffered by mitochondria as measured by the return to baseline fluorescence. Fluorimeter data were analyzed using Origin version 8.0 (OriginLab) software. The specific conditions of each experiment (i.e. substrates, inhibitors, concentration of Ca2+ or other mitochondrial permeability transition pore (mPTP) inducers, and αSyn species) are noted throughout. CRT and CRC were normalized to vehicle control.
Measurement of Hydrogen Peroxide (H2O2) Production
H2O2 production in brain mitochondria was detected by fluorescence of the oxidized Amplex Red (Invitrogen) product using excitation and emission wavelengths of 550 and 585 nm, respectively (43). The assay buffer contained 75 mm KCl, 100 mm sucrose, 10 mm K+-HEPES, 3 μm EDTA, 2 mm KH2PO4, 150 μm ATP, 150 μm MgCl2, 1 μm Amplex Red, 5 units/ml horseradish peroxidase, 40 units/ml superoxide dismutase. Mitochondria were added to a final concentration of 0.125 mg/ml. The response of Amplex Red to H2O2 was calibrated by sequential additions of a known amount of H2O2 prepared as described (43).
Complex I Activity Assay
The activity of mitochondrial complex I was determined by measuring the rotenone-sensitive oxidation of NADH as described (44). Briefly, the decrease in autofluorescence of reduced NADH was monitored at 340 nm and at 30 °C using a SpectraMax Plus 384 spectrophotometer (Molecular Devices). 50 μg of liver mitochondria were resuspended in 70 μl of hypotonic medium B (25 mm KH2PO4, 5 mm MgCl2) and sonicated four times for 1 s each using a Sonic Dismembrator model 300 (Fisher) at power level 40 at 4 °C. The mitochondrial suspension was then added to a quartz spectrophotometric cell containing 10 mm potassium phosphate (pH 7.2), 5 mm MgCl2, 2 mm KCN (prepared fresh), 2.5 mg/ml BSA, 0.13 mm NADH, 2 μg/ml antimycin A, 65 μm coenzyme Q1, plus either a 1 μm concentration of the various αSyn species tested (monomer, fibrils, and sonicated fibrils) or an equivalent volume of vehicle. The absorbance was measured for 3 min. 5 μg/ml rotenone was then added to inhibit complex I activity, and absorbance was measured for an additional 3 min. The post-rotenone slope was subtracted from the pre-rotenone slope to determine the rotenone-sensitive oxidation rate. The rotenone-sensitive rates of oxidation in the presence of various αSyn species were normalized to vehicle-treated mitochondria for each experiment.
Assessment of Mitochondrial Cytochrome c Release
30-μl aliquots were removed from vehicle- and αSyn-treated mitochondrial suspensions used for fluorescence analysis of mitochondrial parameters (see above) at time points corresponding approximately to 25, 50, 75, and 100% swelling of vehicle-treated mitochondria. Another aliquot was removed following the addition of 2.5 μm alamethicin, which was used to induce maximal swelling and cytochrome c release. Aliquots were centrifuged for 5 min at 14,000 × g to pellet intact mitochondria. 12 μl of the supernatant were added to LDS sample buffer containing 5% β-mercaptoethanol and analyzed by SDS-PAGE/Western blot for released, soluble cytochrome c.
Assessment of Mitochondria-associated αSyn
Mitochondria were incubated as described for fluorescence measurements of mitochondrial parameters. In all cases, glutamate/malate and αSyn were added to the mitochondrial suspension. 20 μm Ca2+ or an equivalent volume of water was added 2 min after αSyn, and after an additional 5 min, 200-μl aliquots of the suspension were removed. Aliquots were spun at 8,000 × g for 10 min to pellet mitochondria, and the supernatant was removed. Mitochondrial pellets were washed four times in 50 μl of assay buffer without substrates, after which they were lysed with 50 μl of 1% Nonidet P-40 lysis buffer (50 mm Tris, pH 7.5, 150 mm NaCl, 10 mm EDTA, 1% (v/v) Nonidet P-40, complete mini-EDTA-free protease inhibitor tablet) for 25 min on ice. Lysed mitochondria were spun for 5 min at 6,000 × g, and the supernatant was collected. The supernatants of the mitochondrial suspension, washes, and lysed mitochondrial pellets were analyzed by SDS-PAGE/Western blot for αSyn. To quantify the total αSyn immunoreactivity of lysed mitochondrial pellets, densitometric analysis was performed using ImageJ (National Institutes of Health).
SDS-PAGE/Western Blotting
Samples for Western blotting were electrophoresed on NuPAGE 4–12% BisTris gels (Invitrogen) with MES-SDS running buffer. Gels were then transferred onto 0.45-μm Immobilon-P PVDF membranes (Millipore) for 60 min at 400-mA constant current at 4 °C in transfer buffer consisting of 25 mm Tris, 192 mm glycine, and 20% methanol. After transfer, membranes were blocked in 5% nonfat milk in PBS with 0.1% (v/v) Tween 20 (PBS-T) for 30 min at room temperature and then incubated in primary antibody either overnight at 4 °C or for 60 min at room temperature. Membranes were then washed three times for 5 min in PBS-T, incubated with secondary antibody, washed three more times for 5 min in PBS-T, and then developed with ECL Plus or ECL Prime (GE Healthcare) according to the manufacturer's directions.
Antibodies
2F12, an in-house generated mouse monoclonal antibody against αSyn (9), was used at 0.18 μg/ml in PBS-T plus 5% milk. The mouse monoclonal anti-cytochrome c antibody 7H8 (Santa Cruz Biotechnology, Inc.) was used at 200 ng/ml in PBS-T plus 1% milk. Horseradish peroxidase-conjugated mouse secondary antibody (GE Healthcare) was diluted 1:10,000 in PBS-T plus 1% milk.
Statistical Analysis
Data are presented as the mean ± S.D. unless otherwise specified. Comparisons across two groups were made using an unpaired t test. When three or more groups were compared, a one-way ANOVA followed by Tukey's multiple-comparison test were used. Data are considered significant at a p value of ≤0.05.
RESULTS
Prefibrillar Thioflavin T-negative αSyn Promotes Complex I-dependent, Ca2+-mediated Mitochondrial Dysfunction
To assess whether αSyn can directly compromise mitochondrial function, we prepared recombinant human αSyn for application to isolated mitochondria. To this end, we monitored the aggregation state of αSyn solutions incubated at 37 °C under nutation. Assaying αSyn at different time points in this in vitro “aging” process using the amyloid binding dye ThT produced a sigmoidal curve of ThT fluorescence (Fig. 1A). We compared unaged monomer, aged ThT-negative (ThTneg) αSyn sampled during the aggregation lag phase and ThT-positive (ThTpos) aggregates (Fig. 1A, blue, red, and green, respectively) for their ability to alter the function of mitochondria. We hypothesized that ThTneg αSyn from the aggregation lag phase would be bioactive when applied to the isolated mitochondria, because this phase is characterized by the presence of soluble oligomers (45–47) that are believed to be more toxic than ThTpos fibrils that are abundant at the end stage of aggregation.
FIGURE 1.

Prefibrillar, ThTneg αSyn sensitizes mitochondria to Ca2+-induced dysfunction in a substrate-dependent manner. A, sample aggregation time course of recombinant αSyn as measured by the fluorescence of the β-sheet-binding dye ThT. 0.6 mg/ml αSyn was aged at 37 °C under nutation, and ThT fluorescence was monitored periodically. αSyn was sampled at three different stages of aggregation for application to mitochondria. Unaged monomeric protein was obtained prior to 37 °C incubation, ThT-negative (ThTneg) aged protein was sampled from the aggregation lag phase, and ThT-positive (ThTpos) aged protein was collected at the end stage of aggregation once ThT fluorescence had plateaued. B, representative traces of basic parameters of isolated liver mitochondria simultaneously measured by a multichannel fluorimeter and recorded in the presence of 5 mm glutamate and 5 mm malate as substrates; either PBS vehicle (black traces), 1 μm monomeric αSyn (blue traces), or 1 μm ThTneg αSyn (red traces); and a single 20 μm Ca2+ addition. Mitochondrial membrane potential (ΔΨm) was measured as changes in TMRM fluorescence. Higher fluorescence intensity corresponds to depolarized mitochondria. Ca2+ concentration in the mitochondrial suspension was measured as Ca-Green 5N fluorescence signal. The redox status of pyridine nucleotides was measured by NAD(P)H autofluorescence. Lower intensity corresponds to a more oxidized state of NAD(P)H. Mitochondrial swelling was measured by the change in light scattering of the mitochondrial suspension. A decrease in scattering indicates a dilution of mitochondrial solutes due to swelling. Spikes result from the additions of Ca2+, αSyn, or vehicle and alamethicin (Ala), which was used at the conclusion of the measurement to induce maximal swelling. C, quantification of the ability of aged, ThTneg but not monomeric αSyn to reduce the mitochondrial retention time of 20 μm Ca2+ under complex I (glutamate and malate as substrates) but not complex II conditions (succinate as a substrate plus rotenone to inhibit complex I). CRT was defined as time from Ca2+ addition to the ultimate plateau of Ca-Green 5N fluorescence. Error bars, S.D. from at least five independent experiments. *, p < 0.05, ANOVA followed by Tukey's multiple-comparison test. D, the relative CRT of ThTpos αSyn taken from the end-stage plateau of fluorescence was compared with vehicle control. Error bars, S.D. of four independent experiments.
Mitochondrial stress was modeled by exposing isolated mitochondria to a single bolus of Ca2+ to induce eventual membrane permeabilization associated with a collapse of ΔΨm, release of endogenous and exogenously administered Ca2+, oxidation of pyridine nucleotides, and mitochondrial swelling. We used a fluorimeter-based assay to simultaneously measure these four parameters (ΔΨm, Ca2+ uptake/release, redox state of NAD(P)H, and swelling) in isolated mouse liver mitochondria. Fig. 1B shows a representative record of these four mitochondrial parameters for mitochondria respiring with the complex I substrates glutamate and malate (complex I conditions) and exposed to a single Ca2+ addition in the absence (black traces) or the presence of 1 μm monomeric (blue traces) or aged, ThTneg αSyn (red traces). The addition of mitochondria into the incubation buffer, as indicated by the labeled arrow, induced the sharp decline of the TMRM signal (i.e. TMRM concentration in the buffer) due to the accumulation and quenching of the dye by polarized mitochondria. The addition of Ca2+ at 180 s induced a transient depolarization (and therefore increase of TMRM signal) as well as a spike in extramitochondrial Ca2+ concentration before rapid uptake into mitochondria. Alamethicin, a nonspecific pore-forming agent, was added as a positive control to observe maximal mitochondrial swelling at the end of these measurements (note the rapid reduction in absorbance at 587 nm). Unaged, monomeric αSyn had no effect on mitochondrial CRT, whereas 1 μm ThTneg αSyn significantly reduced mitochondrial CRT by 27% versus control (Fig. 1C). αSyn sampled from the end-stage plateau of aggregation (ThTpos) failed to reduce mitochondrial CRT (Fig. 1D). Taken together, these data suggest that partially aged ThTneg αSyn, but not monomeric or highly aggregated ThTpos αSyn, sensitizes mitochondria to Ca2+-mediated mitochondrial dysfunction.
Because the level of mitochondria-localized αSyn has been inversely correlated with complex I activity in the substantia nigra of PD patients (27), we investigated whether the effect of prefibrillar αSyn was restricted to complex I conditions. Therefore, instead of the complex I substrates glutamate and malate, we added the complex II substrate succinate and complex I inhibitor rotenone (complex II conditions). Interestingly, under complex II conditions, neither ThTneg nor monomeric αSyn significantly affected CRT (Fig. 1C) or the other mitochondrial parameters tested (data not shown). This result suggests that the ability of aged ThTneg αSyn to sensitize mitochondria to Ca2+ is specifically dependent on electron flow through complex I and also serves as an important specificity control for our analytical method.
Duration of the Aggregation Lag Phase Is Variable
The data presented in Fig. 1 highlight the fact that obtaining bioactive αSyn is critically dependent on predicting the timing of the aggregation lag phase and “catching” αSyn at the optimal oligomerization state. Although the effects of aged, ThTneg αSyn occurred consistently, the duration of the aggregation lag phase leading to activity varied considerably and was thus difficult to predict a priori. Five examples of αSyn incubated under identical conditions on different days are displayed in Fig. 2. In some cases, the lag phase extended over several days, whereas in others, the samples already contained ThT-binding species at early time points after the start of incubation (Fig. 2, note the broken abscissa). The kinetics of αSyn aggregation are known to be altered by many factors, including pH, temperature, sample volume, degree of agitation, protein concentration, and the presence of even a small amount of oligomeric “seeds.” We therefore sought a more reproducible way of generating bioactive oligomers.
FIGURE 2.
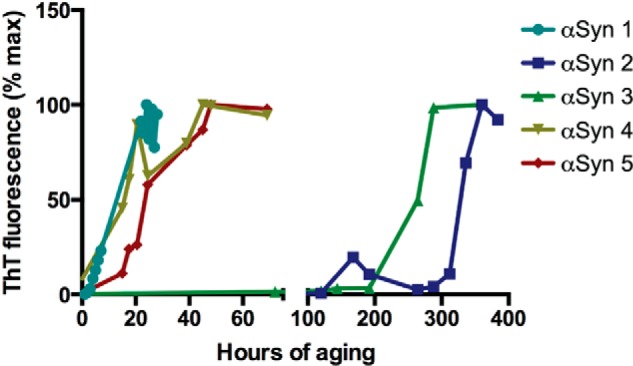
Variation in αSyn aggregation kinetics. Aggregation states of five different 0.6 mg/ml αSyn samples incubated on different days under nutation at 37 °C were monitored over time by ThT fluorescence. Note the broken abscissa and variation in duration of the aggregation lag phase prior to ThT positivity. Raw fluorescence values were normalized to the maximal fluorescence signal for each sample. Error bars were omitted to highlight differences among rather than within samples.
Characterization of αSyn Fibrils before and after Sonication
Sonicated αSyn fibrils have recently been used to seed the aggregation of endogenous αSyn in cells and mice (48, 49). Because mature αSyn fibrils can be prepared easily and reproducibly, we asked whether the mechanical disruption of fibrils into small species can produce oligomers that are functionally similar to the prefibrillar oligomers present during the aggregation lag phase (above). We first generated recombinant human αSyn fibrils (see “Experimental Procedures”) and characterized them by several techniques before and after sonication. Electron microscopy of non-sonicated fibrils revealed long, relatively uniform fibers hundreds of nm in length with diameters between 10 and 15 nm (Fig. 3A). In contrast, sonicated fibril samples were more heterogeneous and included short fibril fragments as well as spherical αSyn aggregates (Fig. 3B). Dynamic light scattering analysis revealed the average hydrodynamic radius of non-sonicated fibrils and sonicated fibrils to differ markedly at ∼950.5 and ∼40.0 nm, respectively (Fig. 3C, note the log scale). We examined the ensemble aggregation state of sonicated αSyn by incubating samples with the β-sheet-binding dye ThT. Sonicated αSyn was only 10% as fluorescent as non-sonicated fibrils (Fig. 3D), illustrating a very substantial loss of β-sheet content. Despite this decrease in β-sheet content, we observed that sonicated αSyn fibrils were able to seed the aggregation of monomeric αSyn (Fig. 3E), confirming that they still contained species that can serve as a template for further aggregation.
FIGURE 3.

Characterization of sonicated and non-sonicated αSyn fibrils. A and B, representative electron micrographs of αSyn aggregated at 2 mg/ml for 5 days under nutation before (A) and after (B) sonication. Sonicated fibrils contained a heterogeneous mixture of species including spherical oligomers and short fibril fragments. Scale bars, 100 nm. C, hydrodynamic radii (Rh) of fibrils and sonicated fibrils as measured by dynamic light scattering. Error bars, S.E. of three and seven replicates for fibrils and sonicated fibrils, respectively. D, background-subtracted fluorescence values of 2.5 μm (based on starting monomer concentration) fibrillar and sonicated αSyn fibrils in the presence of 10 μm ThT expressed as a percentage of signal obtained for fibrillar αSyn. Sonicated fibrils fluoresced with ∼10% of the intensity of fibrils. Error bars, S.D. of three independent experiments. E, an example aggregation time course of 7 μm monomeric αSyn seeded with 1 mol % of fibrillar, sonicated, or additional monomeric αSyn is shown. Sonicated and non-sonicated fibrils accelerated the aggregation of monomeric αSyn compared with additional monomeric αSyn. In this experiment, monomer-seeded αSyn was observed to acquire ThT positivity after 40 h of aging. 100,000 AFU represents the upper limit of detection of our instrument. Error bars, S.D. of 3–4 replicates. Similar data were obtained in three other independent experiments.
Sonicated αSyn Fibrils Recapitulate the Mitochondrial Effects of Prefibrillar ThTneg αSyn
We compared sonicated and non-sonicated fibrils for their ability to alter the biochemical function of mitochondria. Under complex I conditions, sonicated αSyn reduced mitochondrial CRT in a dose-dependent manner, with the 1 and 2 μm doses causing significant 14 and 21% reductions, respectively (Fig. 4, A and B). This CRT reduction was again associated with commensurate acceleration in membrane depolarization, oxidation of endogenous pyridine nucleotides, and swelling of the mitochondria (Fig. 4A). In contrast to the sonicated material and in agreement with the ThTpos samples described above (Fig. 1D), non-sonicated αSyn fibrils did not significantly alter CRT (Fig. 4C) or the three other mitochondrial parameters we measured (data not shown). Under complex II conditions, neither 1 nor 2 μm sonicated αSyn led to a reduction in CRT or accelerated depolarization when incubated with mitochondria (Fig. 4, D and E). Together, these data confirm that relatively small oligomeric αSyn species, but not ThTpos fibrillar αSyn, promotes Ca2+-induced mitochondrial dysfunction specifically under complex I conditions.
FIGURE 4.

Sonicated αSyn fibrils promote Ca2+-mediated mitochondrial dysfunction in a substrate-dependent manner. A, representative traces of basic parameters of isolated liver mitochondria (ΔΨm, extramitochondrial Ca2+ fluorescence, NAD(P)H autofluorescence, and mitochondrial swelling) simultaneously measured by a multichannel fluorimeter and recorded in the presence of a single 20 μm Ca2+ addition, 5 mm glutamate and 5 mm malate as substrates, and either PBS vehicle (black traces) or 1 μm (red traces) or 2 μm (pink traces) sonicated αSyn fibrils. Spikes at 60 s result from the addition of mitochondria; arrows are used to indicate the time of the Ca2+ addition. B, the CRT of mitochondria treated with 1 and 2 μm sonicated αSyn fibrils under complex I conditions (glutamate/malate-dependent respiration) were normalized to vehicle-treated mitochondria. Sonicated αSyn dose-dependently reduced CRT under these conditions. Error bars, S.D. from at least nine independent experiments. *, p < 0.05, ANOVA followed by Tukey's multiple-comparison test. C, the relative CRT of isolated mitochondria respiring under complex I conditions and treated with non-sonicated αSyn fibrils was determined. Error bars, S.D. from five independent experiments. D, representative traces of ΔΨm (left) and extramitochondrial Ca2+ fluorescence (right) of mitochondria treated with a single aliquot of Ca2+ in the presence of succinate/rotenone (complex II-dependent respiration) and either vehicle (black traces) or 2 μm sonicated αSyn fibrils (pink traces). E, the CRT of mitochondria respiring under complex II conditions (succinate/rotenone-dependent respiration) and treated with 1 and 2 μm sonicated αSyn was compared with vehicle-treated mitochondria under identical conditions. Error bars, S.D. from at least four independent experiments.
In general, the reduction of CRT by sonicated αSyn (1 μm) under complex I conditions was highly reproducible, but in 4 of 23 samples tested, no effect of the αSyn preparation could be detected. In the detailed characterization of the effects of αSyn on mitochondria that follows, we analyzed data from all of those sonicated preparations that were found to be bioactive (i.e. 19 of 23).
Bioactivity of Sonicated αSyn Is Contained within a 100,000 × g Supernatant
We sought to further define the bioactive component of the sonicated αSyn fibril preparation. Analysis of the CRT reduction capability of the 16,000 × g supernatant revealed that it contained equivalent bioactivity compared with the total sonicated material (data not shown). To determine whether the active component was retained in a high speed supernatant, we fractionated the total sonicated material via ultracentrifugation at 100,000 × g. Electron microscopy of the 100,000 × g-soluble and -insoluble fractions showed a nearly complete separation of small, rounded particles and longer amyloid fibril fragments into the supernatant and pellet, respectively (Fig. 5, A and B). Further analysis using dynamic light scattering revealed that the 100,000 × g supernatant contained oligomers with a mean hydrodynamic radius of 20.3 nm compared with monomeric αSyn and the 100,000 × g pellet, which had mean hydrodynamic radii of 3.8 and 42.8 nm, respectively (Fig. 5C). Moreover, the 100,000 × g supernatant was able to seed the aggregation of monomeric αSyn much faster than did additional monomer (Fig. 5D), suggesting that it contains misfolded species that can promote the conversion of unfolded protein into β-sheet-rich aggregates. Importantly, when applied to mitochondria, the 100,000 × g supernatant significantly reduced CRT to a degree equivalent to the total sonicated sample, whereas the volume-normalized pellet failed to reduce CRT (Fig. 5E). Although the pellet contained considerably less material than the supernatant as determined by total protein assays, subsequent experiments showed that the protein in the pellet had no capability to decrease CRT when protein normalized (data not shown). Together, these data demonstrate that sonication of αSyn fibrils produces entirely soluble (non-pelletable) oligomers that can disrupt mitochondrial Ca2+ homeostasis, whereas larger αSyn species that pellet under these conditions (intact fibrils and larger fragments thereof) have no significant effect on mitochondrial function.
FIGURE 5.

100,000 × g soluble fraction of sonicated αSyn fibrils contains bioactive oligomers. A and B, representative electron micrographs of sonicated αSyn fibrils fractionated into a 100,000 × g supernatant (A) and pellet (B). Large fibril fragments pellet at this speed, whereas smaller, rounded oligomers remain soluble. Scale bars, 100 nm. C, comparison of the hydrodynamic radii (Rh) of αSyn monomer and the 100,000 × g supernatant and pellet of sonicated αSyn fibrils as measured by dynamic light scattering. Error bars, S.E. of 3, 5, and 3 replicates for fibrils, 100,000 × g supernatant, and 100,000 × g pellet, respectively. D, soluble oligomers present in the 100,000 × g supernatant can seed the aggregation of monomeric αSyn. Monomeric αSyn at 20 μm was seeded with 1 mol % of additional monomeric αSyn or the 100,000 × g supernatant of sonicated fibrils. An aggregation time course representative of three independent experiments is shown. Error bars, S.D. of 3–4 replicates. E, CRT reductions upon treatment with the 100,000 × g supernatant and pellet of the total sonicated material were compared. Data are represented as the percentage of CRT reduction compared with total sonicated material from the same αSyn preparation. Error bars, S.D. from three independent experiments. *, p < 0.05 using student's t test.
Sonicated Fibrils Promote Ca2+-mediated Mitochondrial Dysfunction and Associated Cytochrome c Release via Permeability Transition Pore Induction
There is mounting evidence that under pathophysiological conditions within a cell, the exposure of mitochondria to elevated cytosolic Ca2+ can result in mitochondrial damage via a permeability transition mechanism (50–52). The induction of opening of the mPTP is associated with membrane depolarization and release of intramitochondrial Ca2+. These changes are followed closely by the rupture of the outer mitochondrial membrane and subsequent release of cytochrome c, which in an intact cell could lead to the downstream initiation of apoptosis (53).
To ascertain whether the opening of the mPTP was responsible for the αSyn-induced and Ca2+-mediated changes in mitochondrial parameters documented above, we examined the effect of the specific mPTP inhibitor cyclosporin A (CsA). As expected, preincubation of the mitochondria with 1 μm CsA prevented the CRT reduction by sonicated αSyn fibrils (Fig. 6A, left, purple trace) and the associated decrease in the time to complete mitochondrial swelling (Fig. 6A, right, purple trace). We next determined whether the earlier onsets of mitochondrial Ca2+ release and swelling caused by incubation with sonicated αSyn oligomers were accompanied by premature cytochrome c release. We removed aliquots of the vehicle- and αSyn-treated mitochondrial suspensions at time points corresponding to ∼25, 50, 75, and 100% swelling of vehicle-treated mitochondria. Another aliquot was removed following the addition of alamethicin, which was used to induce maximal swelling and cytochrome c release. Western blots of the supernatants from all of these aliquots indicated that the detection of released cytochrome c correlated with the degree of swelling (change in light scattering) in the mitochondrial suspension as a whole (Fig. 6B). Importantly, CsA preincubation also prevented αSyn-induced cytochrome c release (Fig. 6B), suggesting that, in our system, this swelling occurs as a consequence of mPTP opening rather than via direct membrane permeabilization by αSyn oligomers.
FIGURE 6.
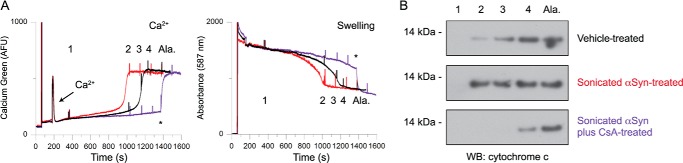
αSyn-induced changes in Ca2+ flux and swelling are due to mPTP activity and are accompanied by cytochrome c release. A, comparison of extramitochondrial Ca2+ fluorescence (left) and swelling (right) of mitochondria incubated with vehicle control (black), 1 μm sonicated αSyn fibrils (red), and 1 μm sonicated fibrils plus 1 μm CsA (purple). All experiments were conducted with the addition of 20 μm Ca2+ under complex I conditions. 30-μl aliquots were removed at the indicated times (1–4 and Ala) and were further processed for analysis in B. The addition of alamethicin is indicated by asterisks. Traces are representative of four independent experiments. B, aliquots removed from the mitochondrial suspensions at times noted in A were centrifuged at 14,000 × g for 5 min. The supernatants were run on SDS-PAGE, Western blotted, and probed with an antibody against cytochrome c to detect cytochrome c released from damaged mitochondria. Western blots are representative of four independent experiments.
We then used electron microscopy to confirm the protective effects of CsA on αSyn-induced swelling. Mitochondria at baseline (before the Ca2+ addition) appeared dark with electron-dense, compact cristae (Fig. 7A). Electron micrographs of vehicle- and αSyn-treated mitochondria samples fixed after complete reduction in absorbance (as determined by the fluorimeter) showed similar evidence of swelling (Fig. 7, B and C). We observed a qualitative lightening of the mitochondria caused by a loss of solutes as well as an increase in mitochondrial diameter. After swelling, the average diameters of αSyn- and vehicle-treated mitochondria were significantly larger than samples obtained at baseline but were not different from each other (Fig. 7E). Microscopy confirmed that preincubation of mitochondria with CsA prevented the loss of solutes and membrane swelling associated with permeability transition (Fig. 7D). In the presence of CsA, the average diameter of αSyn-treated mitochondria was not significantly different from mitochondria at baseline, suggesting that, in our system, αSyn-induced changes to mitochondrial diameter are dependent on the mPTP opening rather than direct, gross perturbation of mitochondrial membranes (Fig. 7E).
FIGURE 7.

Electron microscopy confirms that CsA prevents αSyn-induced changes in mitochondrial swelling. A–D, electron micrographs of fixed and sectioned mitochondrial pellets sampled from different stages of the fluorimetric Ca2+ retention assay. A, mitochondria at baseline (prior to the Ca2+ addition). B, vehicle-treated mitochondria fixed after complete Ca2+-induced swelling as measured by plateau in absorbance at 587 nm. C, sonicated αSyn-treated mitochondria collected and fixed following complete Ca2+-induced swelling. D, CsA-pretreated mitochondria incubated with sonicated αSyn, treated with Ca2+, and fixed at the same time point as in C. Scale bars, 500 nm. E, mean mitochondrial diameter from the sample categories depicted in A–D. Error bars, S.D. from three independent experiments. *, p < 0.05, ANOVA followed by Tukey's multiple-comparison test. ns, not significant.
Activity of Sonicated αSyn Is Dependent on Exogenous Ca2+ Uptake
Thus far, we had only investigated whether αSyn can alter mitochondrial function in the presence of exogenously added Ca2+. We therefore asked whether the ability of sonicated αSyn to alter mitochondrial function under complex I conditions was dependent on added Ca2+. For this purpose, we incubated the isolated mitochondria with sonicated αSyn but without the addition of exogenous Ca2+. No changes in all four measured mitochondrial parameters (ΔΨm, Ca2+ flux, NAD(P)H oxidation state, and swelling) were detected for incubation times up to 1 h (Fig. 8A). To confirm that effects of sonicated αSyn are mediated by exogenous Ca2+, we asked whether sonicated αSyn fibrils sensitized mitochondria to a non-Ca2+ inducer of mPTP opening, the bifunctional hydrophobic thiol-cross linking agent phenylarsine oxide (54). As in the absence of exogenous Ca2+, we observed no sensitizing effect of αSyn in the presence of 1 or 10 μm phenylarsine oxide (PhAsO; Fig. 8B), suggesting that prefibrillar αSyn does not sensitize to all subtoxic stressors.
FIGURE 8.

αSyn does not affect mitochondrial parameters in the absence of exogenous Ca2+. A, comparison of mitochondrial suspensions incubated with vehicle control (black) or 1 μm sonicated αSyn fibrils (red) under complex I conditions in the absence of exogenous Ca2+. The addition of sonicated αSyn resulted in no alteration of steady state ΔΨm, Ca2+ flux, oxidation state of pyridine nucleotides, or membrane swelling. Alamethicin (Ala) was added to induce complete swelling after 1 h. Arrows, the addition of mitochondria. Traces are representative of four independent experiments. B and C, representative swelling traces of mitochondria incubated with either vehicle (black) or 2 μm sonicated fibrils (red) under complex I conditions and treated with 1 μm (B) or 10 μm (C) phenylarsine oxide (PhAsO). αSyn incubation did not sensitize mitochondria to undergo mPTP-related swelling in the presence of phenylarsine oxide.
We then specifically tested whether Ca2+ uptake into mitochondria, rather than simply its presence in the mitochondrial suspension, was required to observe αSyn-induced changes to mitochondrial parameters. Preincubation with the specific inhibitor of the mitochondrial Ca2+ uniporter Ru360 (10 μm) was sufficient to completely block uptake of exogenous Ca2+ (Fig. 9A, compare bottom and top panels) and prevent the mPTP-inducing effects of sonicated αSyn, as exemplified by the swelling traces shown in Fig. 9B. We observed no reduction in absorbance over time, indicating that αSyn did not promote mitochondrial swelling in the presence of Ru360 (compare top and bottom panels of Fig. 9B). To determine whether exogenous Ca2+ enhanced the physical association of αSyn with mitochondria, we incubated mitochondria with sonicated αSyn in the presence or absence of 20 μm Ca2+, ran the lysate of extensively washed mitochondrial pellets on SDS-PAGE, and blotted for αSyn. We observed no differences in the intensity or pattern of αSyn immunoreactivity in the lysed mitochondrial pellet (Fig. 9, C (lanes L) and D). This indicates that, whereas Ca2+ uptake is necessary for the downstream functional consequences of the αSyn/mitochondria association (i.e. CRT reduction and sensitization to mPTP opening), the association itself is not regulated by Ca2+ under our conditions. These data suggest that the addition of Ca2+ and the concomitant metabolic changes that accompany its uptake into mitochondria make the mitochondria vulnerable to the effects of bound αSyn.
FIGURE 9.

Mitochondrial Ca2+ cycling is necessary for αSyn-induced mPTP induction but not binding. A, extramitochondrial Ca2+ (as determined by Ca-Green 5N fluorescence) of mitochondrial suspensions incubated with vehicle control (black) or sonicated αSyn fibrils (red) and challenged with 20 μm Ca2+ in the absence (top) or presence of 10 μm Ru360, an inhibitor of the mitochondrial Ca2+ uniporter (bottom). Note that Ru360 prevents uptake of exogenous Ca2+. Traces are representative of four independent experiments. B, measurements of mitochondrial swelling (as determined by the decrease in absorbance at 587 nm) obtained from incubations of the same αSyn and mitochondrial preparations shown in A. 20 μm Ca2+ was added to mitochondrial suspensions in the absence (top) or presence of 10 μm Ru360 (bottom). In this example, the initial absorbance of the αSyn-treated mitochondrial suspension is somewhat lower than that of the vehicle-treated suspension (due to small differences in the total mitochondrial protein present); however, in neither case is there a reduction in absorbance over time, indicating that there is no Ca2+-induced swelling in the presence of Ru360. Traces are representative of four independent experiments. C, SDS-PAGE/Western blot of the supernatant (S), washed pellets (W1–W4), and lysed pellets (L) of mitochondrial suspensions after brief incubation with sonicated αSyn in the presence or absence of 20 μm Ca2+. Membranes were probed for αSyn (top) and cytochrome c (bottom). The majority of the incubated αSyn remains in the supernatant, but a fraction resists four washes in assay buffer and is specifically associated with the mitochondrial pellet. As expected, cytochrome c is only detectable in the lysed mitochondrial pellets, suggesting that mitochondria remain intact after these washes. Blots are representative of four independent experiments. D, quantification of total αSyn immunoreactivity of lysed mitochondrial pellets after incubation with sonicated αSyn in the presence or absence of Ca2+ and after extensive washing. Total lane immunoreactivity was normalized to samples in which 20 μm Ca2+ was added to the αSyn/mitochondria suspension. Error bars, S.D. of four independent experiments.
Sonicated αSyn Impairs Complex I Activity
We have shown that sonicated αSyn fibril fragments impair complex I-dependent mitochondrial function. One potential explanation for this is that αSyn interferes with proper electron transport at complex I. To test this, we measured the enzymatic activity of complex I directly using the autofluorescence of its substrate NADH. This assay is independent of substrate availability or the activity of other respiratory complexes that factor into our Ca2+ retention assays. We observed that sonicated αSyn, but not monomeric or fibrillar αSyn, significantly reduced the rate of rotenone-sensitive NADH oxidation (measured by loss of autofluorescence at 340 nm) of the isolated liver mitochondria used in our other experiments (Fig 10, A and B). These data support the notion that impaired complex I activity contributes to the reduction in Ca2+ retention caused by sonicated αSyn under complex I conditions.
FIGURE 10.
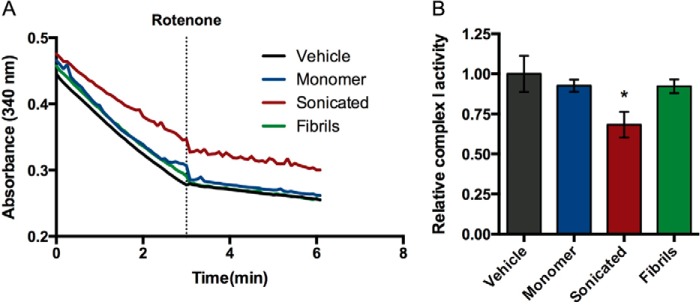
Sonicated αSyn can inhibit complex I activity. A, mechanically disrupted mitochondria were incubated with vehicle (black), monomeric αSyn (blue), sonicated αSyn fibrils (red), or intact fibrils (green), and the oxidation of supplied NADH was monitored by the absorbance at 340 nm before and after the addition of rotenone (indicated by the dashed line). The post-rotenone absorbance slope was subtracted from the pre-rotenone slope to obtain the rotenone-sensitive activity. B, rotenone-sensitive complex I activity in mitochondria incubated with various αSyn forms was normalized to vehicle-treated mitochondria. Error bars, S.D. of three independent experiments. *, p < 0.05 when compared with all other groups, ANOVA followed by Tukey's multiple comparisons test.
Based on this ability of sonicated αSyn to reduce complex I activity, we tested whether αSyn-induced reduction in Ca2+ retention was associated with increased production of reactive oxygen species (ROS). High activity of catalase in liver mitochondrial preparations (55) makes it difficult to detect H2O2 in this system. Catalase is generally less abundant in isolated brain mitochondria. Thus, we chose to examine ROS production by isolated brain mitochondria in the presence of Ca2+ plus either vehicle or sonicated αSyn. We first confirmed that sonicated αSyn does indeed reduce Ca2+ retention of brain mitochondria under complex I conditions. Because of the limited ability of brain-derived mitochondria to undergo swelling (56), we quantified the CRC, a widely used measure of a permeability transition-like event (40, 57), rather than CRT. In this assay, additional Ca2+ aliquots are needed to promote permeability transition at the population level. Sonicated αSyn reduced the CRC of brain mitochondria by ∼22% under complex I conditions (Fig. 11, A and B), thus reproducing our key finding from liver mitochondria. We were able to simultaneously measure ROS production by adding Amplex Red to the assay buffer. However, despite their consistent ability to reduce CRC, sonicated αSyn oligomers did not increase the rate of H2O2 production in this system (Fig. 11, C and D), suggesting either that incubation of mitochondria with prefibrillar αSyn in the presence of Ca2+ does not increase ROS or that any increased ROS production induced by prefibrillar αSyn could not be detected under our experimental conditions.
FIGURE 11.

Sonicated αSyn reduces the Ca2+ retention of brain mitochondria without measureable enhancement of ROS production. A, representative traces of the Ca-Green 5N fluorescence of vehicle-treated (black) and 2 μm sonicated αSyn-treated brain mitochondria (red) under complex I conditions. αSyn-treated mitochondria were able to buffer fewer Ca2+ additions to the solution. B, quantification of the relative CRC of vehicle- and sonicated αSyn-treated mitochondria. Error bars, S.D. from eight independent experiments. *, p < 0.05 using Student's t test. C, ROS production from vehicle-treated (black) and sonicated αSyn-treated (red) mitochondria (left) was measured using the dye Amplex Red concurrently with CRC (right). D, the mean slopes of the increase in Amplex Red fluorescence during Ca2+ accumulation were quantified. Despite its ability to reduce CRC, sonicated αSyn did not lead to a significant increase in ROS production in this system. Error bars, S.D. of five independent experiments.
DISCUSSION
Evidence from many laboratories makes it increasingly clear that mitochondria are a principal target for aberrant accumulation of αSyn within the cell (27, 29–32, 36, 37, 58, 59). However, few studies have investigated the effects of different assembly forms of αSyn directly on the function of mitochondria. Here, we used a reductionist model system comprising isolated liver and brain mitochondria and different, well characterized forms of pure human αSyn to discover that highly soluble, prefibrillar αSyn oligomers, but not monomers or ThTpos fibrils, impair mitochondrial function. Further, we show that the toxicity of oligomeric αSyn is specifically dependent on both mitochondrial uptake of exogenous Ca2+ and electron flow through complex I.
The literature is replete with protocols for preparing αSyn oligomers (e.g. by incubation with supraphysiological levels of metal ions, lipids, detergents, or oxidizing agents) that are either not further characterized or vary in their morphological, biochemical, and/or functional characteristics (12, 60–65). In this study, we report highly complementary results using two independent methods for generating soluble prefibrillar αSyn oligomers in the absence of any additives: sonication of fully formed amyloid fibrils (sonicated preparation) and collection of oligomers during the lag phase of initial aggregation (lag phase preparation). Although oligomers obtained with the sonicated preparation are formed by the sonication of fibrils and could therefore be considered “postfibrillar,” they are capable of seeding the aggregation of monomeric protein into ThTpos fibrils. Thus, for simplicity and to distinguish them from physiological, aggregation-resistant helical oligomers (7, 9), we refer herein to oligomers from the sonicated and lag phase preps as “prefibrillar oligomers.” Both of these preparations produce closely similar effects on mitochondrial function, which argues against the likelihood of artifactual effects caused by a specific preparation of oligomers. Under the specific conditions discussed further below, αSyn generated using either of our protocols recapitulated several mitochondrial phenotypes previously reported in animal and cell models of PD, namely complex I-mediated dysfunction, altered ΔΨm, disrupted Ca2+ homeostasis, and enhanced cytochrome c release. Our development of simple protocols to generate and enrich for pathologically relevant oligomeric αSyn provides an approach for more efficiently studying αSyn cytotoxicity, including further investigations into the mechanisms of mitochondrial dysfunction.
Collectively, our data indicate that highly soluble prefibrillar oligomers, rather than larger, 100,000 × g-pelletable assemblies or fibril fragments, can disrupt proper mitochondrial function. ThT assays suggest that our bioactive material is not β-sheet-rich; however, we cannot exclude the possibility that a small percentage of β-sheet-containing oligomers that do not avidly bind ThT contribute to our observed effects, especially in light of a propensity of the active material to act as a template for the formation of β-sheet-containing amyloid fibrils. Our results provide a potential subcellular target of prefibrillar αSyn oligomers recently reported to be cytotoxic in cellular and animal models. Karpinar et al. (14) reported greater oligomerization propensity but reduced fibrilization and β-sheet content of recombinant αSyn engineered to contain various proline substitutions. Overexpression of these mutants in rat primary neurons, Caenorhabditis elegans, and Drosophila was associated with neurotoxicity that was inversely proportional to the β-sheet content of in vitro oligomers of the same αSyn proteins (14), but mitochondrial dysfunction was not specifically addressed. Recent work by Winner et al. (13) is also in line with our findings; αSyn mutants that preferentially form β-sheet-poor oligomers rather than β-sheet-rich fibrils in vitro were associated with more neurotoxicity in lentivirus-infected human mesencephalic cells and rat brain. Moreover, interaction of these oligomers with cellular membranes was suggested as a potential mediator of toxicity (13), but again mitotoxicity was not examined. Our sonicated preparation was modeled in part after the sonicated preformed fibrils used by Lee and colleagues (48, 49), who demonstrated the internalization of extraneuronally applied sonicated fibrils and their ability to promote the aggregation of endogenous αSyn. To date, the colocalization, if any, of the seeded protein with mitochondria and the possible functional consequences for these organelles have not been assessed, but in light of our findings, they should be.
Prefibrillar αSyn represents a heterogeneous pool of transient oligomeric species on their way to highly ordered, β-sheet aggregates analogous to those comprising the fibrils in Lewy bodies and Lewy neurites (11, 60). Thus, our results are in agreement with the concept of Lewy pathology as a relatively protective mechanism, at least temporarily (66, 67). In the context of PD, our data support the pursuit of therapeutic strategies designed to stabilize native, aggregation-resistant α-helical tetramers and related oligomers in neurons (7, 9). Alternatively, one could attempt to accelerate the fibrilization process to decrease levels of potentially toxic oligomers, although it is likely that these species are in equilibrium, and the fibrils could later release smaller oligomers that could promote aggregation of monomeric protein via a secondary nucleation mechanism (47, 68).
The mitochondria of neurons of the substantia nigra pars compacta and other brain regions vulnerable to PD are subjected to high Ca2+ concentrations due to regular influx through pacemaking L-type channels and low expression of cytosolic Ca2+-buffering proteins (25, 26, 69). We therefore studied the effects of αSyn on mitochondrial function in the context of elevated Ca2+ levels. We observed that bioactive prefibrillar αSyn disrupted basic mitochondrial parameters (ΔΨm, Ca2+ uptake/release, redox state of pyridine nucleotides, and swelling) only in the presence of exogenously added Ca2+. Because Ru360 abolished this effect, we can conclude that the downstream effects of mitochondria-associated αSyn were dependent on the uptake of Ca2+ into the mitochondrial matrix. Previous reports suggest that overexpressing αSyn in cells or animals leads to alterations in mitochondrial morphology or function in the absence of overt Ca2+ stress (27, 31, 36, 37, 58, 59, 70, 71). These results could be explained by one or more of the following possibilities. First, toxic αSyn species could affect the function of other organelles, such as the endoplasmic reticulum (71), or cellular pathways leading to intracellular Ca2+ dyshomeostasis. Second, when overexpressed in cell lines or animals (versus briefly incubated with mitochondria in vitro as here), there may be greater opportunity for αSyn to exert its effects, so that mild alterations of mitochondrial function (which could be exacerbated by our acute Ca2+ challenge) can accumulate chronically. In this context, physiological Ca2+ transients in neurons could be a sufficient stress in the presence of prefibrillar, oligomeric αSyn. Furthermore, endogenous toxins, such as the monoamine oxidase-generated product of dopamine, 3,4-dihydroxyphenylacetaldehyde, have also been shown to facilitate mitochondrial permeability transition (72) and may act synergistically with pathological αSyn in dopaminergic neurons. Third, the ability of Ca2+ to exacerbate the mitochondrial effects of αSyn may not be due to Ca2+ uptake per se but rather the associated increase in ETC activity. Mitochondrial Ca2+ influx comes at the expense of ΔΨm, which must be reestablished in order to generate ATP and buffer further Ca2+ loads. One possibility is that proper ETC function may be disrupted by αSyn (see below), and the increased ETC activity needed to restore ΔΨm in response to the uptake of excess Ca2+ could increase the generation of ROS, thereby accelerating mPTP opening. However, we did not observe an elevation in ROS production in our preliminary experiments. Mitochondria targeted by prefibrillar αSyn may be less able to reestablish ΔΨm and would therefore be more susceptible to permeability transition; reduced ΔΨm is a known sensitizing factor for mPTP opening (73, 74). Our direct measurements of complex I activity, obtained under conditions of rapid electron flux, are supportive of this hypothesis. They suggest that prefibrillar αSyn can reduce the maximal enzymatic activity and impair mitochondrial function in the absence of Ca2+ if ETC activity is otherwise increased.
The protective effects of CsA on our αSyn-induced changes in mitochondrial parameters demonstrated that the addition of prefibrillar αSyn sensitized mitochondria to mPTP activation. The acceleration of cytochrome c release in αSyn-treated mitochondria was likewise rescued by preincubation with CsA. This result suggests that cytochrome c release was also regulated by the mPTP in our system rather than by channels formed via direct permeabilization of the outer membrane by oligomeric αSyn, as has been suggested (75). Although the role of mitochondrial permeability transition in PD-related cell death requires further study, two recent reports support the in vivo relevance of our data. Findings from Martin et al. (32) indicate that the genetic ablation of cyclophilin D, the mPTP modulator and target of CsA, delayed the onset of mitochondrial abnormalities and neuronal apoptosis in Thy1-αSyn A53T transgenic mice. Also, Büttner et al. (33) showed that overexpression of αSyn in yeast led to cell death and a redistribution of the proapoptotic nuclease EndoG from mitochondria to the nucleus, and these effects could both be rescued by genetic modulation of the mPTP components. αSyn-induced, EndoG-dependent cytotoxicity was also observed in C. elegans, flies, and human neuroblastoma cells. Moreover, nuclear translocalization of EndoG was preferentially detected in the brain sections of PD patients compared with age-matched controls (33). Others have recently proposed that WT αSyn binds to mitochondria-associated endoplasmic reticulum membranes rather than mitochondria themselves (76). However, the authors did see a redistribution of αSyn to “pure” mitochondria under pathological conditions, when the oligomer-promoting mutants A53T and A30P were overexpressed in both HeLa cells and mouse brain. Overexpression of these mutants was also associated with altered mitochondrial morphology (76).
Ca2+-induced mPTP opening can be broadly split into three main phases that could be accelerated by αSyn based on our new work: the “initiation phase,” during which Ca2+ is taken up into the matrix through the mitochondrial Ca2+ uniporter; the “lag phase,” during which mPTP components are recruited and assembled; and the “propagation phase,” during which mPTP induction spreads through the population (39). Inducers can affect one or more phases, and even highly related compounds can show differential effects (39, 77). Our data showing the lack of direct effect of αSyn on ΔΨm and the unimpaired initial uptake of Ca2+ both suggest that the first phase is not significantly affected by αSyn. The relatively long, stable lag phase even in the presence of prefibrillar αSyn is also consistent with a minimal effect (if any) in the initial phase. There is also no apparent shift in the slope of the final propagation phase, suggesting no significant effect on that aspect of mPTP induction. This suggests that αSyn primarily acts during the lag phase. Accordingly, the lag phase is significantly shortened in our αSyn-treated mitochondria.
Alteration of the lag phase by prefibrillar oligomers is also consistent with our observing a clear cut respiratory substrate-dependent effect. Our results show that prefibrillar αSyn oligomers sensitize mitochondria to Ca2+-induced permeability transition under complex I but not complex II conditions. In light of our findings and existing literature (27, 35, 58), the most likely explanation for these findings is that αSyn acts to inhibit complex I. It has been reported that the brain mitochondria of A53T transgenic mice show reduced complex I activity when compared with wild type (78). The degree of reduction did not correlate with age-dependent αSyn deposition in the mice or with the apparent level of SDS-resistant oligomers (78). It is possible that (a) the results were confounded by the loss of the cells in which complex I dysfunction was exacerbated by age, (b) only a small population of the total brain cells (e.g. nigral dopaminergic neurons) showed an age-dependent reduction in complex I activity, or (c) a “ceiling effect” occurred (i.e. the initial accumulation of αSyn oligomers in the brain already produced a maximal reduction of complex I function). Prefibrillar αSyn oligomers could act to inhibit complex I function either directly or indirectly via perturbations of mitochondrial membrane lipids. The well demonstrated tendency of αSyn to bind acidic phospholipids, especially cardiolipin (79), which is critical for proper electron transfer by complexes I and III (80, 81), suggests that membrane association of pathological αSyn oligomers could destabilize complex I activity. Flux through complex I would be expected to be more sensitive to this interaction/inhibition because it is more rate-limiting (82). In the context of energization with a complex I substrate, even mild inhibition could be detrimental to mitochondria depolarized by Ca2+ uptake. Restoration and maintenance of the ΔΨm, a primary defense against mPTP opening, would require increased electron flow into a compromised complex I.
Flux into and/or through an impaired complex I could also be expected to lead to initiation of a feed-forward cycle of increasing ROS generation and worsening complex I function. We did not detect elevated ROS production by prefibrillar αSyn in our system, but it is conceivable that extensive optimization of assay conditions could allow for more sensitive measurement of small changes in ROS generation.
In summary, we demonstrate for the first time a direct link between a particular form of αSyn assembly and mitochondrial dysfunction in a system that models the Ca2+ phenotype of cells affected in PD. Our data suggest that, in the context of PD, alterations in αSyn proteostasis that destabilize physiological α-helical oligomers or otherwise shift the equilibrium toward aggregation-prone monomeric αSyn may drive the generation of mitotoxic prefibrillar oligomers that contribute to complex I-dependent dysfunction and the resultant degeneration of vulnerable neuronal populations.
Acknowledgments
We thank Ulf Dettmer, Andrew Newman, and Matthew LaVoie for helpful discussions and critical reading of the manuscript and Maria Ericsson for assistance with electron microscopy.
This work was supported by the Fidelity Biosciences Research Initiative (to D. J. S.) and Parkinson's Disease Foundation Grant PDF-IRG-1204 (to T. B.).
- PD
- Parkinson disease
- αSyn
- α-synuclein
- ETC
- electron transport chain
- ThT
- thioflavin T
- TMRM
- tetramethylrhodamine methyl ester
- CRT
- Ca2+ retention time
- mPTP
- mitochondrial permeability transition pore
- ΔΨm
- mitochondrial membrane potential
- CsA
- cyclosporin A
- ROS
- reactive oxygen species
- CRC
- Ca2+ retention capacity
- ANOVA
- analysis of variance
- AFU
- arbitrary fluorescence units
- BisTris
- 2-[bis(2-hydroxyethyl)amino]-2-(hydroxymethyl)propane-1,3-diol.
REFERENCES
- 1. Spillantini M. G., Schmidt M. L., Lee V. M., Trojanowski J. Q., Jakes R., Goedert M. (1997) α-Synuclein in Lewy bodies. Nature 388, 839–840 [DOI] [PubMed] [Google Scholar]
- 2. Chartier-Harlin M.-C., Kachergus J., Roumier C., Mouroux V., Douay X., Lincoln S., Levecque C., Larvor L., Andrieux J., Hulihan M., Waucquier N., Defebvre L., Amouyel P., Farrer M., Destée A. (2004) α-Synuclein locus duplication as a cause of familial Parkinson's disease. Lancet 364, 1167–1169 [DOI] [PubMed] [Google Scholar]
- 3. Singleton A. B., Farrer M., Johnson J., Singleton A., Hague S., Kachergus J., Hulihan M., Peuralinna T., Dutra A., Nussbaum R., Lincoln S., Crawley A., Hanson M., Maraganore D., Adler C., Cookson M. R., Muenter M., Baptista M., Miller D., Blancato J., Hardy J., Gwinn-Hardy K. (2003) α-Synuclein locus triplication causes Parkinson's disease. Science 302, 841. [DOI] [PubMed] [Google Scholar]
- 4. Kara E., Lewis P. A., Ling H., Proukakis C., Houlden H., Hardy J. (2013) α-Synuclein mutations cluster around a putative protein loop. Neurosci. Lett. 546, 67–70 [DOI] [PMC free article] [PubMed] [Google Scholar]
- 5. Kim H.-J. (2013) α-Synuclein expression in patients with Parkinson disease: a clinician's perspective. Exp. Neurobiol. 22, 77–83 [DOI] [PMC free article] [PubMed] [Google Scholar]
- 6. Cullen V., Sardi S. P., Ng J., Xu Y.-H., Sun Y., Tomlinson J. J., Kolodziej P., Kahn I., Saftig P., Woulfe J., Rochet J.-C., Glicksman M. A., Cheng S. H., Grabowski G. A., Shihabuddin L. S., Schlossmacher M. G. (2011) Acid β-glucosidase mutants linked to Gaucher disease, Parkinson disease, and Lewy body dementia alter α-synuclein processing. Ann. Neurol. 69, 940–953 [DOI] [PubMed] [Google Scholar]
- 7. Bartels T., Choi J. G., Selkoe D. J. (2011) α-Synuclein occurs physiologically as a helically folded tetramer that resists aggregation. Nature 477, 107–110 [DOI] [PMC free article] [PubMed] [Google Scholar]
- 8. Wang W., Perovic I., Chittuluru J., Kaganovich A., Nguyen L. T. T., Liao J., Auclair J. R., Johnson D., Landeru A., Simorellis A. K., Ju S., Cookson M. R., Asturias F. J., Agar J. N., Webb B. N., Kang C., Ringe D., Petsko G. A., Pochapsky T. C., Hoang Q. Q. (2011) A soluble α-synuclein construct forms a dynamic tetramer. Proc. Natl. Acad. Sci. 108, 17797–17802 [DOI] [PMC free article] [PubMed] [Google Scholar]
- 9. Dettmer U., Newman A. J., Luth E. S., Bartels T., Selkoe D. (2013) In vivo cross-linking reveals principally oligomeric forms of α-synuclein and β-synuclein in neurons and non-neural cells. J. Biol. Chem. 288, 6371–6385 [DOI] [PMC free article] [PubMed] [Google Scholar]
- 10. Westphal C. H., Chandra S. S. (2013) Monomeric synucleins generate membrane curvature. J. Biol. Chem. 288, 1829–1840 [DOI] [PMC free article] [PubMed] [Google Scholar]
- 11. Conway K. A., Lee S. J., Rochet J. C., Ding T. T., Williamson R. E., Lansbury P. T. (2000) Acceleration of oligomerization, not fibrillization, is a shared property of both alpha-synuclein mutations linked to early-onset Parkinson's disease: implications for pathogenesis and therapy. Proc. Natl. Acad. Sci. U.S.A. 97, 571–576 [DOI] [PMC free article] [PubMed] [Google Scholar]
- 12. Danzer K. M., Haasen D., Karow A. R., Moussaud S., Habeck M., Giese A., Kretzschmar H., Hengerer B., Kostka M. (2007) Different species of α-synuclein oligomers induce calcium influx and seeding. J. Neurosci. 27, 9220–9232 [DOI] [PMC free article] [PubMed] [Google Scholar]
- 13. Winner B., Jappelli R., Maji S. K., Desplats P. A., Boyer L., Aigner S., Hetzer C., Loher T., Vilar M., Campioni S., Tzitzilonis C., Soragni A., Jessberger S., Mira H., Consiglio A., Pham E., Masliah E., Gage F. H., Riek R. (2011) In vivo demonstration that α-synuclein oligomers are toxic. Proc. Natl. Acad. Sci. U.S.A. 108, 4194–4199 [DOI] [PMC free article] [PubMed] [Google Scholar]
- 14. Karpinar D. P., Balija M. B. G., Kügler S., Opazo F., Rezaei-Ghaleh N., Wender N., Kim H.-Y., Taschenberger G., Falkenburger B. H., Heise H., Kumar A., Riedel D., Fichtner L., Voigt A., Braus G. H., Giller K., Becker S., Herzig A., Baldus M., Jäckle H., Eimer S., Schulz J. B., Griesinger C., Zweckstetter M. (2009) Pre-fibrillar α-synuclein variants with impaired beta-structure increase neurotoxicity in Parkinson's disease models. EMBO J. 28, 3256–3268 [DOI] [PMC free article] [PubMed] [Google Scholar]
- 15. Volles M. J., Lansbury P. T. (2003) Zeroing in on the pathogenic form of α-synuclein and its mechanism of neurotoxicity in Parkinson's disease. Biochemistry 42, 7871–7878 [DOI] [PubMed] [Google Scholar]
- 16. Langston J. W., Ballard P. A. (1983) Parkinson's disease in a chemist working with 1-methyl-4-phenyl-1,2,5,6-tetrahydropyridine. N. Engl. J. Med. 309, 310. [DOI] [PubMed] [Google Scholar]
- 17. Betarbet R., Sherer T. B., MacKenzie G., Garcia-Osuna M., Panov A. V., Greenamyre J. T. (2000) Chronic systemic pesticide exposure reproduces features of Parkinson's disease. Nat. Neurosci. 3, 1301–1306 [DOI] [PubMed] [Google Scholar]
- 18. Burns R. S., Chiueh C. C., Markey S. P., Ebert M. H., Jacobowitz D. M., Kopin I. J. (1983) A primate model of parkinsonism: selective destruction of dopaminergic neurons in the pars compacta of the substantia nigra by N-methyl-4-phenyl-1,2,3,6-tetrahydropyridine. Proc. Natl. Acad. Sci. U.S.A. 80, 4546–4550 [DOI] [PMC free article] [PubMed] [Google Scholar]
- 19. Schapira A. H., Cooper J. M., Dexter D., Jenner P., Clark J. B., Marsden C. D. (1989) Mitochondrial complex I deficiency in Parkinson's disease. Lancet 1, 1269. [DOI] [PubMed] [Google Scholar]
- 20. Janetzky B., Hauck S., Youdim M. B., Riederer P., Jellinger K., Pantucek F., Zöchling R., Boissl K. W., Reichmann H. (1994) Unaltered aconitase activity, but decreased complex I activity in substantia nigra pars compacta of patients with Parkinson's disease. Neurosci. Lett. 169, 126–128 [DOI] [PubMed] [Google Scholar]
- 21. Parker W. D., Jr., Boyson S. J., Parks J. K. (1989) Abnormalities of the electron transport chain in idiopathic Parkinson's disease. Ann. Neurol. 26, 719–723 [DOI] [PubMed] [Google Scholar]
- 22. Keeney P. M., Xie J., Capaldi R. A., Bennett J. P. (2006) Parkinson's disease brain mitochondrial complex I has oxidatively damaged subunits and is functionally impaired and misassembled. J. Neurosci. 26, 5256–5264 [DOI] [PMC free article] [PubMed] [Google Scholar]
- 23. Bender A., Krishnan K. J., Morris C. M., Taylor G. A., Reeve A. K., Perry R. H., Jaros E., Hersheson J. S., Betts J., Klopstock T., Taylor R. W., Turnbull D. M. (2006) High levels of mitochondrial DNA deletions in substantia nigra neurons in aging and Parkinson disease. Nat. Genet. 38, 515–517 [DOI] [PubMed] [Google Scholar]
- 24. Surmeier D. J., Schumacker P. T. (2013) Calcium, bioenergetics, and neuronal vulnerability in Parkinson's disease. J. Biol. Chem. 288, 10736–10741 [DOI] [PMC free article] [PubMed] [Google Scholar]
- 25. Guzman J. N., Sanchez-Padilla J., Wokosin D., Kondapalli J., Ilijic E., Schumacker P. T., Surmeier D. J. (2010) Oxidant stress evoked by pacemaking in dopaminergic neurons is attenuated by DJ-1. Nature 468, 696–700 [DOI] [PMC free article] [PubMed] [Google Scholar]
- 26. Goldberg J. A., Guzman J. N., Estep C. M., Ilijic E., Kondapalli J., Sanchez-Padilla J., Surmeier D. J. (2012) Calcium entry induces mitochondrial oxidant stress in vagal neurons at risk in Parkinson's disease. Nat. Neurosci. 15, 1414–1421 [DOI] [PMC free article] [PubMed] [Google Scholar]
- 27. Devi L., Raghavendran V., Prabhu B. M., Avadhani N. G., Anandatheerthavarada H. K. (2008) Mitochondrial import and accumulation of α-synuclein impair complex I in human dopaminergic neuronal cultures and Parkinson disease brain. J. Biol. Chem. 283, 9089–9100 [DOI] [PMC free article] [PubMed] [Google Scholar]
- 28. Rhinn H., Qiang L., Yamashita T., Rhee D., Zolin A., Vanti W., Abeliovich A. (2012) Alternative α-synuclein transcript usage as a convergent mechanism in Parkinson's disease pathology. Nat. Commun. 3, 1084. [DOI] [PMC free article] [PubMed] [Google Scholar]
- 29. Martin L. J., Pan Y., Price A. C., Sterling W., Copeland N. G., Jenkins N. A., Price D. L., Lee M. K. (2006) Parkinson's disease α-synuclein transgenic mice develop neuronal mitochondrial degeneration and cell death. J. Neurosci. 26, 41–50 [DOI] [PMC free article] [PubMed] [Google Scholar]
- 30. Stichel C. C., Zhu X.-R., Bader V., Linnartz B., Schmidt S., Lübbert H. (2007) Mono- and double-mutant mouse models of Parkinson's disease display severe mitochondrial damage. Hum. Mol. Genet. 16, 2377–2393 [DOI] [PubMed] [Google Scholar]
- 31. Hsu L. J., Sagara Y., Arroyo A., Rockenstein E., Sisk A., Mallory M., Wong J., Takenouchi T., Hashimoto M., Masliah E. (2000) α-Synuclein promotes mitochondrial deficit and oxidative stress. Am. J. Pathol. 157, 401–410 [DOI] [PMC free article] [PubMed] [Google Scholar]
- 32. Martin L. J., Semenkow S., Hanaford A., Wong M. (2014) The mitochondrial permeability transition pore regulates Parkinson's disease development in mutant α-synuclein transgenic mice. Neurobiol. Aging 35, 1132–1152 [DOI] [PMC free article] [PubMed] [Google Scholar]
- 33. Büttner S., Habernig L., Broeskamp F., Ruli D., Vögtle F. N., Vlachos M., Macchi F., Küttner V., Carmona-Gutierrez D., Eisenberg T., Ring J., Markaki M., Taskin A. A., Benke S., Ruckenstuhl C., Braun R., Van den Haute C., Bammens T., van der Perren A., Fröhlich K.-U., Winderickx J., Kroemer G., Baekelandt V., Tavernarakis N., Kovacs G. G., Dengjel J., Meisinger C., Sigrist S. J., Madeo F. (2013) Endonuclease G mediates α-synuclein cytotoxicity during Parkinson's disease. EMBO J. 32, 3041–3054 [DOI] [PMC free article] [PubMed] [Google Scholar]
- 34. Nakamura K., Nemani V. M., Azarbal F., Skibinski G., Levy J. M., Egami K., Munishkina L., Zhang J., Gardner B., Wakabayashi J., Sesaki H., Cheng Y., Finkbeiner S., Nussbaum R. L., Masliah E., Edwards R. H. (2011) Direct membrane association drives mitochondrial fission by the Parkinson disease-associated protein α-synuclein. J. Biol. Chem. 286, 20710–20726 [DOI] [PMC free article] [PubMed] [Google Scholar]
- 35. Liu G., Zhang C., Yin J., Li X., Cheng F., Li Y., Yang H., Uéda K., Chan P., Yu S. (2009) α-Synuclein is differentially expressed in mitochondria from different rat brain regions and dose-dependently down-regulates complex I activity. Neurosci. Lett. 454, 187–192 [DOI] [PubMed] [Google Scholar]
- 36. Parihar M. S., Parihar A., Fujita M., Hashimoto M., Ghafourifar P. (2008) Mitochondrial association of α-synuclein causes oxidative stress. Cell. Mol. Life Sci. 65, 1272–1284 [DOI] [PMC free article] [PubMed] [Google Scholar]
- 37. Shavali S., Brown-Borg H. M., Ebadi M., Porter J. (2008) Mitochondrial localization of α-synuclein protein in α-synuclein overexpressing cells. Neurosci. Lett. 439, 125–128 [DOI] [PMC free article] [PubMed] [Google Scholar]
- 38. Weinreb P. H., Zhen W., Poon A. W., Conway K. A., Lansbury P. T. (1996) NACP, a protein implicated in Alzheimer's disease and learning, is natively unfolded. Biochemistry 35, 13709–13715 [DOI] [PubMed] [Google Scholar]
- 39. Baranov S. V., Stavrovskaya I. G., Brown A. M., Tyryshkin A. M., Kristal B. S. (2008) Kinetic model for Ca2+-induced permeability transition in energized liver mitochondria discriminates between inhibitor mechanisms. J. Biol. Chem. 283, 665–676 [DOI] [PubMed] [Google Scholar]
- 40. Stavrovskaya I. G., Baranov S. V., Guo X., Davies S. S., Roberts L. J., 2nd, Kristal B. S. (2010) Reactive γ-ketoaldehydes formed via the isoprostane pathway disrupt mitochondrial respiration and calcium homeostasis. Free Radical Biol. Med. 49, 567–579 [DOI] [PMC free article] [PubMed] [Google Scholar]
- 41. Chance B., Williams G. R. (1955) Respiratory enzymes in oxidative phosphorylation. IV. The respiratory chain. J. Biol. Chem. 217, 429–438 [PubMed] [Google Scholar]
- 42. Lai J. C., Clark J. B. (1976) Preparation and properties of mitochondria derived from synaptosomes. Biochem. J. 154, 423–432 [DOI] [PMC free article] [PubMed] [Google Scholar]
- 43. Starkov A. A. (2010) Measurement of mitochondrial ROS production. Methods Mol. Biol. 648, 245–255 [DOI] [PMC free article] [PubMed] [Google Scholar]
- 44. Birch-Machin M. A., Briggs H. L., Saborido A. A., Bindoff L. A., Turnbull D. M. (1994) An evaluation of the measurement of the activities of complexes I-IV in the respiratory chain of human skeletal muscle mitochondria. Biochem. Med. Metab. Biol. 51, 35–42 [DOI] [PubMed] [Google Scholar]
- 45. Volles M. J., Lee S. J., Rochet J. C., Shtilerman M. D., Ding T. T., Kessler J. C., Lansbury P. T. (2001) Vesicle permeabilization by protofibrillar α-synuclein: implications for the pathogenesis and treatment of Parkinson's disease. Biochemistry 40, 7812–7819 [DOI] [PubMed] [Google Scholar]
- 46. Fink A. L. (2006) The aggregation and fibrillation of α-synuclein. Acc. Chem. Res. 39, 628–634 [DOI] [PubMed] [Google Scholar]
- 47. Cremades N., Cohen S. I. A., Deas E., Abramov A. Y., Chen A. Y., Orte A., Sandal M., Clarke R. W., Dunne P., Aprile F. A., Bertoncini C. W., Wood N. W., Knowles T. P. J., Dobson C. M., Klenerman D. (2012) Direct observation of the interconversion of normal and toxic forms of α-synuclein. Cell 149, 1048–1059 [DOI] [PMC free article] [PubMed] [Google Scholar]
- 48. Luk K. C., Song C., O'Brien P., Stieber A., Branch J. R., Brunden K. R., Trojanowski J. Q., Lee V. M.-Y. (2009) Exogenous α-synuclein fibrils seed the formation of Lewy body-like intracellular inclusions in cultured cells. Proc. Natl. Acad. Sci. U. S. A. 106, 20051–20056 [DOI] [PMC free article] [PubMed] [Google Scholar]
- 49. Luk K. C., Kehm V., Carroll J., Zhang B., O'Brien P., Trojanowski J. Q., Lee V. M.-Y. (2012) Pathological α-synuclein transmission initiates Parkinson-like neurodegeneration in nontransgenic mice. Science 338, 949–953 [DOI] [PMC free article] [PubMed] [Google Scholar]
- 50. Lemasters J. J., Qian T., Elmore S. P., Trost L. C., Nishimura Y., Herman B., Bradham C. A., Brenner D. A., Nieminen A. L. (1998) Confocal microscopy of the mitochondrial permeability transition in necrotic cell killing, apoptosis and autophagy. Biofactors 8, 283–285 [DOI] [PubMed] [Google Scholar]
- 51. Scorrano L., Petronilli V., Di Lisa F., Bernardi P. (1999) Commitment to apoptosis by GD3 ganglioside depends on opening of the mitochondrial permeability transition pore. J. Biol. Chem. 274, 22581–22585 [DOI] [PubMed] [Google Scholar]
- 52. Di Lisa F., Menabò R., Canton M., Barile M., Bernardi P. (2001) Opening of the mitochondrial permeability transition pore causes depletion of mitochondrial and cytosolic NAD+ and is a causative event in the death of myocytes in postischemic reperfusion of the heart. J. Biol. Chem. 276, 2571–2575 [DOI] [PubMed] [Google Scholar]
- 53. Petit P. X., Goubern M., Diolez P., Susin S. A., Zamzami N., Kroemer G. (1998) Disruption of the outer mitochondrial membrane as a result of large amplitude swelling: the impact of irreversible permeability transition. FEBS Lett. 426, 111–116 [DOI] [PubMed] [Google Scholar]
- 54. Bernardi P., Vassanelli S., Veronese P., Colonna R., Szabó I., Zoratti M. (1992) Modulation of the mitochondrial permeability transition pore. Effect of protons and divalent cations. J. Biol. Chem. 267, 2934–2939 [PubMed] [Google Scholar]
- 55. Chance B., Oshino N. (1971) Kinetics and mechanisms of catalase in peroxisomes of the mitochondrial fraction. Biochem. J. 122, 225–233 [DOI] [PMC free article] [PubMed] [Google Scholar]
- 56. Kristal B. S., Dubinsky J. M. (1997) Mitochondrial permeability transition in the central nervous system: induction by calcium cycling-dependent and -independent pathways. J. Neurochem. 69, 524–538 [DOI] [PubMed] [Google Scholar]
- 57. Thomas B., Banerjee R., Starkova N. N., Zhang S. F., Calingasan N. Y., Yang L., Wille E., Lorenzo B. J., Ho D. J., Beal M. F., Starkov A. (2012) Mitochondrial permeability transition pore component cyclophilin D distinguishes nigrostriatal dopaminergic death paradigms in the MPTP mouse model of Parkinson's disease. Antioxid. Redox Signal. 16, 855–868 [DOI] [PMC free article] [PubMed] [Google Scholar]
- 58. Chinta S. J., Mallajosyula J. K., Rane A., Andersen J. K. (2010) Mitochondrial α-synuclein accumulation impairs complex I function in dopaminergic neurons and results in increased mitophagy in vivo. Neurosci. Lett. 486, 235–239 [DOI] [PMC free article] [PubMed] [Google Scholar]
- 59. Choubey V., Safiulina D., Vaarmann A., Cagalinec M., Wareski P., Kuum M., Zharkovsky A., Kaasik A. (2011) Mutant A53T α-synuclein induces neuronal death by increasing mitochondrial autophagy. J. Biol. Chem. 286, 10814–10824 [DOI] [PMC free article] [PubMed] [Google Scholar]
- 60. Volles M. J., Lansbury P. T. (2002) Vesicle permeabilization by protofibrillar α-synuclein is sensitive to Parkinson's disease-linked mutations and occurs by a pore-like mechanism. Biochemistry 41, 4595–4602 [DOI] [PubMed] [Google Scholar]
- 61. Natalello A., Benetti F., Doglia S. M., Legname G., Grandori R. (2011) Compact conformations of α-synuclein induced by alcohols and copper. Proteins 79, 611–621 [DOI] [PubMed] [Google Scholar]
- 62. Näsström T., Fagerqvist T., Barbu M., Karlsson M., Nikolajeff F., Kasrayan A., Ekberg M., Lannfelt L., Ingelsson M., Bergström J. (2011) The lipid peroxidation products 4-oxo-2-nonenal and 4-hydroxy-2-nonenal promote the formation of α-synuclein oligomers with distinct biochemical, morphological, and functional properties. Free Radic. Biol. Med. 50, 428–437 [DOI] [PubMed] [Google Scholar]
- 63. Giehm L., Svergun D. I., Otzen D. E., Vestergaard B. (2011) Low-resolution structure of a vesicle disrupting α-synuclein oligomer that accumulates during fibrillation. Proc. Natl. Acad. Sci. U.S.A. 108, 3246–3251 [DOI] [PMC free article] [PubMed] [Google Scholar]
- 64. Drescher M., van Rooijen B. D., Veldhuis G., Subramaniam V., Huber M. (2010) A stable lipid-induced aggregate of α-synuclein. J. Am. Chem. Soc. 132, 4080–4082 [DOI] [PubMed] [Google Scholar]
- 65. De Franceschi G., Frare E., Pivato M., Relini A., Penco A., Greggio E., Bubacco L., Fontana A., de Laureto P. P. (2011) Structural and morphological characterization of aggregated species of α-synuclein induced by docosahexaenoic acid. J. Biol. Chem. 286, 22262–22274 [DOI] [PMC free article] [PubMed] [Google Scholar]
- 66. Tompkins M. M., Hill W. D. (1997) Contribution of somal Lewy bodies to neuronal death. Brain Res. 775, 24–29 [DOI] [PubMed] [Google Scholar]
- 67. Reeve A. K., Park T.-K., Jaros E., Campbell G. R., Lax N. Z., Hepplewhite P. D., Krishnan K. J., Elson J. L., Morris C. M., McKeith I. G., Turnbull D. M. (2012) Relationship between mitochondria and α-synuclein: a study of single substantia nigra neurons. Arch. Neurol. 69, 385–393 [DOI] [PubMed] [Google Scholar]
- 68. Cohen S. I. A., Linse S., Luheshi L. M., Hellstrand E., White D. A., Rajah L., Otzen D. E., Vendruscolo M., Dobson C. M., Knowles T. P. J. (2013) Proliferation of amyloid-β42 aggregates occurs through a secondary nucleation mechanism. Proc. Natl. Acad. Sci. U.S.A. 110, 9758–9763 [DOI] [PMC free article] [PubMed] [Google Scholar]
- 69. Foehring R. C., Zhang X. F., Lee J. C. F., Callaway J. C. (2009) Endogenous calcium buffering capacity of substantia nigral dopamine neurons. J. Neurophysiol. 102, 2326–2333 [DOI] [PMC free article] [PubMed] [Google Scholar]
- 70. Lee M., Hyun D., Halliwell B., Jenner P. (2001) Effect of the overexpression of wild-type or mutant α-synuclein on cell susceptibility to insult. J. Neurochem. 76, 998–1009 [DOI] [PubMed] [Google Scholar]
- 71. Calì T., Ottolini D., Negro A., Brini M. (2012) α-Synuclein controls mitochondrial calcium homeostasis by enhancing endoplasmic reticulum-mitochondria interactions. J. Biol. Chem. 287, 17914–17929 [DOI] [PMC free article] [PubMed] [Google Scholar]
- 72. Kristal B. S., Conway A. D., Brown A. M., Jain J. C., Ulluci P. A., Li S. W., Burke W. J. (2001) Selective dopaminergic vulnerability: 3,4-dihydroxyphenylacetaldehyde targets mitochondria. Free Radic. Biol. Med. 30, 924–931 [DOI] [PubMed] [Google Scholar]
- 73. Bernardi P. (1992) Modulation of the mitochondrial cyclosporin A-sensitive permeability transition pore by the proton electrochemical gradient. Evidence that the pore can be opened by membrane depolarization. J. Biol. Chem. 267, 8834–8839 [PubMed] [Google Scholar]
- 74. Petronilli V., Cola C., Bernardi P. (1993) Modulation of the mitochondrial cyclosporin A-sensitive permeability transition pore. II. The minimal requirements for pore induction underscore a key role for transmembrane electrical potential, matrix pH, and matrix Ca2+. J. Biol. Chem. 268, 1011–1016 [PubMed] [Google Scholar]
- 75. Camilleri A., Zarb C., Caruana M., Ostermeier U., Ghio S., Högen T., Schmidt F., Giese A., Vassallo N. (2013) Mitochondrial membrane permeabilisation by amyloid aggregates and protection by polyphenols. Biochim. Biophys. Acta 1828, 2532–2543 [DOI] [PubMed] [Google Scholar]
- 76. Guardia-Laguarta C., Area-Gomez E., Rüb C., Liu Y., Magrané J., Becker D., Voos W., Schon E. A., Przedborski S. (2014) α-Synuclein is localized to mitochondria-associated ER membranes. J. Neurosci. 34, 249–259 [DOI] [PMC free article] [PubMed] [Google Scholar]
- 77. Kristal B. S., Park B. K., Yu B. P. (1996) 4-Hydroxyhexenal is a potent inducer of the mitochondrial permeability transition. J. Biol. Chem. 271, 6033–6038 [DOI] [PubMed] [Google Scholar]
- 78. Loeb V., Yakunin E., Saada A., Sharon R. (2010) The transgenic overexpression of α-synuclein and not its related pathology associates with complex I inhibition. J. Biol. Chem. 285, 7334–7343 [DOI] [PMC free article] [PubMed] [Google Scholar]
- 79. Nakamura K., Nemani V. M., Wallender E. K., Kaehlcke K., Ott M., Edwards R. H. (2008) Optical reporters for the conformation of α-synuclein reveal a specific interaction with mitochondria. J. Neurosci. 28, 12305–12317 [DOI] [PMC free article] [PubMed] [Google Scholar]
- 80. Fry M., Green D. E. (1981) Cardiolipin requirement for electron transfer in complex I and III of the mitochondrial respiratory chain. J. Biol. Chem. 256, 1874–1880 [PubMed] [Google Scholar]
- 81. Zhang M., Mileykovskaya E., Dowhan W. (2002) Gluing the respiratory chain together. Cardiolipin is required for supercomplex formation in the inner mitochondrial membrane. J. Biol. Chem. 277, 43553–43556 [DOI] [PubMed] [Google Scholar]
- 82. Telford J. E., Kilbride S. M., Davey G. P. (2009) Complex I is rate-limiting for oxygen consumption in the nerve terminal. J. Biol. Chem. 284, 9109–9114 [DOI] [PMC free article] [PubMed] [Google Scholar]