

Abstract
Background
Diabetic nephropathy (DN) is one of the major late complications of diabetes. Treatment aimed at slowing down the progression of DN is available but methods for early and definitive detection of DN progression are currently lacking. The ‘Proteomic prediction and Renin angiotensin aldosterone system Inhibition prevention Of early diabetic nephRopathy In TYpe 2 diabetic patients with normoalbuminuria trial’ (PRIORITY) aims to evaluate the early detection of DN in patients with type 2 diabetes (T2D) using a urinary proteome-based classifier (CKD273).
Methods
In this ancillary study of the recently initiated PRIORITY trial we aimed to validate for the first time the CKD273 classifier in a multicentre (9 different institutions providing samples from 165 T2D patients) prospective setting. In addition we also investigated the influence of sample containers, age and gender on the CKD273 classifier.
Results
We observed a high consistency of the CKD273 classification scores across the different centres with areas under the curves ranging from 0.95 to 1.00. The classifier was independent of age (range tested 16–89 years) and gender. Furthermore, the use of different urine storage containers did not affect the classification scores. Analysis of the distribution of the individual peptides of the classifier over the nine different centres showed that fragments of blood-derived and extracellular matrix proteins were the most consistently found.
Conclusion
We provide for the first time validation of this urinary proteome-based classifier in a multicentre prospective setting and show the suitability of the CKD273 classifier to be used in the PRIORITY trial.
Keywords: biomarkers, chronic kidney disease, diabetic nephropathy, diagnosis, urine proteomics
INTRODUCTION
In the year 2008; around 347 million people worldwide were suffering from diabetes mellitus, representing about 9.5% of the adult population [1]. In addition, the total number of people with diabetes mellitus is estimated to double by 2030 [2]. Improved treatment and disease management has reduced mortality, further contributing to increasing prevalence.
Diabetic nephropathy (DN) is one of the major late complications of diabetes and is associated with substantial cardiovascular morbidity and mortality [3]. A number of large-scale clinical studies have demonstrated nephroprotective effects by interfering with the renin-angiotensin-aldosterone system [4–6]. Although these treatments slow down the progression of renal disease, they do not halt its development.
Currently, microalbuminuria (30–300 mg/24 h or 20–200 μg/min) is considered a key risk factor for development of DN. However, the value of microalbuminuria as a predictor of DN is questioned since it is not specific and is highly variable [7, 8]. Furthermore, THE onset of DN in the absence of overt albuminuria has been reported in up to 50% of type 1 diabetic patients [9], indicating a lack of sensitivity. Reduction of the estimated glomerular filtration rate (eGFR) in the context of diabetes is a clear indication of advanced DN, but at this late stage of the disease, the success of treatment is severely compromised by irreversible structural damage [6]. Thus, microalbuminuria lacks sensitivity/specificity and a significant reduction of eGFR is a late sign of DN.
We have previously established a urinary peptide-based classifier composed of 273 different urinary peptides termed ‘CKD273’, which detects with high sensitivity and specificity chronic kidney disease (CKD) in patients with different disease aetiologies [10]. In small-scale studies, this classifier predicted the progression from normoalbuminuria to macroalbuminuria in diabetic patients [11, 12], as well as progression of CKD in patients with renal disease originating from different aetiologies [13]. CKD273 was superior to urinary albumin in predicting DN, and also significantly improved prognosis based on currently used classical risk factors [11].
The performance of CKD273 suggests clinical use of the classifier in early detection and prediction of progression of CKD. Evaluation of CKD273 for selection of diabetic patients that will benefit from a low dose of aldosterone treatment in combination with ACEi or ARB blockade is the aim of the recently initiated multicentre interventional trial ‘Proteomic prediction and Renin angiotensin aldosterone system Inhibition prevention Of early diabetic nephRopathy In TYpe 2 diabetic patients with normoalbuminuria’ (the PRIORITY trial, www.eu-priority.org). In PRIORITY, n = 3280 patients with type 2 diabetes (T2D) will be assessed using the CKD273 classifier to detect individuals at ‘high risk’ of developing DN. This subset of patients will be randomized to receive low-dose spironolactone (25 mg/d) or placebo and followed up to assess time to onset of DN. If positive, the study will demonstrate the value of proteomics in guiding early targeted therapy with spironolactone in T2D.
In the present ancillary study, we assessed the ability of CKD273 to detect DN in prospectively collected urine samples from a total of 165 T2D patients originating from 9 different PRIORITY clinical centres.
SUBJECTS AND METHODS
Sample and patient characteristics
Urine samples were prospectively collected in nine different centres (Table 1). Patients were considered to have DN upon displaying macroalbuminuria and/or eGFR <45 mL/min/1.73 m2 (case). Diabetic patients without signs of DN (normoalbuminuria and eGFR >60 mL/min/1.73 m2) were used as controls. A mean of 18 (range 12–23) samples from each centre fulfilled these criteria and could be included for this study. Patient characteristics are given in Table 1. eGFR was estimated using the ‘Modification of Diet in Renal Disease’ (MDRD) formula [14]. None of the included patients was in a regular maintenance dialysis programme. The second morning urine was preferred and stored at −20°C in Urine-Monovette® (SARSTEDT AG & Co, Nümbrecht, Germany). In addition, 19 urine samples were collected at the Steno Diabetes Center to determine the effect of the use of different storage containers on the urinary proteome pattern. After collection the samples were transferred into either Nunc® CryoTubes® (Sigma-Aldrich Co. LLC., St. Louis, MO, USA) or Urine-Monovette® (SARSTEDT AG & Co, Nümbrecht, Germany) containers.
Table 1.
Sample cohorts
| Centre number | Centre | Short name | Sample number (case/control) | Age (mean) | Gender (male per case/control group) | Urinary albumin median (range) (mg/L) case | Urinary albumin median (range) (mg/L) control | eGFR median (range) (mL/min/1.73 m2) case | eGFR median (range) (mL/min/1.73 m2) control | Area under the curve (AUC, 95% CI) |
|---|---|---|---|---|---|---|---|---|---|---|
| 1 | Charite-Berlin | CHA | 9/9 | 57/61 | 4/1 | 368 (11–8620) | 11 (11–11) | 72 (34–104) | 87 (60–117) | 1.00 (0.815–1.000) |
| 2 | Faculty University of Skopje | SKO | 10/5 | 64/64 | 5/0 | 100 (0–100) | 20 (0–20) | 28 (10–48) | 85 (83–111) | 1.00 (0.782–1.000) |
| 3 | Hospital St Georg Leipzig | STG | 12/7 | 62/54 | 7/4 | 538 (97–1633) | 4 (0–20) | 21 (7–50) | 87 (63–111) | 0.95 (0.747–0.999) |
| 4 | Charles University | CUP | 10/10 | n.a. | n.a | 2043 (750–9500)a | 6 (1–16)a | 38 (19–61) | 88 (62–160) | 1.00 (0.832–1.000) |
| 5 | Diabetes Centre Prague | DCP | 10/10 | 63/60 | 5/6 | 2115 (450–7780)b | 8 (3–23)a | 60 (22–110) | 88 (60–131) | 0.89 (0.670–0.984) |
| 6 | Mario Negri Institute | MAR | 9/10 | n.a. | n.a. | 513 (217–2169)c | 5 (3–8)c | 38 (13–102) | 98 (89–128) | 0.96 (0.752–0.999) |
| 7 | Steno Diabetes Center | STE | 9/10 | n.a | n.a. | 346 (3–1673)c | 5 82–23)c | 42 (18–87) | 87 (68–90) | 0.98 (0.786–1.000) |
| 8 | IIS-Fundación Jimenez Diaz | FJD-UTE | 14/9 | 64/64 | 11/5 | 281 (2–2266)c | 4 (0–14)c | 43 (16–102) | 71 (65–105) | 0.90 (0.698–0.984) |
| 9 | Health Plus Abu Dhabi | Abu Dhabi | 4/8 | 67/44 * | 3/5 | 1517 (889–9895) | 15 (1–29) | 79 (19–123) | 99 (72–139) | 1.00 (0.74–1.00) |
Given are the different centres with the number of collected samples and sample characteristics. In addition, the resulted AUC (area under the curve) values obtained using the CKD273 classification score for each centre are listed.
n.a., not available.
*P < 0.05 (for age the Mann–Whitney test, for gender Fisher's exact test was used).
aAlbuminuria (mg/24 h).
bProteinuria (mg/24 h).
cAlbumin/creatinine ratio (mg/g).
Sample preparation
The urine samples were prepared as described previously in detail [15, 16]. Samples were thawed immediately before use. A volume of 0.7 mL was diluted with 0.7 mL 2 M urea, 10 mM NH4OH and 0.02% sodium dodecyl sulphate. To remove high-molecular weight polypeptides, samples were filtered using Centrisart ultracentrifugation filter devices (20 kDa molecular weight cut-off; Sartorius, Goettingen, Germany) at 3000 g until 1.1 mL of filtrate was obtained. The filtrate was desalted with a PD-10 column (GE Healthcare, Uppsala, Sweden) equilibrated in 0.01% NH4OH in HPLC-grade water. The prepared samples were lyophilized and stored at 4°C. Shortly before capillary electrophoresis coupled to mass spectrometry (CE/MS) analysis, lyophilisates were resuspended in HPLC-grade water (Merck KGaA, Darmstadt, Germany).
CE/MS analysis and data processing
CE/MS analysis and data processing was performed as described [10, 17], using a P/ACE MDQ capillary electrophoresis system (Beckman Coulter, Fullerton, CA, USA) online coupled to a micro-TOF MS (Bruker Daltonic, Bremen, Germany). The accuracy, precision, selectivity, sensitivity, reproducibility and stability of the analytical method are described in detail elsewhere [10, 18]. Mass spectral ion signals representing identical molecules at different charge states were deconvoluted into single masses using the MosaiquesVisu software [19]. To achieve high mass accuracy, deconvoluted TOF mass signals were calibrated based on FT-ICR-derived accurate masses (mass deviation of 1 ppm) as described previously [20]. In parallel, CE retention time by local regression and signal intensities using internal standards were normalized as previously described [16]. All detected mass signals of peptides were deposited, matched and annotated in a Microsoft SQL database [20, 21].
Sample classification and statistical analysis
For classification of CKD versus non-CKD, the MosaCluster software and the previously defined CKD273 classifier was used [10].
Sensitivity and specificity of the previously defined biomarker models, and 95% confidence intervals (95% CI) were calculated using receiver operating characteristic (ROC) plots (MedCalc version 8.1.1.0, MedCalc Software, Ostend, Belgium, www.medcalc.be) [22]. The comparison of areas under independent ROC curves was also done using the MedCalc software. For analysis of differences in individual biomarkers between cases and controls, we used the non-parametric Wilcoxon test (R-based statistic software, version 2.15.3). The classification scores of the 19 samples stored in two different containers were compared using a paired Wilcoxon test (MedCalc Software, Ostend Belgium, www.medcalc.be).
RESULTS
Patients and samples
A total of 165 randomly collected urine samples from T2D diabetic patients were prospectively collected in 9 centres (Table 1) participating in the recently initiated PRIORITY study. Eighty-seven patients with T2D had existing DN at baseline while 78 were without DN (Table 1). Urinary albumin values and eGFR values are shown in Table 1 by centre. For follow-up, some centres measured urinary albumin (mg/L or mg/24 h) while others measured the albumin/creatinine ratio or proteinuria (Table 1). All samples were analysed using CE/MS and scored using the CKD273 classifier [10]. The individual classification scores are listed in Supplementary Table S1. Combined abundance of all detected peptides and of the 273 CKD biomarkers are shown in Figure 1. A clear difference in the abundance of a large number of the 273 peptides of CKD273 can be observed between T2D patients with and without DN (Figure 1C and D).
FIGURE 1:

Compiled urinary protein profiles. (A) All peptides detected in the combined T2D cohort with DN and (B) without DN. (C) The 273 CKD biomarkers in the combined T2D cohort with and (D) without DN. Normalized molecular weight (800–20 000 Da) in logarithmic scale is plotted against normalized migration time (18–45 min). The mean signal intensity of polypeptides is given as peak height.
As CKD273 was initially defined in a gender-balanced cohort [10], we studied the effect of gender and age on the classification score. An age bias was observed in one of the nine centres (Table 1, centre 9). Logistic regression was used to investigate if patient age and gender contributed to the proteome classifier-based prediction of the diagnosis. Samples for which no data on age were available (Table 1, centre 4, 6, 7) were excluded from these analyses. No significant contribution of age and gender to the score was observed (P = 0.269 for age and P = 0.312 for gender).
Influence of sample storage
To assess the possible effect of different containers for urine collection on the classification scores obtained with the CKD273 classifier, freshly collected samples (n = 19) were stored in two different containers at −20°C: Nunc® CryoTubes® and Urine-Monovette® and shipped on dry ice. Both replicates were analysed using CE/MS and classified using the CKD273 classifier. No significant difference in CKD273 classification was detected between samples from the two different storage containers (P = 0.623, paired Wilcoxon test).
Multicentre validation of CKD273 to detect DN in T2D patients
The classification scores of T2D patients were analysed using receiver operation curve (ROC) statistics (Table 1) for each individual centre. This resulted in AUC values for the individual centres ranging between 0.9 and 1.0. Comparison of areas under independent ROC curves did not show significant differences between the individual AUC values. Figure 2A shows these scores in the form of box and whisker plots for all T2D patients with and without DN. As previously described [10], a sample with a CKD273 score lower than 0.343 indicates absence of DN, while a score above 0.343 indicates presence of DN. When combining all 165 samples of the 9 centres the classification resulted in AUC of 0.95 (95% CI: 0.90–0.98) (Figure 2B) with 18 of the 165 patients ‘misclassified’ in relation to standard clinical definitions.
FIGURE 2:
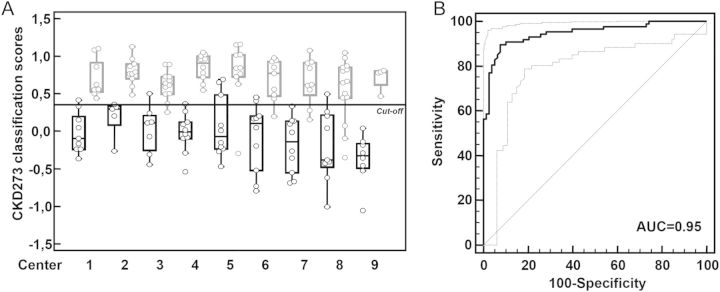
Classification results of the T2D patient cohort. (A) Classification of all T2D patients based on the CKD273 score divided per centre. The scores of patients with macroalbuminuria or/and eGFR < 45 mL/min/1.73 m2 (cases) are marked in gray and the scores of patients with normalbuminuria and eGFR > 60 mL/min/1.73 m2 (controls) are marked in black. The diagnosis cut-off of 0.343 is also shown. The centre number is given on the x-axis (Table 1). (B) Combined ROC curve for the CKD273-based prediction of all T2D patients (n = 165, AUC = 0.95).
In addition, we investigated whether the regulation of the individual biomarkers in the different centres is similar to the regulation initially described in Good et al. [10]. Using the non-parametric Wilcoxon test, we investigated the distribution of the individual 273 CKD biomarkers between the DN group and the control group in each centre, and compared the distribution to the one described in Good et al. [10]. Due to the low number of samples in the individual centres, a P-value of 0.1 was used as the cut-off. Two hundred and seven of the 273 CKD markers (76%) could be verified in a minimum of one of the nine centres. These 207 markers are listed in Supplementary Table S2. This set of biomarkers included 94 collagen alpha-1 (I), 37 collagen alpha-1 (III), 18 alpha-1-antitrypsin, 10 uromodulin, 9 collagen alpha-2 (I), 7 serum albumin, 4 fibrinogen alpha, 3 polymeric-immunoglobulin receptor, 3 alpha-2-HS-glycoprotein and 2 osteopontin, sodium/potassium-transporting ATPase gamma and transthyretin fragments.
To increase statistical power, we combined the data of T2D patients (n = 165) from all centres and investigated the distribution of the 273 biomarkers in this combined cohort. Because of the large number of samples used for this analysis, a P-value of 0.05 was used as significance threshold. When examining the 100 most significant biomarkers in the CKD273 classifier (based on the Good et al. [10], P-value <0.0001 in the training cohort and the lowest P-values in the validation cohort), 67 out of those 100 peptides could be verified in the current study (Supplementary Table S3, Figure 3). These were alpha-1-antitrypsin, serum albumin, transthyretin, alpha-2-HS-glycoprotein, polymeric-immunoglobulin receptor sodium/potassium-transporting ATPase gamma and uromodulin fragments, as well as fragments of collagen alpha-1 (I), alpha-1 (III) and collagen alpha-2 (I).
FIGURE 3:

Validation of the individual 273 CKD biomarkers in the T2D cohort. Verification of the CKD biomarkers using all data of T2D patients (n = 165). Number and names of 67 validated (P < 0.05) protein fragments of the 100 most significant CKD biomarkers are shown.
DISCUSSION
In the present ancillary study of PRIORITY, we observed a high consistency of the CKD273 classification scores across centres, with areas under the curve (AUCs) for the separation between patients with and without DN ranging from 0.9 to 1.0. Moreover, absence of an effect of gender and age on the accuracy of the classifier and absence of effects due to different urine storage containers were established. These results support the feasibility of using CKD273 routinely in a multicentre setting for the detection of DN in T2D patients.
In PRIORITY, as in any study using a proteomics approach, reproducible results are essential for successful implementation. Numerous issues need to be considered in applying proteome analysis to assess disease state, progression or response to drug treatment in the clinic [23, 24].
One of the most relevant aspects is validation of the biomarker model in independent cohorts [25]. Validation of biomarkers in independent test sets (i.e. not used for discovery) needs to be performed since most statistical approaches used for biomarker evaluation assume (i) an even distribution of features across the data (similar variance in control and disease groups, and the absence of covariates), (ii) that the findings can be generalized and (iii) that an association exists only with the investigated condition. As these assumptions do not generally hold in a ‘real world’ setting, most biomarkers with promising initial results have less promising results in independent data sets [26]. CKD273 has previously been validated only in a number of single-centre settings [10–13, 27].
Here we investigated the stability of the CKD273 classifier for the first time in a multicentre setting using prospectively collected samples. We analysed 165 samples of T2D patients from 9 different centres. Although sample collection is described for each centre in a standardized sampling protocol, minor differences in sample collection and handling and in the patient population are expected. In addition, differences in diet and lifestyle, e.g. in different countries, may impact on the urinary proteome. However, all of these differences did not modify the performance of the CKD classifier, which was found to be similar between the centres, resulting in a consistently high AUC value of 0.89–1.00. Therefore, the present study complements previous single-centre studies employing the classifier either focusing on the detection of CKD [10, 27] or predicting progression of disease [11–13]. The data demonstrate that the CKD273 classifier is robust and can be applied to samples shipped to a central laboratory from different centres. Importantly, we ascertained that the use of different sample containers had no effect on the performance of the CKD273 classifier.
Additional basic issues, including temperature stability, freeze/thaw stability, post-preparation stability, reproducibility, intermediate precision and time course, have been studied for the CKD273 classifier, and have previously been described [10]. The relative intra- and inter-assay standard deviation of the classifier was below 7 and 10%, respectively [10]. Further technical validation of CKD273 included assessment of in vivo drug interference and inter-laboratory variability and resolution, mass accuracy and amplitude variability of individual peptides. These treatment interference experiments showed no significant modification of the classifier [28]. To address the inter-laboratory variability, the same 86 samples (45 cases and 41 controls) were analysed in three different laboratories in Germany, France and the UK. The individual results were correlated with each other and resulted in correlation coefficients of 0.881–0.904 [28]. The results of the current study demonstrate that CE/MS-based urinary proteome analysis can provide robust and accurate results when applied in multiple clinical centre studies.
Although we observed high accuracy in the classification of DN (AUC of 0.95), we also recorded a total of 10 false-positive and 8 false-negative classifications among the T2D case and control samples. From four of the apparently false-positive patients (i.e. controls classified as cases), follow-up data were available. One of the apparently false-positive controls developed microalbuminuria, and one developed macroalbuminuria after 1 year follow-up. The other two false-positive patients did not develop any sign of DN within the observation period (8 months – 1 year). These data indicate that the apparent false positives may in fact be true positives, but at an early stage of disease that is detectable by CKD273, but not based on albuminuria [12]. These observations are preliminary, need to be expanded to a longer observation period for all patients, but indicate that the results may, at least in part, be due to the prognostic capabilities of the classifier as previously suggested [11–13, 28].
We also investigated the distribution of individual CKD biomarkers in the single centres. As the cohort size in the single centres was significantly smaller (generally less than one tenth) than in the study for development of CKD273, we did not expect to confirm each biomarker. In addition, we did not observe each of the 273 CKD biomarkers in this cohort of diabetic patients, since for the definition of the 273 CKD biomarkers, patients with different CKD aetiologies were used, not only patients with DN [10]. Therefore, in the complete biomarker set of peptides included in CKD273, peptides specific to, e.g. IgA-nephropathy, focal segmental glomerulosclerosis, membranous glomerulonephritis, or ANCA-associated vasculitis, are represented. As these are not associated with DN, they are not expected to be validated in this study.
As expected, the correlation of individual biomarkers with CKD was lower than the correlation of the biomarker model with CKD, further supporting the application of a composite biomarker for the identification of complex diseases such as DN. When all data were combined, the majority of the 273 CKD markers could be verified in this combined multicentric cohort of diabetic patients. The most consistent biomarkers were fragments of alpha-1-antitrypsin, collagen alpha-1 (I) and (III), serum albumin, uromodulin, alpha-2-HS-glycoprotein, sodium/potassium-transporting ATPase gamma, polymeric-immunoglobulin receptor and transthyretin. We hypothesize that serum albumin and transthyretin are most likely derived from the circulation, while the different collagen fragments most likely originate from the kidney. The increased urinary excretion of alpha-1-antitrypsin by patients with CKD has already been reported [29–32].
The increased urinary abundance of circulating peptides may reflect structural damage to the glomerular filtration barrier and/or impaired tubular absorption, which is well known to occur in CKD [10]. In the current study, all fragments of alpha-1-antitrypsin, serum albumin, uromodulin, alpha-2-HS-glycoprotein, sodium/potassium-transporting ATPase gamma, polymeric-immunoglobulin receptor and transthyretin, included in the 100 most significant markers from the Good et al. study [10], were verified. The number of consistent collagen alpha-1 (I) fragments was also high, but not all of the collagen alpha-1 (I) fragments included in the top 100 CKD273 marker set were replicated. These results also support the hypothesis that collagen degradation is significantly reduced in DN, resulting in accumulation of collagen in the kidney [33]. The accumulation of collagen results in fibrosis, a well-known hallmark of CKD [34]. The stability among the different centres in circulation- versus kidney-derived proteins such as collagens suggests that disturbances in the glomerular filtration barrier or tubular reabsorption may be earlier and more general events in the establishment of DN than albuminuria. This supports the hypothesis of a common pathway for the development of DN initiated by impaired glomerular filtration, leading to protein overload into glomerular and tubular epithelial cells in later stages to fibrosis [35, 36].
In summary, the results presented in this study and previous data obtained in the validation process of CKD273 set the stage for the PRIORITY trial and demonstrate the suitability of the classifier to be used in such a multicentre study to select patients for intervention, aiming at implementing the first steps towards personalized medicine.
SUPPLEMENTARY DATA
Supplementary data are available online at http://ndt.oxfordjournals.org.
CONFLICT OF INTEREST STATEMENT
H.M. is co-founder and a shareholder of mosaiques diagnostics GmbH (Hannover, Germany). J.S. and P.Z. are employees of mosaiques diagnostics GmbH. J.P.S. is temporarily employed by mosaiques diagnostics GmbH.
Supplementary Material
ACKNOWLEDGMENTS
This work was supported in part by EU funding through PRIORITY (HEALTH–F2–2011–279277), SysKID (HEALTH–F2–2009–241544), PREDICTIONS (FP6-LIFESCIHEALTH-CT-2005–018733) and through grant GA 251368 (Protoclin) from the FP7-PEOPLE-2009-IAPP program. A number of the authors were supported by a grant from the Federal Ministry of Economics and Technology (KF2120002FR9). A.O. (Intensificacion) and B.F.-F. (Rio Hortega) were supported by Fondo de Investigacion Sanitaria (FIS). The work of J.P.S. was partially supported by a grant from the region Midi-Pyrenees.
REFERENCES
- 1.Danaei G, Finucane MM, Lu Y, et al. National, regional, and global trends in fasting plasma glucose and diabetes prevalence since 1980: systematic analysis of health examination surveys and epidemiological studies with 370 country-years and 2.7 million participants. Lancet. 2011;378:31–40. doi: 10.1016/S0140-6736(11)60679-X. [DOI] [PubMed] [Google Scholar]
- 2.Wild S, Roglic G, Green A, et al. Global prevalence of diabetes: estimates for the year 2000 and projections for 2030. Diabetes Care. 2004;27:1047–1053. doi: 10.2337/diacare.27.5.1047. [DOI] [PubMed] [Google Scholar]
- 3.Jha V, Garcia-Garcia G, Iseki K, et al. Chronic kidney disease: global dimension and perspectives. Lancet. 2013;382:260–272. doi: 10.1016/S0140-6736(13)60687-X. [DOI] [PubMed] [Google Scholar]
- 4.Tight blood pressure control and risk of macrovascular and microvascular complications in type 2 diabetes: UKPDS 38. UK Prospective Diabetes Study Group. BMJ. 1998;317:703–713. [PMC free article] [PubMed] [Google Scholar]
- 5.Lewis EJ, Hunsicker LG, Bain RP, et al. The effect of angiotensin-converting-enzyme inhibition on diabetic nephropathy. The Collaborative Study Group. N Engl J Med. 1993;329:1456–1462. doi: 10.1056/NEJM199311113292004. [DOI] [PubMed] [Google Scholar]
- 6.Brenner BM, Cooper ME, de Zeeuw D, et al. Effects of losartan on renal and cardiovascular outcomes in patients with type 2 diabetes and nephropathy. N Engl J Med. 2001;345:861–869. doi: 10.1056/NEJMoa011161. [DOI] [PubMed] [Google Scholar]
- 7.Glassock RJ. Debate: CON position. Should microalbuminuria ever be considered as a renal endpoint in any clinical trial? Am J Nephrol. 2010;31:462–465. doi: 10.1159/000313553. [DOI] [PubMed] [Google Scholar]
- 8.Lambers Heerspink HJ, de Zeeuw D. Debate: PRO position. Should microalbuminuria ever be considered as a renal endpoint in any clinical trial? Am J Nephrol. 2010;31:458–461. doi: 10.1159/000292501. [DOI] [PubMed] [Google Scholar]
- 9.Perkins BA, Ficociello LH, Roshan B, et al. In patients with type 1 diabetes and new-onset microalbuminuria the development of advanced chronic kidney disease may not require progression to proteinuria. Kidney Int. 2010;77:57–64. doi: 10.1038/ki.2009.399. [DOI] [PMC free article] [PubMed] [Google Scholar]
- 10.Good DM, Zürbig P, Argiles A, et al. Naturally occurring human urinary peptides for use in diagnosis of chronic kidney disease. Mol Cell Proteomics. 2010;9:2424–2437. doi: 10.1074/mcp.M110.001917. [DOI] [PMC free article] [PubMed] [Google Scholar]
- 11.Roscioni SS, de Zeeuw D, Hellemons ME, et al. A urinary peptide biomarker set predicts worsening of albuminuria in type 2 diabetes mellitus. Diabetologia. 2012;56:259–267. doi: 10.1007/s00125-012-2755-2. [DOI] [PubMed] [Google Scholar]
- 12.Zürbig P, Jerums G, Hovind P, et al. Urinary proteomics for early diagnosis in diabetic nephropathy. Diabetes. 2012;61:3304–3313. doi: 10.2337/db12-0348. [DOI] [PMC free article] [PubMed] [Google Scholar]
- 13.Argiles A, Siwy J, Duranton F, et al. CKD273, a new proteomics classifier assessing CKD and its prognosis. PLoS One. 2013;8:e62837. doi: 10.1371/journal.pone.0062837. [DOI] [PMC free article] [PubMed] [Google Scholar]
- 14.Levey AS, Coresh J, Greene T, et al. Using standardized serum creatinine values in the modification of diet in renal disease study equation for estimating glomerular filtration rate. Ann Intern Med. 2006;145:247–254. doi: 10.7326/0003-4819-145-4-200608150-00004. [DOI] [PubMed] [Google Scholar]
- 15.Theodorescu D, Schiffer E, Bauer HW, et al. Discovery and validation of urinary biomarkers for prostate cancer. Proteomics Clin Appl. 2008;2:556–570. doi: 10.1002/prca.200780082. [DOI] [PMC free article] [PubMed] [Google Scholar]
- 16.Jantos-Siwy J, Schiffer E, Brand K, et al. Quantitative urinary proteome analysis for biomarker evaluation in chronic kidney disease. J Proteome Res. 2009;8:268–281. doi: 10.1021/pr800401m. [DOI] [PubMed] [Google Scholar]
- 17.Wittke S, Mischak H, Walden M, et al. Discovery of biomarkers in human urine and cerebrospinal fluid by capillary electrophoresis coupled to mass spectrometry: towards new diagnostic and therapeutic approaches. Electrophoresis. 2005;26:1476–1487. doi: 10.1002/elps.200410140. [DOI] [PubMed] [Google Scholar]
- 18.Haubitz M, Good DM, Woywodt A, et al. Identification and validation of urinary biomarkers for differential diagnosis and dvaluation of therapeutic intervention in ANCA associated vasculitis. Mol Cell Proteomics. 2009;8:2296–2307. doi: 10.1074/mcp.M800529-MCP200. [DOI] [PMC free article] [PubMed] [Google Scholar]
- 19.Neuhoff N, Kaiser T, Wittke S, et al. Mass spectrometry for the detection of differentially expressed proteins: a comparison of surface-enhanced laser desorption/ionization and capillary electrophoresis/mass spectrometry. Rapid Commun Mass Spectrom. 2004;18:149–156. doi: 10.1002/rcm.1294. [DOI] [PubMed] [Google Scholar]
- 20.Coon JJ, Zürbig P, Dakna M, et al. CE-MS analysis of the human urinary proteome for biomarker discovery and disease diagnostics. Proteomics Clin Appl. 2008;2:964–973. doi: 10.1002/prca.200800024. [DOI] [PMC free article] [PubMed] [Google Scholar]
- 21.Siwy J, Mullen W, Golovko I, et al. Human urinary peptide database for multiple disease biomarker discovery. Proteomics Clin Appl. 2011;5:367–374. doi: 10.1002/prca.201000155. [DOI] [PubMed] [Google Scholar]
- 22.DeLeo JM, DeLeo JM. Receiver operating characteristic laboratory (ROCLAB): Software for developing decision strategies that account for uncertainty. 318–325. 1993. College Park, MD, USA, Second International Symposium on Uncertainty Modeling and Analysis. 4-25-1993.
- 23.Mischak H. How to get proteomics to the clinic? Issues in clinical proteomics, exemplified by CE-MS. Proteomics Clin Appl. 2012;6:437–442. doi: 10.1002/prca.201200027. [DOI] [PubMed] [Google Scholar]
- 24.Mischak H, Ioannidis JP, Argiles A, et al. Implementation of proteomic biomarkers: making it work. Eur J Clin Invest. 2012;42:1027–1036. doi: 10.1111/j.1365-2362.2012.02674.x. [DOI] [PMC free article] [PubMed] [Google Scholar]
- 25.Dakna M, Harris K, Kalousis A, et al. Addressing the challenge of defining valid proteomic biomarkers and classifiers. BMC Bioinformatics. 2010;11:594. doi: 10.1186/1471-2105-11-594. [DOI] [PMC free article] [PubMed] [Google Scholar]
- 26.Mischak H, Allmaier G, Apweiler R, et al. Recommendations for biomarker identification and qualification in clinical proteomics. Sci Transl Med. 2010;2:46ps42. doi: 10.1126/scitranslmed.3001249. [DOI] [PubMed] [Google Scholar]
- 27.Molin L, Seraglia R, Lapolla A, et al. A comparison between MALDI-MS and CE-MS data for biomarker assessment in chronic kidney diseases. J Proteomics. 2012;75:5888–5897. doi: 10.1016/j.jprot.2012.07.024. [DOI] [PubMed] [Google Scholar]
- 28.Mischak H, Vlahou A, Ioannidis JP. Technical aspects and inter-laboratory variability in native peptide profiling: the CE-MS experience. Clin Biochem. 2013;46:432–443. doi: 10.1016/j.clinbiochem.2012.09.025. [DOI] [PubMed] [Google Scholar]
- 29.Argiles A, Mourad G, Mion C, et al. Two-dimensional gel electrophoresis of urinary proteins in kidney diseases. Contrib Nephrol. 1990;83:1–8. doi: 10.1159/000418766. [DOI] [PubMed] [Google Scholar]
- 30.Candiano G, Musante L, Bruschi M, et al. Repetitive fragmentation products of albumin and alpha1-antitrypsin in glomerular diseases associated with nephrotic syndrome. J Am Soc Nephrol. 2006;17:3139–3148. doi: 10.1681/ASN.2006050486. [DOI] [PubMed] [Google Scholar]
- 31.Kwak NJ, Heo Y, Jin DC, et al. Proteomic analysis of alpha-1-antitrypsin in immunoglobulin A nephropathy. Proteomics Clin Appl. 2007;1:420–428. doi: 10.1002/prca.200600288. [DOI] [PubMed] [Google Scholar]
- 32.Varghese SA, Powell TB, Budisavljevic MN, et al. Urine biomarkers predict the cause of glomerular disease. J Am Soc Nephrol. 2007;18:913–922. doi: 10.1681/ASN.2006070767. [DOI] [PMC free article] [PubMed] [Google Scholar]
- 33.Rossing K, Mischak H, Rossing P, et al. The urinary proteome in diabetes and diabetes-associated complications: new ways to assess disease progression and evaluate therapy. Proteomics Clin Appl. 2008;2:997–1007. doi: 10.1002/prca.200780166. [DOI] [PubMed] [Google Scholar]
- 34.Meguid El NA, Bello AK. Chronic kidney disease: the global challenge. Lancet. 2005;365:331–340. doi: 10.1016/S0140-6736(05)17789-7. [DOI] [PubMed] [Google Scholar]
- 35.Noone D, Licht C. Chronic kidney disease: a new look at pathogenetic mechanisms and treatment options. Pediatr Nephrol. 2013 doi: 10.1007/s00467-013-2436-5. Doi:10.1007/s00467-013-2436-5. [DOI] [PubMed] [Google Scholar]
- 36.Ruggenenti P, Cravedi P, Remuzzi G. Mechanisms and treatment of CKD. J Am Soc Nephrol. 2012;23:1917–1928. doi: 10.1681/ASN.2012040390. [DOI] [PubMed] [Google Scholar]
Associated Data
This section collects any data citations, data availability statements, or supplementary materials included in this article.