

Abstract
Malignant mesothelioma (MMe) is a highly aggressive, lethal tumour requiring the development of more effective therapies. The green tea polyphenol epigallocathechin-3-gallate (EGCG) inhibits the growth of many types of cancer cells. We found that EGCG is selectively cytotoxic to MMe cells with respect to normal mesothelial cells. MMe cell viability was inhibited by predominant induction of apoptosis at lower doses and necrosis at higher doses. EGCG elicited H2O2 release in cell cultures, and exogenous catalase (CAT) abrogated EGCG-induced cytotoxicity, apoptosis and necrosis. Confocal imaging of fluo 3-loaded, EGCG-exposed MMe cells showed significant [Ca2+]i rise, prevented by CAT, dithiothreitol or the T-type Ca2+ channel blockers mibefradil and NiCl2. Cell loading with dihydrorhodamine 123 revealed EGCG-induced ROS production, prevented by CAT, mibefradil or the Ca2+ chelator BAPTA-AM. Direct exposure of cells to H2O2 produced similar effects on Ca2+ and ROS, and these effects were prevented by the same inhibitors. Sensitivity of REN cells to EGCG was correlated with higher expression of Cav3.2 T-type Ca2+ channels in these cells, compared to normal mesothelium. Also, Cav3.2 siRNA on MMe cells reduced in vitro EGCG cytotoxicity and abated apoptosis and necrosis. Intriguingly, Cav3.2 expression was observed in malignant pleural mesothelioma biopsies from patients, but not in normal pleura. In conclusion, data showed the expression of T-type Ca2+ channels in MMe tissue and their role in EGCG selective cytotoxicity to MMe cells, suggesting the possible use of these channels as a novel MMe pharmacological target.
Keywords: anticancer therapy, hydrogen peroxide, reactive oxygen species, malignant mesothelioma, T-type calcium channels
Introduction
Malignant mesothelioma (MMe) is a highly aggressive tumour arising from mesothelial cells of the serosal surfaces of body cavities, mainly the pleura. The incidence of this tumour is increasing worldwide because of exposure to asbestos, while the prognosis for patients is still poor, with a median survival of about 12 months [1]. Chemotherapy is the most widely used clinical approach, with various cytotoxic drugs having already been tested [2–4]. The response rate is higher for drug combinations than for single-agent regimens, but no satisfactory therapy has yet been defined, therefore, the development of novel translational therapies is urgent [5,6].
In the light of current failures in MMe therapies, we have addressed the possibility of combining anti-cancer active nutrients with chemotherapy drugs, to obtain synergistic treatments along with reduced side effects [7]. We have previously shown that ascorbate, which is known to produce H2O2 [8], exerts anti-tumour properties on mesothelioma through a stronger oxidative stress in MMe cells compared to normal mesothelial cells [9]. It is well established that different chemotherapeutic agents generate reactive oxygen species (ROS) in patients during cancer therapy [10]. Thereafter, oxidative stress induces a series of cell responses depending on the genetic background, the types of ROS involved and the intensity and duration of the stimulus. Such a complex of factors will determine whether a cell will survive or undergo necrosis or apoptosis.
Epigallocathechin-3-gallate (EGCG) is a flavan-3-ol polyphenol produced by green tea, which is known to exert anti-tumour activity in many types of cancer cells [11–16]. In several cases, transformed cells have been found to be more sensitive to EGCG than their normal counterparts [17]. Following this body of evidence, EGCG has been proposed as a possible chemopreventive or chemotherapeutic agent in the treatment of cancer [18–20]. In a vast array of studies, it has been shown that EGCG can modify the physiology of cells by interacting with a large set of protein targets [21]. Accordingly, a number of mechanisms have been put forward to explain the anti-tumour activity of EGCG, including, among others, induction of cell cycle arrest [22], inhibition of factors like NF-κB [12], insulin-like growth factor I receptor [23], c-Met receptor [24], matrix metalloproteinase [25,26] and proteasome [27], suppression of Wnt signalling [28], of the expression of HSP70 and HSP90 [29] and of the tumour-promoter TROP2 [30], down-regulation of the EGF receptor [31], activation of TNF-α-mediated signalling [32] and induction of p53-dependent [20] and ASK1-p38/JNK-dependent apoptosis [33].
Even though gallocatechins are generally known to be strong antioxidants [34], there is evidence that some of the effects of these compounds may be related to ROS release. Transition metals, primarily Cu and Fe, are capable of initiating phenolic oxidations and are essential catalysts in this process. These reactions yield superoxide (O2–•) or its protonated hydroperoxyl radical (HO2•), which can be further reduced to hydrogen peroxide [35]. In line with these findings, it has been shown that EGCG can also inhibit cancer cell growth through pro-oxidant activities [36–38], and also in this respect, normal cells have been reported to be less sensitive than tumours to the action of EGCG [39]. Data also suggest that pro-oxidant effects may play a role in the anti-tumour or toxic effects of EGCG that have been observed in vivo on animal models [40].
In this study, we have described the in vitro selective oxidative toxicity to MMe cells of EGCG, which, as previously shown, has been found to generate H2O2 in the cell medium [41]. Moreover, we have provided the first demonstration of T-type Ca2+ channels expression in MMe cells and concomitantly, have defined a novel mechanism of action for EGCG. This mechanism involves the induction of T-channel opening by H2O2, followed by [Ca2+]i homeostasis impairment, induction of intracellular ROS and eventually cell apoptosis or necrosis, depending on the intensity of the stimulus. These findings suggest the possible use of EGCG for MMe, and indicate T-type Ca2+ channels as a novel therapeutic target.
Materials and methods
Reagents
Reagents were purchased from Sigma-Aldrich (Milan, Italy), unless otherwise indicated.
Cell culture
In vitro experiments were carried out on both mesothelioma and normal mesothelial cell lines. The following human MMe cells were used: REN is a tumourigenic, p53-mutant, epithelial subtype [42]; MM98 were established from pleural effusion of a sarcomatous MMe [43]; BR95 and E198 were obtained from pleural effusions of MMe patients with histologically confirmed MMe and confirmed by immunostaining [44]; MPP89 are epithelial-like MMe cells [43]; primary mesothelial cells, were obtained from the inner surface of surgically removed hernial sacs [9]. HMC-hTERT are mesothelial cells obtained from patients with congestive heart failure and immortalized by expression of the hTERT human telomerase subunit [45]. Cells were cultured in DMEM supplemented with 10% foetal bovine serum (FBS; Euroclone, Pero, Italy) and 1% antibiotic mixture (Gibco, Invitrogen Life Technologies, S. Giuliano Milanese, Italy).
Cell viability assays
The calcein assay was carried out using the lipophilic, nonfluorescent calcein-acetoxymethylester (calcein-AM), which penetrates cell membranes and is then cleaved by intracellular esterases, yielding the hydrophilic fluorescent dye. Cells growing in 96-well plates were treated with EGCG as specified, washed with PBS, and then incubated for 30 min. at 37°C with a solution of 2.5 μM calcein-AM in PBS. Plates were read in a fluorescence reader (Infinite 200 Pro, Tecan), by using 485-nm exc and 535-nm em filters.
Cell viability was also evaluated through DNA-based cell counting, using the Hoechst 33258 DNA dye (bisbenzimide; p-(5-(5-(4-methyl-1-piperazinyl)-1H-2-benzimidazolyl)-1H-2-benzimidazolyl) phenol trihydrochloride). Cells growing in 96-well plates were treated with EGCG as specified, and then washed in PBS and permeabilized with 100 μl of 10 M urea and 0.01% SDS for 30 min. at 37°C. Thereafter, 100 μl of 1 μg/ml Hoechst solution in PBS were added to wells, plates were incubated for 30 min. at 37°C, and read in the plate reader, using 355-nm exc and 460-nm em filters.
In both DNA and calcein fluorimetric assays, the degree of fluorescence was converted to cell number by using calibration standard curves obtained from wells containing numbers of cells ranging from 5 to 40 × 103, as determined using a haemocytometer.
H2O2 and protein assays
The formation of H2O2 induced by EGCG in tissue culture medium was determined by the Colorimetric Hydrogen Peroxide kit (Assay Designs, Ann Arbor, MI, USA) as described in Ranzato et al. [9].
Total protein in cell lysates was determined using the bicinchoninic acid-based BCA Protein Assay Kit (Pierce, Rockford, IL, USA), following the manufacturer's protocol. Microplates were read at 540 nm using a plate reader (Sirio S, SEAC, Florence, Italy).
LDH and caspase 3 assays
The rate of cell necrosis induced by EGCG was detected using the lactate dehydrogenase (LDH) assay. The analysis was performed on cell supernatants according to the method of Legrand et al. [46], by using the Cytotoxicity Detection Kit (Roche Diagnostics GmbH, Mannheim, Germany). Absorbances were read at 492 nm using the Infinite 200 Pro plate reader.
Caspase 3 activity was determined in cell lysates by using a fluorimetric assay kit (Caspase-3 Fluorescence kit; Cayman Chemical Company, Ann Arbor, MI, USA) according to the manufacturer's instructions. Plates were read in the fluorescence reader by using 485-nm exc and 535-nm em filters.
Measurement of intracellular ROS
Intracellular levels of ROS were measured using the fluorescent dye precursor dihydrorhodamine (DHR) 123 [47], which is converted to fluorescent rhodamine 123 upon reaction with ROS. Cells were seeded in 96-well plates, allowed to settle overnight, and loaded in the dark at room temperature for 30 min. with DHR-123 (30 μM) in a loading buffer consisting of (mM) 10 Hepes, 140 NaCl, 10 glucose, 1 MgCl2, 2 CaCl2 and 5 KCl, pH 7.4. Cells were then washed with loading buffer and examined in the fluorescence microplate reader, by using 485-nm exc and 530-nm em filters. Data of ROS production were expressed as fluorescence arbitrary units.
Measurements of free cytosolic Ca2+
Variations of free cytosolic Ca2+ were evaluated as described in Ranzato et al. [9] Briefly, cells were plated on glass-base dishes (Iwaki Glass Inc., Tokyo, Japan), loaded with the fluorescent Ca2+ probe fluo 3-AM (20 μM) in the above loading buffer, washed and examined by confocal time-lapse analysis using a Zeiss LSM 510 confocal system (Carl Zeiss, Oberkochen, Germany) (exc 488 nm, em 505–550 nm). Cells were observed through a 20× Plan-Neofluar Zeiss objective (0.5 NA). The fluorescence of individual cells was recorded using the ROI tool of the Zeiss LSM 510 2.01 software. Fluo 3 calibration was achieved by the equation [48]:
where Kd = 400 nmoles/l. Fmax and Fmin are maximum and minimum fluorescence intensities obtained by fluo 3 calibration after cell exposure to 500 μM A23187 for a few minutes, followed by addition of 20 mM EDTA.
Western immunoblotting
Western blot was carried out as described in Ranzato et al. [9]. Amounts of 100 μg protein from cell lysates were subjected to SDS-PAGE (12% gel), blotted to nitrocellulose membrane, probed with a primary monoclonal antibody against the Cav3.2 calcium channel (clone S55-10, cat. no. 13704, Cayman Chemicals, dilution 1:400), incubated with horseradish peroxidase-conjugated secondary antibody (Bethyl Laboratories, Montgomery, TX, USA; dilution 1:1000), developed using an ECL kit (Millipore, Billerica, MA, USA), acquired by ChemiDoc XRS (Bio-Rad Laboratories, Hercules, CA, USA) and digitized with the Quantity One Imaging system (Bio-Rad). Equal loading were confirmed with anti-actin antibody (Santa Cruz Biotechnology, Santa Cruz, CA, USA).
Quantitative reverse transcriptase PCR (qRT-PCR) and RNA interference (siRNA)
RNA was extracted and cDNA was generated using the Cells-to-CT™ Kit (Ambion, Foster City, CA, USA). After this, qRT-PCR was performed using Power Sybr Green Mastermix (Ambion), and a CFX384 Real-Time PCR Detection System (Bio-Rad Laboratories). Gene expression was calculated using the ΔΔ−Ct method. The following qRT-PCR primer pairs were used:
GADPH forward: AATCCCATCACCATCTTCCA
GADPH reverse: TGGACTCCACGACGTACTCA
b-actin forward: TCCCTGGAGAAGAGCTACGA
b-actin reverse: AGCACTGTGTTGGCGTACAG
Cav3.2 forward: TGCTACGAAGAGCTGCTGAA
Cav3.2 reverse: GCCATGGCTGAAATGGTAGT
REN cells were transfected with siRNA oligonucleotides (5 μM), or with equimolar scramble siRNA, by using the N-ter Nanoparticle siRNA Transfection System. We used commercial siRNA specific to the human CACNA1H gene, which encodes for the Cav3.2 protein. The sequences consisted of 5′-CUGACUAAUGCUCUGGAGA (sense) and 5′-UCUCCAGAGCAUUAGUCAG (antisense). Scramble siRNA was obtained using commercial non-targeting siRNA (MISSION siRNA Universal Negative Control). Cells were harvested at 24, 48 and 72 hrs after transfection and used for Western blot and other experiments.
Immunohistochemical analysis
A total of eight cases of MMe and two controls were selected from the archival pathology files of the Pathology Unit of the Regional Hospital of Mestre-Venice, Italy. All diagnoses of mesothelioma were based on WHO criteria [49] and confirmed in all instances by clinical, morphological and immunohistochemical data. The tissue samples consisted in videothoracoscopy biopsy or surgical specimens, fixed in neutral formalin and embedded in paraffin.
Cav3.2 immunostaining was performed on 3 μm-thick paraffin sections. Slides were deparaffinized according to established procedures, subjected to citric acid antigen retrieval followed by incubation in 3% hydrogen peroxide in PBS to inhibit endogenous peroxidase activity. Subsequently, pleural sections were blocked for 1 hr at 37°C in PBS blocking buffer (10% normal goat serum) to inhibit non-specific antibody binding. To identify Cav3.2, sections were incubated at 37°C with the above mentioned mouse monoclonal antibody (Cayman), diluted 1:150 in PBS blocking buffer. After washing, slides were processed using the IHC Detection Set (Millipore). Briefly, slides were covered with a biotinylated secondary antimouse antibody and incubated for 1 hr at 37°C, washed and incubated with streptavidin-alkaline phosphatase complex. Thereafter, labelling was visualized by Fast Red application and slides were counterstained with hematoxylin. Images were acquired using an Axiovert Zeiss microscope (Zeiss).
The intensity of immunohistochemical staining was analysed using Scion Image software (Scion Corp., Frederick, MD, USA). Briefly, digital micrographs of immunohistochemistry slides were imported from microscope-mounted digital imaging system as a Scion Image file for analysis of staining intensity. Representative regions of interest were then selected from within pleura regions. In addition, a region of interest in an unstained area was selected and measured as background. Thus, staining intensity was measured, normalized against background and expressed as mean ± SD of optical density.
Statistics
Data were analysed by anova using the Instat Software package (GraphPad Software, Inc., San Diego, CA, USA ). Values of IC50 and their 95% confidence intervals (95% CI) were determined using a downhill sigmoidal dose–response curve developed by CSIRO, Australia [50]:
where T = top, S = Hill's slope (negative for a downhill curve), D = EGCG concentration in μmoles/l. Statistical comparisons between IC50 values were based on overlapping or non-overlapping 95% confidence intervals.
Results
EGCG induces MMe cell death and apoptosis
The first step of this research was the evaluation of EGCG cytotoxicity to various MMe cell lines, in comparison to normal mesothelial cells, by using the calcein-AM endpoint. These analyses showed significantly lower IC50 values for MMe with respect to non-neoplastic mesothelial cells (Table 1), indicating a clear selective cytotoxicity of EGCG to tumour cells.
Table 1.
Cytotoxicity of EGCG to MMe and non-neoplastic mesothelial cells, measured by the calcein-AM endpoint at 24 hrs
| Cell line | IC50 (μM) | 95% CI |
|---|---|---|
| MM98 | 18 | 16–20 |
| BR95 | 40 | 38–43 |
| REN | 52 | 45–60 |
| E198 | 58 | 48–69 |
| MPP89 | 85 | 76–95 |
| Mesothelium | 160 | 144–178 |
| HMC h-TERT | 309 | 267–359 |
Values of IC50 and 95% confidence intervals (95% CI) were derived from three separate experiments, each with eight replicates (see Materials and methods for further details). Non-overlapping 95% CI indicate significant differences.
The underlying mechanism of toxicity was then explored by using REN cells, whose tumourigenicity has been assessed on mouse models [42]. The LDH and caspase 3 assays were used to differentiate mechanisms of necrosis from apoptosis. The rate of LDH release showed a non-linear, dose-dependent increase in the range 5–500 μM EGCG (Fig. 1A). The activity of caspase 3, representing an index of apoptosis, showed an increase at 5 and 10 μM EGCG, and then a progressive decline at higher concentrations, down to levels below control values (Fig. 1B). Hence, these data indicate that in EGCG-exposed cells, there is a prevalence of apoptosis at lower concentrations and a progressive prevalence of necrosis at higher doses.
Fig. 1.
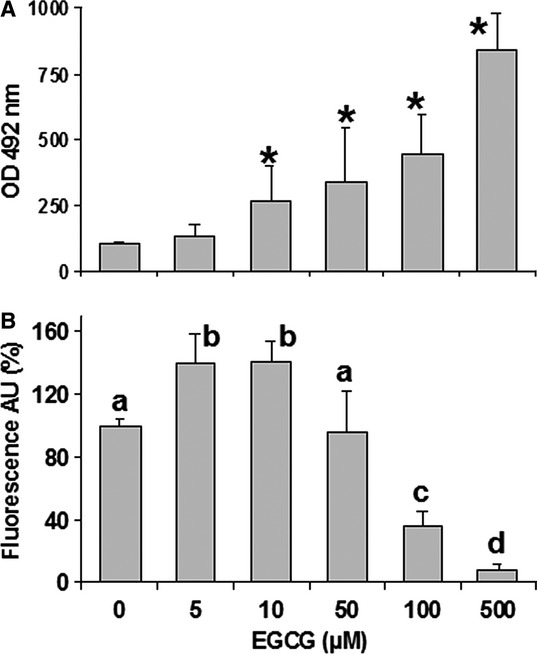
(A) Lactate dehydrogenase (LDH) release in the supernatant of REN cells after exposure to increasing EGCG concentrations for 6 hrs. Data are means ± SD derived from 5 to 9 independent treatments, and expressed as optical densities at 492 nm (see Materials and methods). *P < 0.01 with respect to control according to the Dunnett's test. (B) Caspase 3 activity measured in REN cells exposed to EGCG as above. Data are means ± SD derived from 10 independent treatments, and expressed as fluorescence arbitrary units (see Materials and methods). Different letters on bars indicate significant differences according to the Tukey's test (P < 0.01).
EGCG-dependent toxicity to MMe cells is because of the extracellular production of H2O2
It is already known that EGCG induces H2O2 production in cell cultures [35,51,52]. By using an H2O2 assay, we found that EGCG is able to induce the release of this ROS in REN cultures, and that a lower but significant production is also elicited in the absence of cells (Fig. 2A). We then evaluated whether the addition of exogenous catalase (CAT), which scavenges H2O2, may reduce EGCG cytotoxicity. Cell viability tests based on calcein (Fig. 2B) and DNA assays (Fig. 2C) consistently showed that CAT is able to block the cytotoxicity of EGCG to REN cells. Moreover, CAT almost abolished the release of LDH from cells exposed to increasing doses of EGCG (Fig. 3A), and also abolished the activation of caspase 3 activity at low EGCG doses and its scaling down at higher doses (Fig. 3B). Taken together, these data indicate that the cytotoxicity of EGCG to MMe cells is largely dependent on the extracellular production of H2O2.
Fig. 2.
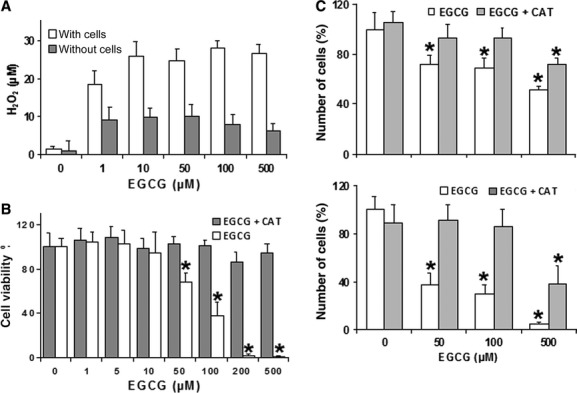
(A) Production of H2O2 in DMEM medium after 1 hr incubation with increasing EGCG concentrations, in the presence or absence of REN cells. Data are means ± SD (n = 3) of H2O2 concentrations determined as described in the Materials and methods. All groups are significantly different with respect to their control (P < 0.01, Dunnett's test). (B) Determination of REN cell viability in response to increasing EGCG, in the presence or absence of exogenous CAT (500 units/ml). Data are extrapolated from the calcein-AM viability index after exposure of cells to EGCG for 24 hrs, and are expressed as means ± SD of two independent experiments, each with eight replicates. *P < 0.01 with respect to control according to the Dunnett's test. (C) Viable cell counts performed through microplate fluorometric DNA assays on REN cells, showing dose-response relations to increasing EGCG concentrations in the presence or absence of 500 units/ml CAT. The fluorescent signal was read after incubation with Hoechst 33258 (see Materials and methods). Data are expressed as means ± SD (n = 8 independent samples) of the estimated numbers of cells. The mean of control without CAT has been set to 100%. *P < 0.01 with respect to control according to the Dunnett's test.
Fig. 3.
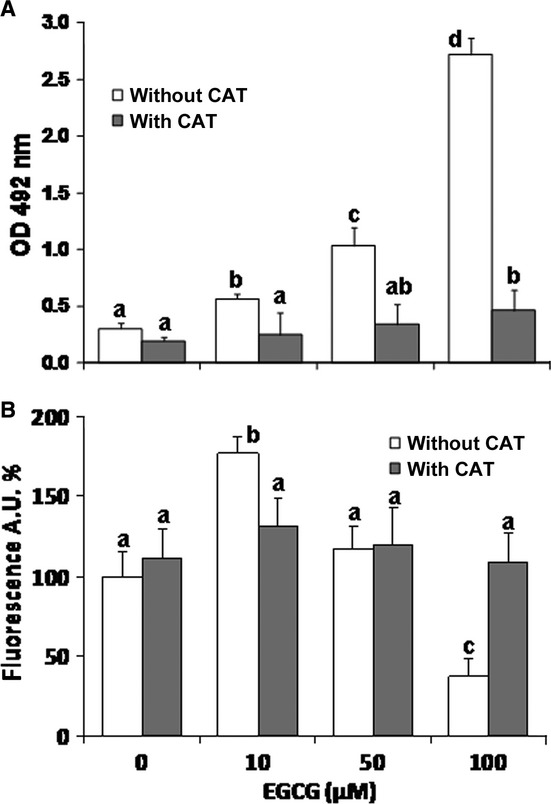
(A) Lactate dehydrogenase (LDH) release in the supernatant of REN cells after 24 hrs exposures to different EGCG concentrations in the presence or absence of CAT (500 units/ml). Data are means ± SD (n = 6 independent replicates) expressed as absorbances at 492 nm (see Materials and methods). (B) Caspase 3 activity measured in REN cells exposed for 6 hrs to EGCG in the presence or absence of 500 units/ml CAT. Data are means ± SD derived from 3 to 5 (without CAT) or 8 to 11 (with CAT) independent treatments, and expressed as fluorescence arbitrary units (see Materials and methods). For each series, different letters on bars indicate significant differences according to the Tukey's test (P < 0.01).
EGCG cytotoxicity involves free cytosolic Ca2+ dysregulation
Mechanisms of cell toxicity, particularly those involving oxidative stress, are strictly linked to a deregulation of cytosolic free calcium concentration ([Ca2+]i). In addition, EGCG is known to disrupt cell Ca2+ homeostasis [53]. Hence, we assessed cell Ca2+ variations induced by EGCG in MMe cells, by using time-lapse confocal microscopy imaging of REN cells loaded with the fluorescent Ca2+ probe fluo 3. Confocal imaging showed that EGCG induces a progressive and sustained [Ca2+]i rise, indicating Ca2+ homeostasis disruption (Fig. 4A). Such an effect was almost completely prevented by addition to the cell medium of CAT or the sulfhydryl-preserving agent dithiothreitol (DTT) (Fig. 4A).
Fig. 4.
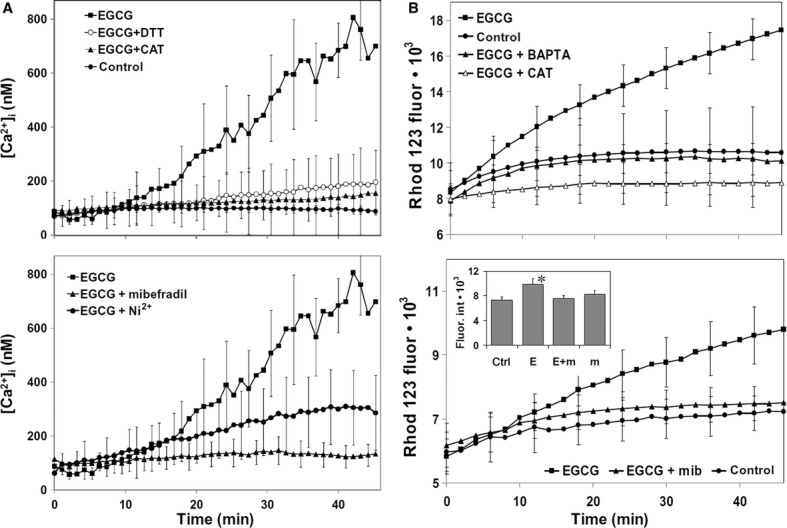
(A) Intracellular Ca2+ variations recorded each minute for a period of 45 min. in individual REN cells, by using confocal imaging (see Materials and methods). Upper panel. Exposure to 100 μM EGCG induces a sustained rise in [Ca2+]i that is indicative of Ca2+ homeostasis disruption. External additions of DTT (2.5 mM) or CAT (500 units/ml) abolish the effect of EGCG (P < 0.001, Tukey's test carried out on 45-min. data). Lower panel. Pre-incubation with the Ca2+ channel blockers mibefradil (5 μM) or Ni2+ (30 μM NiCl2) significantly prevent the [Ca2+]i rise induced by 100 μM EGCG (P < 0.001, as above). Data are means ± SD of [Ca2+]i values recorded in different cells from three different experiments. Number of cells: 32 (control), 37 (EGCG), 33 (EGCG + DTT), 40 (EGCG + CAT), 26 (EGCG + mibefradil), 40 (EGCG + NiCl2). (B) ROS production in DHR 123-loaded REN cells growing in 96-well plates, recorded each 2 min. for a period of 46 min. in a fluorescence plate reader (see Materials and methods). Upper panel: Exposure to 100 μM EGCG induces an increase in ROS production that is abolished by cell loading with the membrane-permeant Ca2+ chelator BAPTA-AM, or by external addition of 500 units/ml CAT (P < 0.001, as above). Lower panel: Pre-incubation with the Ca2+ channel blocker mibefradil (5 μM) prevents the rise in ROS production induced by 100 μM EGCG (P < 0.001, as above). Inset: Fluorescence values recorded at 45 min. in control cells (ctrl), or in cells incubated with EGCG alone (e), EGCG/mibefradil (E + m) and mibefradil alone (m) (*P < 0.001, Tukey's test). Data are means ± SD of rhodamine 123 fluorescence expressed in arbitrary units; n = 16 microplate wells from two different experiments.
To disclose the mechanism of this Ca2+ disorder, we evaluated the possible role of calcium channels. A growing body of evidence suggests that T-type Ca2+ channels are abnormally expressed in cancerous cells [54]. We therefore evaluated the effect of typical T-type channel inhibitors, viz. mibefradil [55] and Ni2+ [56], on the Ca2+ rise induced by EGCG. Confocal imaging showed that REN cell preincubations with mibefradil or Ni2+, used in the form of NiCl2, were able to prevent Ca2+ homeostasis loss caused by EGCG (Fig. 4A). Cell incubation with mibefradil, NiCl2 or the mibefradil's vehicle DMSO, each used alone, were ineffective on Ca2+ (not shown). In addition, we also measured EGCG cytotoxicity to REN cells in the presence or absence of 5 μM mibefradil, finding that the Ca2+ channel blocker induces a significant shift of the EGCG IC50, from 95 μM (95% CI: 84–106) to 586 μM (95% CI: 516–664).
EGCG induces ROS increase within MMe cells
Given that cell Ca2+ alteration and excessive ROS production are known to cooperatively promote cell death processes, we also explored the development of ROS within MMe cells. In these experiments, intracellular ROS production was evaluated by recording the fluorescence of DHR 123-loaded REN cells in a microplate reader. Similar to what was observed with Ca2+, EGCG induced a sustained rise in ROS production, which was abolished by exogenous CAT, and, most intriguingly, also by cell loading with the cell-permeant Ca2+ chelator BAPTA-AM or by cell preincubation with mibefradil (Fig. 4B).
EGCG acts differently on [Ca2+]i and ROS in MMe and mesothelium
The cytotoxicity data reported in Table 1 indicate that MMe cells are more sensitive to EGCG than normal mesothelial cells. Moreover, we have also shown that EGCG acts by inducing loss of Ca2+ homeostasis and increased ROS production. We therefore compared the effects of EGCG on [Ca2+]i and ROS in REN and mesothelial cells, by using confocal imaging and fluorescence plate reader data, recorded as above after 45 min. of EGCG incubation. These experiments confirmed that EGCG induces a significant increase of [Ca2+]i and ROS in REN cells, whereas in contrast in mesothelial cells the variation of [Ca2+]i was barely significant, and the ROS increase was significantly lower than in REN cells (Table 2).
Table 2.
Effect of EGCG on [Ca2+]i and ROS production in REN and mesothelial cells
| Cell type | Treatment | [Ca2+]i (nM) | ROS |
|---|---|---|---|
| REN | control | 80 ± 35a (n = 32) | 7.2 ± 1.2a (n = 18) |
| REN | 100 μM EGCG | 771 ± 507b (21) | 21.9 ± 3.2b (25) |
| Mesothelium | control | 57 ± 12a (9) | 5.9 ± 1.1a (10) |
| Mesothelium | 100 μM EGCG | 169 ± 77a (24) | 12.4 ± 3.2c (16) |
Data are means ± SD of [Ca2+]i expressed as nM, and of ROS production expressed as rhodamine 123 fluorescence in arbitrary units, recorded after 45 min. of treatment (no. of cells or wells are given in parentheses; see Methods for further details). In each column, different superscript letters indicate significant differences according to the Tukey's test (P < 0.01).
Direct cell exposure to H2O2 acts similarly to EGCG on [Ca2+]i and ROS
As the use of exogenous CAT indicates an involvement of extracellular H2O2 in EGCG cytotoxicity, we ran a series of experiments by directly exposing REN cells to 20 μM H2O2 for 45 min. Confocal imaging revealed that H2O2 induced a sustained [Ca2+]i rise, which was abolished by addition of DTT or mibefradil. Also, microplate fluorescence data revealed an increase of intracellular ROS production, which was partially but significantly prevented by DTT or mibefradil (Table 3).
Table 3.
Effects of H2O2 on [Ca2+]i and ROS in REN cells, and suppressive actions of DTT and mibefradil
| Treatment | [Ca2+]i (nM) | ROS |
|---|---|---|
| Control | 80 ± 35a (n = 32) | 7.2 ± 0.57a (n = 16) |
| 20 μM H2O2 | 1102 ± 713b (25) | 21.2 ± 1.8b (16) |
| 20 μM H2O2 + 5 μM mibefradil | 184 ± 45a (31) | 16.8 ± 1.6c (16) |
| 20 μM H2O2 + 2.5 mM DTT | 90 ± 66a (25) | 11.2 ± 3.0d (16) |
Data and statistics as in Table 2.
Cav3.2 silencing abolishes EGCG toxicity on MMe cells
The above data suggest a role for T-type channels in mediating EGCG effects on MMe cells. We therefore targeted these channels by siRNA-mediated knock-down of the CACNA1H gene, encoding for the Cav3.2 α1H protein. Such an isoform was chosen because it is known to mediate the redox regulation of neuronal T-type channels [57].
Quantitative PCR (qRT-PCR) and Western blot analyses showed, respectively, that the Cav3.2 gene and protein are both expressed at significant levels in the REN cell line, whereas their expression is barely detectable in mesothelial cells (Fig. 5A). Moreover, cell transfection with Cav3.2 siRNA in REN cells resulted in a lack of Cav3.2 expression, whereas cells transfected with scramble siRNA showed an expression level similar to controls (Fig. 5B).
Fig. 5.
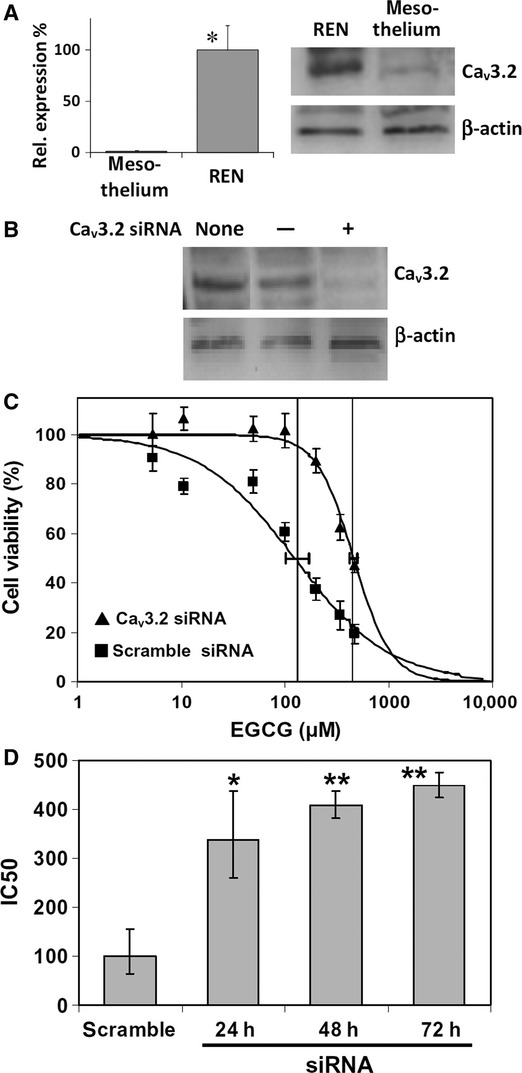
(A) Expression of the Cav3.2 calcium channel gene and Cav3.2 protein in REN and mesothelial cells. Left panel: the mRNA quantity of Cav3.2 was determined by qRT-PCR (see Materials and methods) and is represented as mean relative expression ± SD (n = 3, *P < 0.001, t-test). Right panel: Western immunoblot analysis of cell lysates showing quite detectable expression of Cav3.2 peptide in REN cells and barely detectable expression in mesothelium. (B) Western immunoblot analysis of REN cell lysates showing Cav3.2 down-regulation by RNA interference (siRNA). REN cells were transfected or not (none) with 5 μM negative control siRNA (−), or specific Cav3.2 siRNA (+), with a 24-hr interval. (C) Dose-response curves derived from the NRU endpoint, showing a significant reduction of EGCG cytotoxicity to REN cells after 72 hrs Cav3.2 siRNA, with respect to scramble siRNA, as shown by rightward IC50 shift (P < 0.05). Data are means ± SD percent cell viabilities obtained from eight replicates. Downhill logistic regression lines, IC50 values (vertical lines) and 95% CI (horizontal bars) are shown. (D) Variation of EGCG IC50 on REN cells, after 24, 48 or 72 hrs Cav3.2 siRNA, or 24 hrs scramble siRNA. Data are means IC50 obtained from three independent experiments ±95% CI. *P < 0.05, **P < 0.01, with respect to scramble siRNA, according to the Dunnett's test.
The effect of RNA interference on EGCG cytotoxicity resulted in a progressive upward shift of the IC50 derived by NRU after 24, 48 or 72 hrs siRNA, with respect to cells subjected to scramble siRNA (Fig. 5C and D). In addition, we found that Cav3.2 siRNA prevented, almost completely, the [Ca2+]i rise induced by EGCG, which was instead observable after scramble siRNA (Fig. 6A). Most importantly, we also showed that Cav3.2 siRNA was able to prevent the EGCG-induced rise in intracellular ROS, which also in this case was not affected by scramble siRNA (Fig. 6A). In agreement with these results, Cav3.2 siRNA prevented almost completely the release of LDH, and abolished the pattern of caspase 3 activation/inactivation induced by EGCG (Fig. 6B).
Fig. 6.
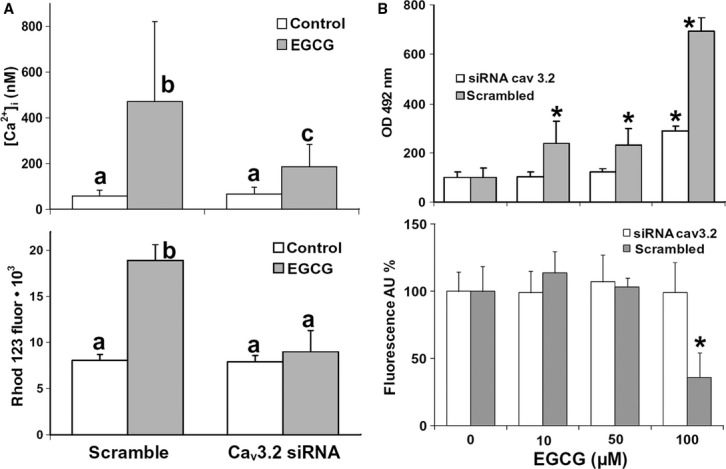
(A) Upper panel: Measurements of [Ca2+]i by confocal imaging in fluo 3-loaded REN cells exposed or not to 100 μM EGCG for 45 min. In scramble siRNA-treated cells, EGCG induces a [Ca2+]i rise similar to the one observed in unmanipulated cells, whereas Cav3.2 siRNA significantly reduces such an effect. Data are means ± SD of [Ca2+]i values recorded in single cells from two different experiments. Number of cells: 26 (control/scramble siRNA), 31 (EGCG/scramble siRNA), 28 (control/Cav3.2 siRNA), 63 (EGCG/Cav3.2 siRNA). Lower panel: ROS production in DHR 123-loaded REN cells growing in 96-well plates, evaluated by rhodamine 123 after 45-min incubations with or without 100 μM EGCG. Pre-treatment with Cav3.2 siRNA for 24 hrs abolishes the ROS increase induced by EGCG, whereas scramble siRNA does not prevent it. The results are representative of two independent experiments. Data are mean fuorescence values ± SD, n = 20. Different letters on bars indicate significant differences according to the Tukey's test (P < 0.01). (B) Upper panel: LDH release in the supernatant of REN cells pretreated with Cav3.2 siRNA, or with scramble siRNA, and then exposed to increasing EGCG concentrations for 6 hrs. Data are means ± SD derived from 6 to 8 independent treatments, and expressed as optical densities at 492 nm (see Materials and methods). Lower panel: Caspase 3 activity measured in REN cells pretreated with siRNA and exposed to EGCG as above. Data are means ± SD derived from 10 to 20 independent treatments, and expressed as fluorescence arbitrary units (see Materials and methods). *P < 0.01 with respect to control according to the Dunnett's test.
Cav3.2 is differently expressed in normal pleura and malignant pleural mesothelioma
The in vivo expression of Cav3.2 was analysed using immunohistochemistry in MMe patients with >5 years of follow-up. Paraffin-embedded, histological materials were collected from eight MMe patients, including two sarcomatous, four epithelioid and two biphasic types, and from two normal controls. Immunoreactive staining was measured as described in the Methods, and a significantly more intense signal was observed in all kinds of MMe with respect to controls (Fig. 7A). Quantitative measurements of histochemical staining confirmed higher Cav3.2 expression in MMe tissue (Fig. 7B), consistent with the in vitro finding of Cav3.2 expression in REN cells, pointed out by the above mentioned Western blot and qRT-PCR data.
Fig. 7.
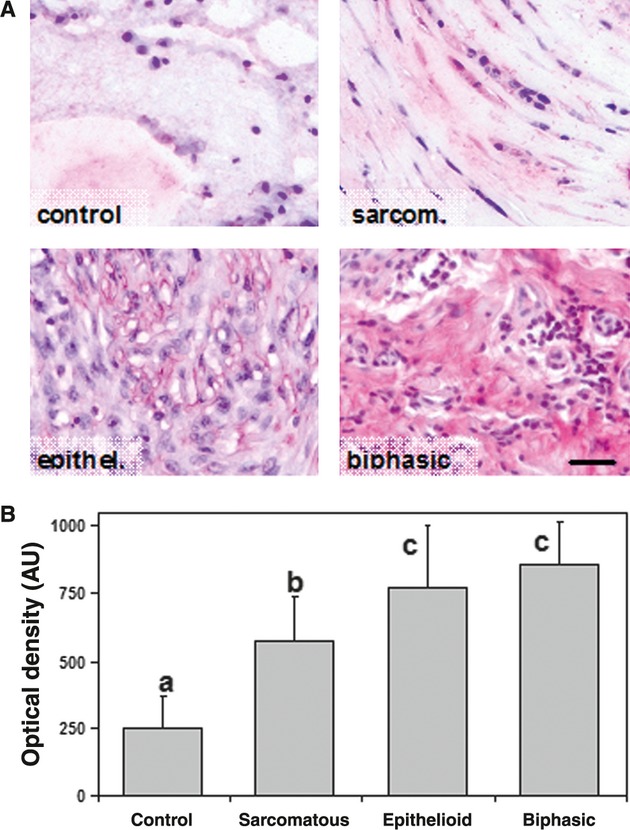
(A) Immunohistochemical staining of Cav3.2 in normal pleura and in three types of MMe tissue (sarcomatous, epithelioid and biphasic). Immunoreactivity is scarcely detected in normal pleura, but it is clearly and differentially expressed (bright pink) in tumours. Bar = 30 μm. (B) Quantification of Cav3.2 immunoreaction obtained by digital imaging of stained slides (see Materials and methods). Data are expressed as means ± SD of optical densities (n = 75–155 different microscope fields). *P < 0.01.
Discussion
In this study, we have found that EGCG exerts an MMe antitumour effect, as shown by its selective in vitro cytotoxicity on MMe cells, with respect to normal mesothelial ones. The LDH and caspase 3 assays confirmed the anti-proliferative effect of EGCG, showing the induction of both necrotic and apoptotic effects. However, the induction of necrosis was strictly dose-dependent, whereas caspase 3 activation was prevalent over necrosis at lower doses, but showed a decreasing trend down to values below controls for higher EGCG doses. The results of subsequent experiments provided a rationale for explaining such a divergent trend, as will be discussed below.
The detection of H2O2 production in cell culture medium provided a first hint for the mechanism of EGCG-induced cell damage. Release of H2O2 was detected even in the absence of cells, but occurred in higher amounts when cells were present. This confirms previous reports that catechins, although being generally known as antioxidants, may also induce oxidative stress and specifically provoke the release of H2O2 in the presence of transition metals [58–60]. Catechin pro-oxidant effects are known to be responsible for the induction of apoptosis, and are supposed to have a role in cancer prevention [61–64]. Such a view was fully confirmed by our results, showing that exogenous catalase can block or strongly reduce the anti-proliferative effects of EGCG, and moreover that it hampers the induction of cell apoptosis and necrosis, as revealed by LDH and caspase 3 assays. It is worth noting that catalase blocked caspase 3 activation at lower EGCG doses, as well as the decrease of the enzyme activity observed at higher doses, thus showing that both effects depend on extracellular H2O2 production.
The blocking of injurious effects of EGCG by exogenous catalase is clear evidence that H2O2 acts extracellularly. Hence, we had to search for mechanisms able to transduce H2O2 effects into cell death pathways. Calcium ions are central to multiple signal transduction, but anomalous elevations of [Ca2+]i can switch from physiological to cell death signal, e.g. via the disruption of mitochondrial Ca2+ equilibrium. Moreover, excess intracellular ROS is frequently intertwined with cytosolic Ca2+ increase, thus sharing a main role in driving cells towards apoptosis or necrosis. For instance, Ca2+ overload and oxidative damage from ROS production induce mPTP opening and mitochondrial dysfunction [63,64].
Our data indicate that both [Ca2+]i and ROS elevations occur in MMe cells experiencing EGCG treatments. In addition, we have also found that these events occur with higher intensity in MMe cells with respect to mesothelium, hence suggesting their involvement in the selective cytotoxicity of EGCG to MMe cells. Data of confocal calcium imaging showed that the EGCG-dependent [Ca2+]i rise in MMe cells derives from extracellular pro-oxidant effects, as shown by catalase and DTT inhibition. In addition, the inhibitory action of mibefradil and Ni2+ suggested that plasma membrane Ca2+ channels are involved.
The data of DHR 123 fluorescence showed that also ROS production within cells depends on extracellular H2O2 induced by EGCG. Most interestingly, this process seems to be mediated by [Ca2+]i through the opening of plasma membrane Ca2+ channels, as shown by prevention of ROS increase in cells preloaded with BAPTA-AM or pre-incubated with mibefradil. Hence, the ROS production triggered by EGCG appeared as a downstream effect of [Ca2+]i rise, a pathway that closely resembles what has been observed in EGCG-exposed rat hippocampal neurons [53]. Further evidence supporting this mechanism was the observation of DTT- and mibefradil-sensitive [Ca2+]i rise and ROS increase in REN cells directly exposed to H2O2.
It is known that oxidative processes can lead to Ca2+ leakage, by acting on either plasma membrane or intracellular Ca2+ channels [65,66]. In electrically non-excitable cells, the regulatory mechanism mediating Ca2+ entry is unclear, but in general, these cells do not express voltage-gated Ca2+ channels. However, it has been found that these channels are overexpressed by different tumour cells, and it has also been suggested that they promote the proliferation of malignant cells through the regulation of Ca2+ entry mechanisms [54,67,68]. Various hepatocarcinoma cell lines have been found to express one or more alpha-1, T-type Ca2+ channel subunits, although obvious T-type currents have been detected only in one of these cell types [68]. According to the supposed role of T-type channels in tumour cell growth, the possible anti-cancer use of T-type channel blockers has been investigated [69].
We have investigated the role of T-type channels as the transducing element between the EGCG-induced extracellular H2O2 release and the intracellular injurious effects observed in MMe cells. The first evidence of this mechanism was provided by the preventive action of mibefradil and Ni2+ on Ca2+ homeostasis disruption by EGCG. Hence, to achieve a more direct confirmation, we targeted the Cav3.2 isoform that is considered a major substrate for redox regulatory mechanisms. The higher expression of this channel in MMe cells, as compared to normal mesothelium, provided a first rationale for the selective toxicity mechanism of EGCG to MMe cells. However, definitive evidence derived from the ability of Cav3.2 siRNA to inhibit all the observed effects of EGCG, from cytotoxicity endpoints to intracellular [Ca2+]i and ROS increases. These results are quite consistent with the strong reduction of EGCG cytotoxicity observed in MMe cells pre-incubated with mibefradil.
Consistent with the above findings, Cav3.2 siRNA was also able to lower LDH release and drastically modify the pattern of caspase 3 activation by EGCG. Data of caspase 3 under Cav3.2 siRNA are similar to those observed in the presence of CAT, as they show a lack of caspase 3 activation at low EGCG concentrations, but also of the scaling down of caspase 3 activity at higher doses of catechin. Hence, by putting all data together, we can suggest that low EGCG doses (<50 μM) would lead to moderate intracellular Ca2+ rise and ROS production, thus inducing caspase 3 activation followed by apoptosis. Conversely, at higher EGCG doses, severe injury following strong Ca2+ alteration and ROS production would upset cell functioning, thereby leading to massive cell necrosis and the disappearance of caspase 3 activity.
In conclusion, we have reconstructed a selective mechanism of EGCG toxicity to MMe cells, based on the expression in these cells of T-type Ca2+ channels (Fig. 8). The mechanism can be summarized as follows:
Fig. 8.
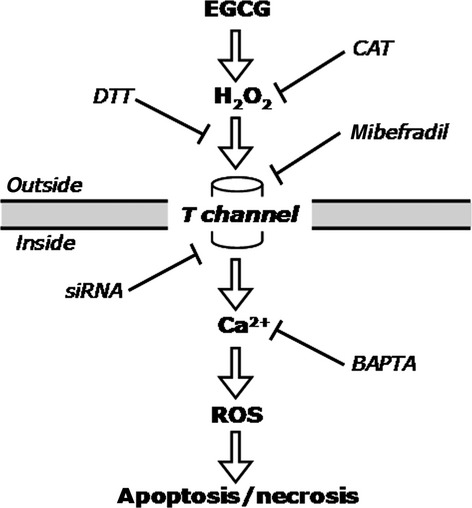
Diagram depicting the mechanism of action of EGCG on MMe cells, as characterized in this study (see text for further explanation).
EGCG induces H2O2 release at the outside of cells;
H2O2 acts by inducing T-channel opening at the plasma membrane;
Ca2+ leakage into the cytosol causes [Ca2+]i rise and triggers ROS production;
Ca2+ and ROS cooperate in inducing either apoptosis or necrosis, depending on damage.
Hence, our data have demonstrated for the first time that EGCG can selectively inhibit the proliferation of MMe cells and moreover that T-type Ca2+ channels are involved in the mechanism of action of the green tea polyphenol. In addition, we have also provided evidence that T channels are expressed in the cancerous tissue of MMe patients at higher levels than in normal pleura. On the basis of these data, we are proposing T channels as a novel potential therapeutic target for this chemoresistant tumour, a poor-prognosis disease that still lacks an efficient therapy.
Acknowledgments
This work was supported by Fondazione Buzzi Unicem, Casale Monferrato, Italy. ER is recipient of a Research Fellowship from the University of Piemonte Orientale, Alessandria, Italy. SM is recipient of a PhD scholarship from the Italian Ministry of University and Research (MIUR).
Conflict of interest
The authors confirm that there are no conflicts of interest.
References
- 1.Pass HI, Vogelzang N, Hahn S, et al. Malignant pleural mesothelioma. Curr Probl Cancer. 2004;28:93–174. doi: 10.1016/j.currproblcancer.2004.04.001. [DOI] [PubMed] [Google Scholar]
- 2.Belli C, Fennell D, Giovannini M, et al. Malignant pleural mesothelioma: current treatments and emerging drugs. Expert Opin Emerg Drugs. 2009;14:423–37. doi: 10.1517/14728210903074563. [DOI] [PubMed] [Google Scholar]
- 3.Sueoka E, Sueoka N, Okabe S, et al. Expression of the tumour necrosis factor alpha gene and early response genes by nodularin, a liver tumour promoter, in primary cultured rat hepatocytes. J Cancer Res Clin Oncol. 1997;123:413–9. doi: 10.1007/BF01372544. [DOI] [PubMed] [Google Scholar]
- 4.Tomek S, Emri S, Krejcy K, Manegold C. Chemotherapy for malignant pleural mesothelioma: past results and recent developments. Br J Cancer. 2003;88:167–74. doi: 10.1038/sj.bjc.6600673. [DOI] [PMC free article] [PubMed] [Google Scholar]
- 5.Fennell DA, Gaudino G, O'Byrne KJ, et al. Advances in the systemic therapy of malignant pleural mesothelioma. Nat Clin Pract Oncol. 2008;5:136–47. doi: 10.1038/ncponc1039. [DOI] [PubMed] [Google Scholar]
- 6.Tsiouris A, Gourgoulianis KI, Walesby RK. Current trends in the management of malignant pleural mesothelioma. Expert Rev Anticancer Ther. 2006;6:831–3. doi: 10.1586/14737140.6.6.831. [DOI] [PubMed] [Google Scholar]
- 7.Martinotti S, Ranzato E, Burlando B. In vitro screening of synergistic ascorbate-drug combinations for the treatment of malignant mesothelioma. Toxicol In Vitro. 2011;25:1568–74. doi: 10.1016/j.tiv.2011.05.023. [DOI] [PubMed] [Google Scholar]
- 8.Verrax J, Calderon PB. Pharmacologic concentrations of ascorbate are achieved by parenteral administration and exhibit antitumoural effects. Free Radic Biol Med. 2009;47:32–40. doi: 10.1016/j.freeradbiomed.2009.02.016. [DOI] [PubMed] [Google Scholar]
- 9.Ranzato E, Biffo S, Burlando B. Selective ascorbate toxicity in malignant mesothelioma: a redox Trojan mechanism. Am J Respir Cell Mol Biol. 2011;44:108–17. doi: 10.1165/rcmb.2009-0340OC. [DOI] [PubMed] [Google Scholar]
- 10.Ozben T. Oxidative stress and apoptosis: impact on cancer therapy. J Pharmacol Sci. 2007;96:2181–96. doi: 10.1002/jps.20874. [DOI] [PubMed] [Google Scholar]
- 11.Ahmad N, Feyes DK, Nieminen AL, et al. Green tea constituent epigallocatechin-3-gallate and induction of apoptosis and cell cycle arrest in human carcinoma cells. J Natl Cancer Inst. 1997;89:1881–6. doi: 10.1093/jnci/89.24.1881. [DOI] [PubMed] [Google Scholar]
- 12.Nihal M, Ahsan H, Siddiqui IA, et al. (−)-Epigallocatechin-3-gallate (EGCG) sensitizes melanoma cells to interferon induced growth inhibition in a mouse model of human melanoma. Cell Cycle. 2009;8:2057–63. doi: 10.4161/cc.8.13.8862. [DOI] [PMC free article] [PubMed] [Google Scholar]
- 13.Kemberling JK, Hampton JA, Keck RW, et al. Inhibition of bladder tumour growth by the green tea derivative epigallocatechin-3-gallate. J Urol. 2003;170:773–6. doi: 10.1097/01.ju.0000081278.64511.96. [DOI] [PubMed] [Google Scholar]
- 14.Wu PP, Kuo SC, Huang WW, et al. (−)-Epigallocatechin gallate induced apoptosis in human adrenal cancer NCI-H295 cells through caspase-dependent and caspase-independent pathway. Anticancer Res. 2009;29:1435–42. [PubMed] [Google Scholar]
- 15.Hibasami H, Achiwa Y, Fujikawa T, Komiya T. Induction of programmed cell death (apoptosis) in human lymphoid leukemia cells by catechin compounds. Anticancer Res. 1996;16:1943–6. [PubMed] [Google Scholar]
- 16.Hsieh DS, Wang H, Tan SW, et al. The treatment of bladder cancer in a mouse model by epigallocatechin-3-gallate-gold nanoparticles. Biomaterials. 2011;32:7633–40. doi: 10.1016/j.biomaterials.2011.06.073. [DOI] [PubMed] [Google Scholar]
- 17.Chen ZP, Schell JB, Ho CT, Chen KY. Green tea epigallocatechin gallate shows a pronounced growth inhibitory effect on cancerous cells but not on their normal counterparts. Cancer Lett. 1998;129:173–9. doi: 10.1016/s0304-3835(98)00108-6. [DOI] [PubMed] [Google Scholar]
- 18.Chen L, Zhang HY. Cancer preventive mechanisms of the green tea polyphenol (−)-epigallocatechin-3-gallate. Molecules. 2007;3:946–57. doi: 10.3390/12050946. [DOI] [PMC free article] [PubMed] [Google Scholar]
- 19.Chen D, Wan SB, Yang H, et al. EGCG, green tea polyphenols and their synthetic analogs and prodrugs for human cancer prevention and treatment. Adv Clin Chem. 2011;53:155–77. doi: 10.1016/b978-0-12-385855-9.00007-2. [DOI] [PMC free article] [PubMed] [Google Scholar]
- 20.Yang CS, Wang X. Green tea and cancer prevention. Nutr Cancer. 2010;62:931–7. doi: 10.1080/01635581.2010.509536. [DOI] [PubMed] [Google Scholar]
- 21.Patra SK, Rizzi F, Silva A, et al. Molecular targets of (−)-epigallocatechin-3-gallate (EGCG): specificity and interaction with membrane lipid rafts. J Physiol Pharmacol. 2008;59:217–35. [PubMed] [Google Scholar]
- 22.Tan X, Hu D, Li S, et al. Differences of four catechins in cell cycle arrest and induction of apoptosis in LoVo cells. Cancer Lett. 2000;158:1–6. doi: 10.1016/s0304-3835(00)00445-6. [DOI] [PubMed] [Google Scholar]
- 23.Kang HG, Jenabi JM, Liu XF, et al. Inhibition of the insulin-like growth factor I receptor by epigallocatechin gallate blocks proliferation and induces the death of Ewing tumour cells. Mol Cancer Ther. 2010;9:1396–407. doi: 10.1158/1535-7163.MCT-09-0604. [DOI] [PubMed] [Google Scholar]
- 24.Duhon D, Bigelow RL, Coleman DT, et al. The polyphenol epigallocatechin-3-gallate affects lipid rafts to block activation of the c-Met receptor in prostate cancer cells. Mol Carcinog. 2010;49:739–49. doi: 10.1002/mc.20649. [DOI] [PubMed] [Google Scholar]
- 25.Kim CH, Moon SK. Epigallocatechin-3-gallate causes the p21/WAF1-mediated G(1)-phase arrest of cell cycle and inhibits matrix metalloproteinase-9 expression in TNF-alpha-induced vascular smooth muscle cells. Arch Biochem Biophys. 2005;15:264–72. doi: 10.1016/j.abb.2004.12.022. [DOI] [PubMed] [Google Scholar]
- 26.Yamakawa S, Asai T, Uchida T, et al. (−)-Epigallocatechin gallate inhibits membrane-type 1 matrix metalloproteinase, MT1-MMP, and tumour angiogenesis. Cancer Lett. 2004;210:47–55. doi: 10.1016/j.canlet.2004.03.008. [DOI] [PubMed] [Google Scholar]
- 27.Landis-Piwowar KR, Kuhn DJ, Wan SB, et al. Evaluation of proteasome-inhibitory and apoptosis-inducing potencies of novel (−)-EGCG analogs and their prodrugs. Int J Mol Med. 2005;15:735–42. [PubMed] [Google Scholar]
- 28.Kim J, Zhang X, Rieger-Christ KM, et al. Suppression of Wnt signaling by the green tea compound (−)-epigallocatechin 3-gallate (EGCG) in invasive breast cancer cells. Requirement of the transcriptional repressor HBP1. J Biol Chem. 2006;281:10865–75. doi: 10.1074/jbc.M513378200. [DOI] [PubMed] [Google Scholar]
- 29.Tran PL, Kim SA, Choi HS, et al. Epigallocatechin-3-gallate suppresses the expression of HSP70 and HSP90 and exhibits anti-tumour activity in vitro and in vivo. BMC Cancer. 2010;10:276. doi: 10.1186/1471-2407-10-276. [DOI] [PMC free article] [PubMed] [Google Scholar]
- 30.Sukhthankar M, Alberti S, Baek SJ. (−)-Epigallocatechin-3-gallate (EGCG) post transcriptionally and post-translationally suppresses the cell proliferative protein TROP2 in human colorectal cancer cells. Anticancer Res. 2010;30:2497–503. [PubMed] [Google Scholar]
- 31.Adachi S, Shimizu M, Shirakami Y, et al. (−)-Epigallocatechin gallate downregulates EGF receptor via phosphorylation at Ser 1046/1047 by p38 MAPK in colon cancer cells. Carcinogenesis. 2009;30:1544–52. doi: 10.1093/carcin/bgp166. [DOI] [PubMed] [Google Scholar]
- 32.Fujiki H, Suganuma M, Okabe S, et al. Cancer inhibition by green tea. Mutat Res. 1998;402:307–10. doi: 10.1016/s0027-5107(97)00310-2. [DOI] [PubMed] [Google Scholar]
- 33.Yang WH, Fong YC, Lee CY, et al. Epigallocatechin-3-gallate induces cell apoptosis of human chondrosarcoma cells through apoptosis signal-regulating kinase 1 pathway. J Cell Biochem. 2011;112:1601–11. doi: 10.1002/jcb.23072. [DOI] [PubMed] [Google Scholar]
- 34.Shi X, Ding M, Dong Z, et al. Antioxidant properties of aspirin: characterization of the ability of aspirin to inhibit silica-induced lipid peroxidation, DNA damage, NF-kappaB activation, and TNF-alpha production. Mol Cell Biochem. 1999;199:93–102. doi: 10.1023/a:1006934612368. [DOI] [PubMed] [Google Scholar]
- 35.Lambert JD, Elias RJ. The antioxidant and pro-oxidant activities of green tea polyphenols: a role in cancer prevention. Arch Biochem Biophys. 2010;501:65–72. doi: 10.1016/j.abb.2010.06.013. [DOI] [PMC free article] [PubMed] [Google Scholar]
- 36.Li GX, Chen YK, Hou Z, et al. Pro-oxidative activities and dose-response relationship of (−)-epigallocatechin-3-gallate in the inhibition of lung cancer cell growth: a comparative study in vivo and in vitro. Carcinogenesis. 2010;31:902–10. doi: 10.1093/carcin/bgq039. [DOI] [PMC free article] [PubMed] [Google Scholar]
- 37.Vittal R, Selvanayagam ZE, Sun Y, et al. Gene expression changes induced by green tea polyphenol (−)-epigallocatechin-3-gallate in human bronchial epithelial 21BES cells analyzed by DNA microarray. Mol Cancer Ther. 2004;3:1091–9. [PubMed] [Google Scholar]
- 38.Azam S, Hadi N, Khan NU, Hadi SM. Prooxidant property of green tea polyphenols epicatechin and epigallocatechin-3-gallate: implications for anticancer properties. Toxicol In Vitro. 2004;18:555–61. doi: 10.1016/j.tiv.2003.12.012. [DOI] [PubMed] [Google Scholar]
- 39.Yamamoto T, Hsu S, Lewis J, et al. Green tea polyphenol causes differential oxidative environments in tumour versus normal epithelial cells. J Pharmacol Exp Ther. 2003;307:230–6. doi: 10.1124/jpet.103.054676. [DOI] [PubMed] [Google Scholar]
- 40.Galati G, Lin A, Sultan AM, O'Brien PJ. Cellular and in vivo hepatotoxicity caused by green tea phenolic acids and catechins. Free Radic Biol Med. 2006;40:570–80. doi: 10.1016/j.freeradbiomed.2005.09.014. [DOI] [PubMed] [Google Scholar]
- 41.Hong J, Lu H, Meng X, et al. Stability, cellular uptake, biotransformation, and efflux of tea polyphenol (−)-epigallocatechin-3-gallate in HT-29 human colon adenocarcinoma cells. Cancer Res. 2002;62:7241–6. [PubMed] [Google Scholar]
- 42.Bertino P, Piccardi F, Porta C, et al. Imatinib mesylate enhances therapeutic effects of gemcitabine in human malignant mesothelioma xenografts. Clin Cancer Res. 2008;14:541–8. doi: 10.1158/1078-0432.CCR-07-1388. [DOI] [PubMed] [Google Scholar]
- 43.Orengo AM, Spoletini L, Procopio A, et al. Establishment of four new mesothelioma cell lines: characterization by ultrastructural and immunophenotypic analysis. Eur Respir J. 1999;13:527–34. doi: 10.1183/09031936.99.13352799. [DOI] [PubMed] [Google Scholar]
- 44.Orecchia S, Schillaci F, Salvio M, et al. Aberrant E-cadherin and gamma-catenin expression in malignant mesothelioma and its diagnostic and biological relevance. Lung Cancer. 2004;45:37–43. doi: 10.1016/j.lungcan.2004.04.027. [DOI] [PubMed] [Google Scholar]
- 45.Dickson MA, Hahn WC, Ino Y, et al. Human keratinocytes that express hTERT and also bypass a p16(INK4a)-enforced mechanism that limits life span become immortal yet retain normal growth and differentiation characteristics. Mol Cell Biol. 2000;20:1436–47. doi: 10.1128/mcb.20.4.1436-1447.2000. [DOI] [PMC free article] [PubMed] [Google Scholar]
- 46.Legrand C, Bour JM, Jacob C, et al. Lactate dehydrogenase (LDH) activity of the cultured eukaryotic cells as marker of the number of dead cells in the medium. J Biotechnol. 1992;25:231–43. doi: 10.1016/0168-1656(92)90158-6. [DOI] [PubMed] [Google Scholar]
- 47.Yermolaieva O, Brot N, Weissbach H, et al. Reactive oxygen species and nitric oxide mediate plasticity of neuronal calcium signaling. Proc Natl Acad Sci USA. 2000;97:448–53. doi: 10.1073/pnas.97.1.448. [DOI] [PMC free article] [PubMed] [Google Scholar]
- 48.Grynkiewicz G, Poenie M, Tsien RY. A new generation of Ca2+ indicators with greatly improved fluorescence properties. J Biol Chem. 1985;260:3440–50. [PubMed] [Google Scholar]
- 49.Churg A, Roggli V, Galateau-Salle F, et al. Tumours of the pleura: mesothelial tumours. In: Travis WD, Brambilla E, Müller-Hermelink E, et al., editors. World Health Organization classification of tumours, vol 10: pathology and genetics of tumours of the lung, pleura, thymus and heart. Lyon, France: IARC Press; 2004. pp. 128–44. [Google Scholar]
- 50.Barnes M, Correll R, Stevens D. 2003. A simple spreadsheet for estimating low-effect concentrations and associated logistic dose response curves. Solutions to pollution: Program abstract book. The Society of Environmental Toxicology and Chemistry Asia/Pacific – Australasian Society of Ecotoxicology 2003, SETAC ASE Asia Pacific.
- 51.Nakagawa H, Hasumi K, Woo JT, et al. Generation of hydrogen peroxide primarily contributes to the induction of Fe(II)-dependent apoptosis in Jurkat cells by (−)-epigallocatechin gallate. Carcinogenesis. 2004;25:1567–74. doi: 10.1093/carcin/bgh168. [DOI] [PubMed] [Google Scholar]
- 52.Lambeth D. NOX enzymes and the biology of reactive oxygen. Nat Rev Immunol. 2004;4:181–9. doi: 10.1038/nri1312. [DOI] [PubMed] [Google Scholar]
- 53.Yin ST, Tang ML, Deng HM, et al. Epigallocatechin-3-gallate induced primary cultures of rat hippocampal neurons death linked to calcium overload and oxidative stress. Naunyn Schmiedebergs Arch Pharmacol. 2009;379:551–64. doi: 10.1007/s00210-009-0401-4. [DOI] [PubMed] [Google Scholar]
- 54.Taylor JT, Zeng XB, Pottle JE, et al. Calcium signaling and T-type calcium channels in cancer cell cycling. World J Gastroenterol. 2008;14:4984–91. doi: 10.3748/wjg.14.4984. [DOI] [PMC free article] [PubMed] [Google Scholar]
- 55.Michels G, Matthes J, Handrock R, et al. Single-channel pharmacology of mibefradil in human native T-type and recombinant Ca(v)3.2 calcium channels. Mol Pharmacol. 2002;61:682–94. doi: 10.1124/mol.61.3.682. [DOI] [PubMed] [Google Scholar]
- 56.Obejero-Paz CA, Gray IP, Jones SW. Ni2+ block of CaV3.1 (alpha1G) T-type calcium channels. J Gen Physiol. 2008;132:239–50. doi: 10.1085/jgp.200809988. [DOI] [PMC free article] [PubMed] [Google Scholar]
- 57.Joksovic PM, Nelson MT, Jevtovic-Todorovic V, et al. CaV3.2 is the major molecular substrate for redox regulation of T-type Ca2+ channels in the rat and mouse thalamus. J Physiol. 2006;574:415–30. doi: 10.1113/jphysiol.2006.110395. [DOI] [PMC free article] [PubMed] [Google Scholar]
- 58.Oikawa S, Furukawaa A, Asada H, et al. Catechins induce oxidative damage to cellular and isolated DNA through the generation of reactive oxygen species. Free Radic Res. 2003;37:881–90. doi: 10.1080/1071576031000150751. [DOI] [PubMed] [Google Scholar]
- 59.Sakagami H, Arakawa H, Maeda M, et al. Production of hydrogen peroxide and methionine sulfoxide by epigallocatechin gallate and antioxidants. Anticancer Res. 2001;21:2633–41. [PubMed] [Google Scholar]
- 60.Lopez-Lazaro M, Calderon-Montano JM, Burgos-Moron E, Austin CA. Green tea constituents (−)-epigallocatechin-3-gallate (EGCG) and gallic acid induce topoisomerase I- and topoisomerase II-DNA complexes in cells mediated by pyrogallol-induced hydrogen peroxide. Mutagenesis. 2011;26:489–98. doi: 10.1093/mutage/ger006. [DOI] [PubMed] [Google Scholar]
- 61.Chacon E, Acosta D. Mitochondrial regulation of superoxide by Ca2+: an alternate mechanism for the cardiotoxicity of doxorubicin. Toxicol Appl Pharmacol. 1991;107:117–28. doi: 10.1016/0041-008x(91)90336-d. [DOI] [PubMed] [Google Scholar]
- 62.Simon HU, Haj-Yehia A, Levi-Schaffer F. Role of reactive oxygen species (ROS) in apoptosis induction. Apoptosis. 2000;5:415–8. doi: 10.1023/a:1009616228304. [DOI] [PubMed] [Google Scholar]
- 63.Peng TI, Jou MJ. Oxidative stress caused by mitochondrial calcium overload. Ann N Y Acad Sci. 2010;1201:183–8. doi: 10.1111/j.1749-6632.2010.05634.x. [DOI] [PubMed] [Google Scholar]
- 64.Hool LC, Corry B. Redox control of calcium channels: from mechanisms to therapeutic opportunities. Antioxid Redox Signal. 2007;9:409–35. doi: 10.1089/ars.2006.1446. [DOI] [PubMed] [Google Scholar]
- 65.Hidalgo C, Bull R, Marengo JJ, et al. SH oxidation stimulates calcium release channels (ryanodine receptors) from excitable cells. Biol Res. 2000;33:113–24. doi: 10.4067/s0716-97602000000200011. [DOI] [PubMed] [Google Scholar]
- 66.Gray LS, Perez-Reyes E, Gomora JC, et al. The role of voltage gated T-type Ca2+ channel isoforms in mediating “capacitative” Ca2+ entry in cancer cells. Cell Calcium. 2004;36:489–97. doi: 10.1016/j.ceca.2004.05.001. [DOI] [PubMed] [Google Scholar]
- 67.Mariot P, Vanoverberghe K, Lalevee N, et al. Overexpression of an alpha 1H (Cav3.2) T-type calcium channel during neuroendocrine differentiation of human prostate cancer cells. J Biol Chem. 2002;277:10824–33. doi: 10.1074/jbc.M108754200. [DOI] [PubMed] [Google Scholar]
- 68.Li Y, Liu S, Lu F, et al. A role of functional T-type Ca2+ channel in hepatocellular carcinoma cell proliferation. Oncol Rep. 2009;225:1229–35. doi: 10.3892/or_00000559. [DOI] [PubMed] [Google Scholar]
- 69.Heo JH, Seo HN, Choe YJ, et al. T-type Ca2+ channel blockers suppress the growth of human cancer cells. Bioorg Med Chem Lett. 2008;18:3899–901. doi: 10.1016/j.bmcl.2008.06.034. [DOI] [PubMed] [Google Scholar]