

Our results indicate that, after years of increasing screening mammography utilization in Vermont, there was a decline in screening, which coincided with the release of the 2009 U.S. Preventive Services Task Force recommendations.
Abstract
Purpose
To determine whether the 2009 U.S. Preventive Services Task Force (USPSTF) guidelines for breast cancer mammography screening were followed by changes in screening utilization in the state of Vermont.
Materials and Methods
This retrospective study was HIPAA compliant and approved by the institutional review board, with waiver of informed consent. Trends in screening mammography utilization during 1997–2011 were examined among approximately 150 000 women aged 40 years and older in the state of Vermont using statewide mammography registry data.
Results
The percentage of Vermont women aged 40 years and older screened in the past year declined from 45.3% in 2009% to 41.6% in 2011 (an absolute decrease of −3.7 percentage points; 95% confidence interval [CI]: −3.3, −4.1). The largest decline in utilization was among women aged 40–49 years (−4.8 percentage points; 95% CI: −4.1, −5.4), although substantial declines were also observed among women aged 50–74 years (−3.0 percentage points; 95% CI: −2.6, −3.5) and women aged 75 years and older (−3.1 percentage points; 95% CI: −2.3, −4.0). The percentage of women aged 50–74 years screened within the past 2 years declined by −3.4 percentage points (95% CI: −3.0, −3.9) from 65.4% in 2009 to 61.9% in 2011.
Conclusion
After years of increasing screening mammography utilization in Vermont, there was a decline in screening, which coincided with the release of the 2009 USPSTF recommendations. The age-specific patterns in utilization were generally consistent with the USPSTF recommendations, although there was also evidence that the percentage of women aged 50–74 years screened in the past 2 years declined since 2009.
© RSNA, 2013
Introduction
In November 2009, the U.S. Preventive Services Task Force (USPSTF) revised its guidelines for breast cancer screening mammography (1). In a change to its 2002 guidelines, the influential group no longer recommended routine mammography screening for women between the ages of 40–49 years but instead stated that the decision to start screening should “be an individual one and take into account patient context, including the patient’s values regarding specific benefits and harms” (1). The panel also recommended biennial rather than annual mammography for women aged 50–74 years, having concluded that biennial screening maintains most of the benefits associated with screening mammography while reducing the harms substantially (1). These changes generated extensive controversy in both the scientific literature and public media (2–5). While there has been extended debate in regard to the potential effect of the revised guidelines on women’s health, there is limited evidence to date in regard to actual changes in screening mammography utilization following these new recommendations.
The most frequently cited data on trends in utilization of screening mammography come from self-reported interview or survey data. The National Health Interview Survey observed a steady increase in mammography utilization throughout the 1980s and 1990s, before reaching a plateau around the year 2000 (6). Since 2000, the percentage of women aged 40 years and older who report having undergone mammography within the past 2 years has held steady at 65%–70% (6), and self-reported rates of mammography utilization did not change significantly within any examined age group between 2008 and 2011 (7).
Limitations to national survey data include the lack of distinction between screening and diagnostic mammography and the tendency for women to substantially overreport their utilization of mammography (8,9). In addition, incomplete response rates in survey studies can lead to bias if nonrespondents have lower screening utilization than those who choose to participate. The results of prior analyses of mammography registry data indicate that self-reported estimates of mammography rates are 15–25 percentage points higher than actual screening mammography rates (10,11).
Our purpose was to determine whether the 2009 USPSTF guidelines for breast cancer mammography screening were followed by changes in screening utilization in the state of Vermont.
Materials and Methods
Study Population
This retrospective study was Health Insurance Portability and Accountability Act compliant, and the institutional review board at our institution approved this study, with a waiver of informed consent. The Vermont Breast Cancer Surveillance System has collected statewide mammography data in Vermont since 1994. The Vermont Breast Cancer Surveillance System has been a member of the National Breast Cancer Surveillance System (12) since its inception, and recently it joined the National Cancer Institute’s newly formed Population-based Research Optimizing Screening through Personalized Regimens, or PROSPR, initiative (13). The catchment area for the Vermont Breast Cancer Surveillance System includes all breast imaging facilities located within the state of Vermont. One of the 15 facilities in the state provided incomplete data for this study in regard to the indication for examination (screening vs diagnostic) during portions of the study period and, thus, was excluded from this analysis. Analyses were restricted to 1997–2011 for which data capture was complete and were limited to women aged 40 years and older.
Data Collection
Women undergoing mammography at each facility in the state complete a demographic and health history questionnaire during their clinic visit. Radiologists and mammography technologists provide information about mammography, including the indication for the examination (ie, screening or diagnostic). The facility contributes this data in a standardized fashion on paper forms or in electronic files.
Female population denominators according to age group were obtained from the U.S. Census Bureau’s intercensal estimates released in 2000 and 2010 (14). The health service area (15) for the one mammography facility that was excluded from this analysis consists of a single county that includes about 10% of the state’s population. The population of this county was subtracted from statewide population estimates to determine the effective population denominator for the mammography data included in this study.
Statistical Analyses
The percentage of women who underwent screening mammography in a given year was estimated by dividing the number of women with a record of screening mammography in that year by the corresponding population denominator. Likewise, the percentage of women screened in the past 2 years was estimated by dividing the number of women with a record of screening mammography in the current or prior year by the corresponding population denominator for the current year. Each woman was only counted once in the numerator, even if she underwent multiple screening examinations in a single year or in the 2-year period. Overall percentages for women aged 40 years and older were age adjusted to the year 2000 U.S. standard population (16), and 95% confidence intervals (CIs) were produced by using the standard error of the estimates. We used join-point software (Joinpoint version 4.0.1; National Cancer Institute, Bethesda, Md) to identify significant changes in screening mammography utilization trends during 1997–2011 and to estimate the average annual percentage change in screening utilization and its 95% CI for each segment (17). Models were parameterized to run weighted least squares regression, with use of calendar year as the independent variable and the natural logarithm of the screening rate as the dependent variable. A maximum of two join points were allowed, and each model chose the line of best fit by using a sequence of permutation tests that ensured an overall type I error rate of less than .05 (17). Because we hypothesized a change in utilization following the 2009 USPSTF guidelines, we also compared the change in utilization of screening mammography between 2009 and 2011 by using absolute and relative measures of change, with 95% CIs constructed by using the standard error of each estimate.
Results according to screening interval were obtained by classifying each woman who had undergone screening mammography in a given year by the time elapsed since she underwent her most recent prior screening mammography examination. The interval between screening mammography examinations was classified as annual (≤18 months), biennial (19–30 months), or longer (>30 months or no previous screening mammography examination). These categories were chosen to correspond with accepted definitions of screening interval in practice (18). This selection of categories differs from the approach described above in regard to the undergoing of screening in the past 1 or 2 years that corresponds to questionnaire items frequently used to assess mammography utilization (19).
Results
The age-adjusted percentage of women aged 40 years and older who underwent screening mammography in a given year in Vermont increased steadily from 34.5% in 1997 to 45.3% in 2009, while the percentage of women who underwent screening mammography within the past 2 years increased from 52.5% in 1998 to 59.6% in 2009 (Table 1). Significant changes in both trends occurred in 2009 (Fig 1). The percentage of women aged 40 years and older who were screened in the past year increased at an average annual percentage change of 1.8% (95% CI: 1.2, 2.3) during 1997–2009 and declined annually by 4.4% (annual percentage change, −4.4%; 95% CI: −12.2, 3.9) during 2009–2011. The percentage of women aged 40 years and older who were screened in the past 2 years increased at an average annual percentage change of 0.8% (95% CI: 0.4, 1.2) during 1998–2009 and declined annually by 3.4% during 2009–2011 (annual percentage change, −3.4%; 95% CI: −8.4, 2.0). In 2011, 41.6% of women aged 40 years and older were screened in the past year and 54.9% were screened within the past 2 years.
Table 1.
Utilization of Screening Mammography among Vermont Women Aged 40 Years and Older according to Year
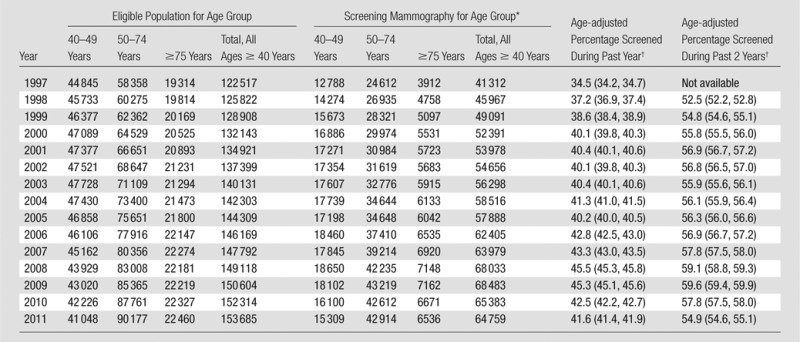
Restricted to one screening mammography examination per woman per year.
Age adjusted to year 2000 U.S. standard population for women aged 40 years and older. Numbers in parentheses are 95% CIs.
Figure 1:
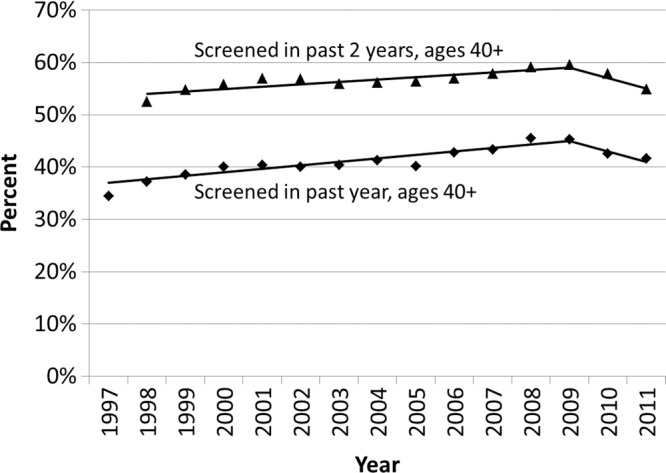
Observed trends in the age-adjusted percentage of Vermont women aged 40 years and older who underwent screening mammography in the past year and past 2 years. Solid lines depict the best fits from the join-point analyses.
Similar qualitative patterns were observed among each age group, with increases in utilization occurring between 1997 and 2009, followed by declines in 2010 and 2011 (Fig 2). Among each age group, in 2009, there was a significant change in the trend in the percentage of women who were screened in the past year (Fig 2a). While similar declines in the percentage of women who were screened in the past 2 years were also observed following 2009, there was no significant change in the trend for women aged 50–74 years (Fig 2b).
Figure 2a:
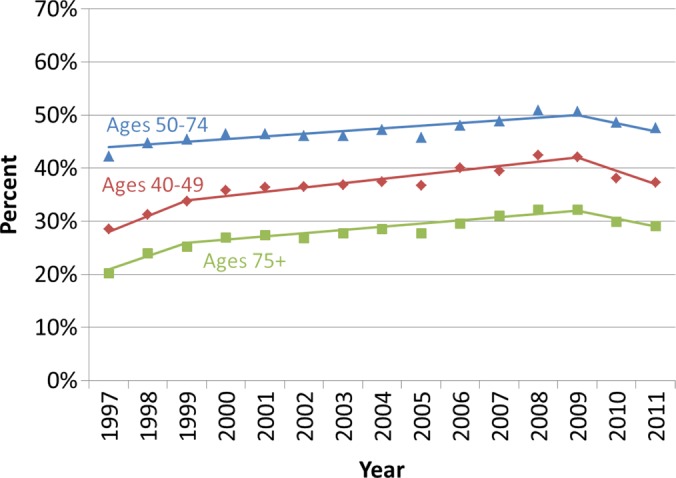
Observed trends in the percentage of Vermont women who underwent screening mammography (a) in the past year and (b) past 2 years according to age group. Solid lines depict the best fits from the join-point analyses.
Figure 2b:
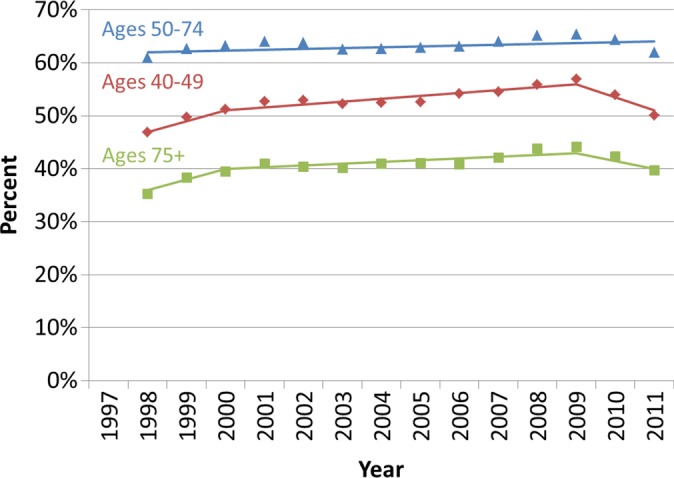
Observed trends in the percentage of Vermont women who underwent screening mammography (a) in the past year and (b) past 2 years according to age group. Solid lines depict the best fits from the join-point analyses.
The age-adjusted percentage of women aged 40 years and older who underwent screening mammography in a given year declined from 45.3% in 2009 to 41.6% in 2011, representing an absolute decline of −3.7 percentage points (95% CI: −3.3, −4.1) or an −8.2% relative decline (95% CI: −7.4, −8.9) (Table 2). The percentage of women aged 40 years and older who were screened in the past 2 years declined from 59.6% in 2009 to 54.9% in 2011, equivalent to an absolute decline of −4.8 percentage points (95% CI: −4.4, −5.1) or an −8.0% relative decline (95% CI: −7.4, −8.5). The decline in screening utilization during 2009–2011 was higher among women aged 40–49 years (absolute decline of −4.8 percentage points in the fraction of women screened within the past year; 95% CI: −4.1, −5.4) than among women in other age groups (as indicated by their nonoverlapping CIs). Declines were also observed among women aged 50–74 years (−3.0 percentage points; 95% CI: −2.6, −3.5) and women aged 75 years or older (−3.1 percentage points; 95% CI: −2.3, −4.0). The percentage of women aged 50–74 years who were screened within the past 2 years declined by −3.4 percentage points (95% CI: −3.0, −3.9) from 65.4% in 2009 to 61.9% in 2011.
Table 2.
Change in Utilization of Screening Mammography in Vermont between 2009 and 2011
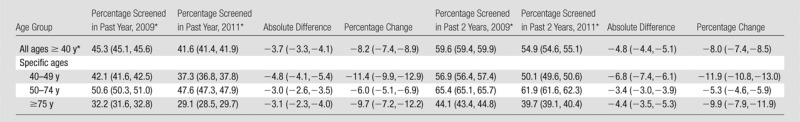
Note.—Numbers in parentheses are 95% CIs.
Age adjusted to the year 2000 U.S. standard population.
Results of analyses according to screening interval indicated declines in annual screening mammography after 2009 without increases in biennial screening (Fig 3a). In 2011, 28.6% (95% CI: 28.4, 28.8) of women aged 40 years and older underwent annual screening mammography, compared with 31.6% (95% CI: 31.4, 31.8) in 2009. The percentage of women undergoing biennial screening mammography was similar in 2009 (5.7%; 95% CI: 5.5, 5.8) and 2011 (5.8%; 95% CI: 5.7, 5.9). The proportion of women undergoing screening mammography longer than 30 months since prior screening mammography declined from 8.1% (95% CI: 7.9, 8.2) in 2009 to 7.2% (95% CI: 7.0, 7.3) in 2011.
Figure 3a:
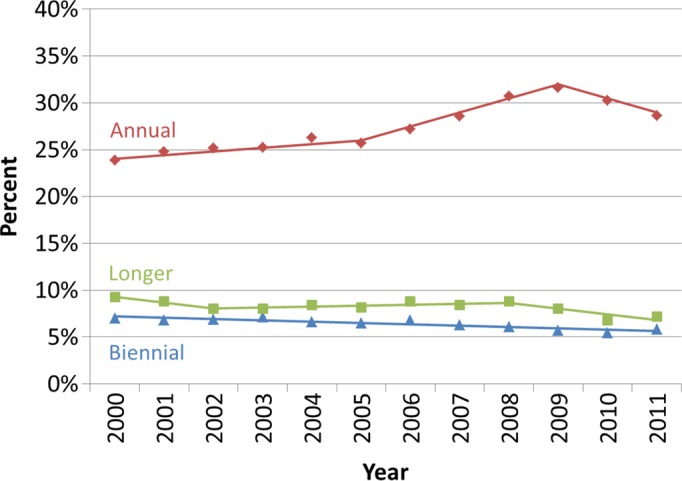
Utilization of screening mammography in Vermont according to screening interval. (a) Observed age-adjusted percentage of Vermont women aged 40 years and older who underwent mammography according to the time since their last mammography examination (annual, ≤ 18 months; biennial, 19–30 months; longer, > 30 months). (b) Observed percentage of Vermont women who underwent annual screening mammography (≤ 18 months since a previous mammography examination) according to age group. Solid lines depict the best fits from the join-point analyses.
Among all age groups, the utilization of annual screening mammography had been increasing until it reached a peak in 2009 and declined thereafter (Fig 3b). In 2009, 24.7% of women aged 40–49 years, 37.9% of women aged 50–74 years, and 25.6% of women aged 75 years and older underwent screening mammography within 18 months of a prior mammography examination. By 2011, these utilization rates declined to 21.4%, 34.9%, and 23.2%, respectively.
Figure 3b:
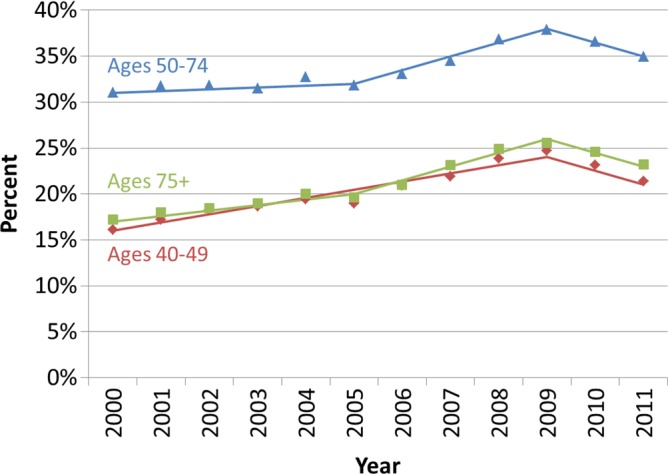
Utilization of screening mammography in Vermont according to screening interval. (a) Observed age-adjusted percentage of Vermont women aged 40 years and older who underwent mammography according to the time since their last mammography examination (annual, ≤ 18 months; biennial, 19–30 months; longer, > 30 months). (b) Observed percentage of Vermont women who underwent annual screening mammography (≤ 18 months since a previous mammography examination) according to age group. Solid lines depict the best fits from the join-point analyses.
Discussion
Our results indicate that, after years of increasing screening mammography utilization in Vermont, there was a decline in screening that coincided with the release of the 2009 USPSTF recommendations. Between 2009 and 2011, there was an overall −8.2% relative decline in the percentage of women aged 40 years and older undergoing screening mammography within the past year. The USPSTF recommended that routine screening for women aged 40–49 years should be replaced by decision-making on a case-by-case basis and that women aged 50–74 years should undergo screening biennially instead of annually. Consistent with this idea, we observed the steepest reductions in mammography utilization among women in their 40s, among whom the percentage screened within the past year decreased from 42.1% to 37.3%. We also observed reductions in annual mammography utilization across all age groups.
Notably, the decline in annual mammography after 2009 among women aged 50–74 years did not appear to be compensated by an increase in biennial screening by 2011. The net effect of these changing patterns was a decrease in the percentage of women who had been screened in the past 2 years, which decreased from 65.4% in 2009 to 61.9% in 2011 among women aged 50–74 years. These results suggest that the proportion of women aged 50–74 years meeting the new USPSTF guidelines declined after 2009. However, we did not have data through a full 30-month period (the upper limit of our biennial screening definition) following the release of the 2009 USPSTF guidelines, and, thus, our results in regard to screening interval must be interpreted with caution. Studies with longer follow-up after the 2009 guidelines are needed to further evaluate the utilization of biennial screening and compliance with the new recommendations.
A particular strength of our study is the use of medical records data from a statewide mammography registry. Our results are concordant with those of Sharpe et al (20), who used Medicare claims data to examine screening utilization among women older than age 65 years and observed a 4.6% decline in screening between 2009 and 2010. In contrast, researchers in studies that use self-reported data have not observed declines in utilization. Howard and Adams (21) evaluated self-reported mammography rates among women interviewed in the Medical Expenditure Panel Surveys, and found that the proportion of women who reported having undergone mammography in the past 2 years did not change substantially between 2006–2009 and 2010. Pace et al (7) conducted a cross-sectional analysis of National Health Interview Survey data from 2005, 2008, and 2011 and observed no discernible changes in the proportion of women reporting mammography screening in the past year. We suspect that the differences in results between studies with the use of medical records or claims data and those with the use of self-reported data are probably a result of the tendency for participants to overreport their utilization of screening (9). In addition, the survey studies have not discriminated between screening and diagnostic mammography.
It is also possible that the inconsistencies in study results to date could have been caused by differences in the study populations—namely, that trends in Vermont and/or the Medicare population may not be representative of those occurring nationally among women of all ages. In 2011, Vermont ranked in the top 10 in its percentage of women aged 40 years and older with a bachelor’s degree (34.9%) and with health insurance (94.5%) (22). While these factors are associated with higher screening utilization (23), it is unclear how these factors may alter reaction to the USPSTF guidelines. Further research is needed to evaluate changes in mammography utilization during this time in relation to geographic, sociodemographic, and medical system characteristics.
There were limitations to our study. The denominators used to calculate screening rates for this study are counts of female residents of Vermont. Some residents of Vermont seek screening services outside of Vermont. Border crossing is largely limited by Lake Champlain, the Canadian border, and dense facility coverage in the west, north, and south, but a number of Vermont residents receive health care services across the eastern border in New Hampshire. Similarly, some women from neighboring states receive screening services in Vermont. The numerator for screening rates in this study includes mammography examinations conducted in Vermont regardless of the residential location of the patient. Our approach implicitly assumes that the number of Vermont women screened out of state is similar to the number of out-of-state residents who undergo screening mammography in Vermont. Finally, trends in screening utilization in Vermont may not necessarily reflect those experienced in other regions.
With only 2 years of data following the 2009 USPSTF recommendations, there was limited power to estimate the annual percentage change in screening utilization after the release of the recommendations. We estimated negative annual percentage changes in screening utilization during 2009–2011, but these estimates did not reach significance, and, thus, we cannot conclude with certainty that the true underlying annual percentage changes during this period are different from zero.
Women with a personal history of breast cancer have consistently made up about 6% of the screened population in Vermont in every year since 1999. The USPSTF recommendations apply to the general population and would not be expected to influence surveillance or screening mammography among women with a personal history of breast cancer. We did not attempt to produce screening estimates restricted to women without a personal history of breast cancer because of the difficulty in estimating appropriate population denominators.
We were unable to directly assess the effect of the USPSTF recommendations in isolation from other factors that influence screening utilization. During 2009–2011, a number of studies brought attention to the potential overdiagnosis of breast cancer associated with screening (24–26), which probably contributed to declines in utilization of screening mammography. In addition, the 2007–2009 economic recession in the United States was associated with increasing unemployment and declines in real income and health insurance coverage (27). Unemployment in Vermont rose from about 4% in early 2008 to a peak of over 7% in mid 2009 and then gradually declined through the end of 2011 to about 5% (28). The percentage of uninsured Vermont women among those aged 40 years and older actually declined from 6.4% in 2006 to 5.5% in 2011 (22). These patterns suggest that the economic recession does not appear likely to explain a large portion of the observed decline in screening utilization. However, these statistics do not fully capture subtle changes in access to preventive health care, including high deductibles or copays, and the potential effect of an extended period of economic downturn on patient willingness to pay for screening tests.
In conclusion, our findings indicate that the 2009 USPSTF breast cancer screening mammography recommendations were followed by lower utilization rates in Vermont. These lower rates of utilization were consistent with certain aspects of the USPSTF recommendations, as utilization of screening was most reduced among women aged 40–49 years old, and there was a decline in annual mammography screening among all ages. However, there was a decline in the percentage of women screened in the past 2 years, and there was no apparent increase in biennial screening. Continued monitoring of screening utilization in future years and in other populations will be needed to confirm our findings and to assess the potential effect of these changes in screening utilization on breast cancer outcomes.
Advances in Knowledge
■ The percentage of women aged 40 years and older who underwent screening mammography in a given year declined from 45.3% in 2009 to 41.6% in 2011 (P < .01).
■ The decline in screening utilization during 2009–2011 was most prominent among women aged 40–49 years, among whom there was an absolute decline of −4.8 percentage points (95% confidence interval [CI]: −4.1, −5.4).
■ Declines were also observed among women aged 50–74 years (−3.0 percentage points; 95% CI: −2.6, −3.5) and women aged 75 years and older (−3.1 percentage points; 95% CI: −2.3, −4.0).
■ Results of analyses according to screening interval indicated declines in annual screening mammography after 2009 without increases in biennial screening.
■ The percentage of women aged 40 years and older who were screened in the past 2 years declined from 59.6% in 2009 to 54.9% in 2011 (P < .01).
PODCAST
Acknowledgments
Acknowledgments
The authors thank Mark Bowman, Rachael Chicoine, BS, Cindy Groseclose, Kathleen Howe, AA, Dawn Pelkey, BA, and Tiffany Pelkey, BA for their dedicated efforts in data collection and administrative support. We also thank the mammography facilities, radiologists, and women of Vermont for providing data for this study.
Received May 8, 2013; revision requested June 7; final revision received June 25; accepted July 16; final version accepted July 31.
Funding: This research was supported by the National Institutes of Health (grants U54 CA163303, P01 CA154292, and U01 CA070013).
Disclosures of Conflicts of Interest: B.L.S. No relevant conflicts of interest to disclose. K.C.B. No relevant conflicts of interest to disclose. J.L.M. No relevant conflicts of interest to disclose. S.D.H. No relevant conflicts of interest to disclose. T.A.J. No relevant conflicts of interest to disclose. P.M.V. No relevant conflicts of interest to disclose. D.L.W. Financial activities related to the present article: none to disclose. Financial activities not related to the present article: received royalties on the book Sentinel Nodes in Breast Cancer from UpToDate. Other relationships: none to disclose. B.M.G. No relevant conflicts of interest to disclose.
Abbreviations:
- CI
- confidence interval
- USPSTF
- U.S. Preventive Services Task Force
References
- 1.U.S. Preventive Services Task Force . Screening for breast cancer: U.S. Preventive Services Task Force recommendation statement. Ann Intern Med 2009;151(10):716–726, W-236. [DOI] [PubMed] [Google Scholar]
- 2.Squiers LB, Holden DJ, Dolina SE, Kim AE, Bann CM, Renaud JM. The public’s response to the U.S. Preventive Services Task Force’s 2009 recommendations on mammography screening. Am J Prev Med 2011;40(5):497–504. [DOI] [PubMed] [Google Scholar]
- 3.Quanstrum KH, Hayward RA. Lessons from the mammography wars. N Engl J Med 2010;363(11):1076–1079. [DOI] [PubMed] [Google Scholar]
- 4.Peres J. Mammography screening: after the storm, calls for more personalized approaches. J Natl Cancer Inst 2010;102(1):9–11. [DOI] [PubMed] [Google Scholar]
- 5.DeAngelis CD, Fontanarosa PB. US Preventive Services Task Force and breast cancer screening [editorial]. JAMA 2010;303(2):172–173. [DOI] [PubMed] [Google Scholar]
- 6.National Center for Health Statistics . Health, United States, 2011: with special feature on socioeconomic status and health. Hyattsville, Md: National Center for Health Statistics, 2012. [PubMed] [Google Scholar]
- 7.Pace LE, He Y, Keating NL. Trends in mammography screening rates after publication of the 2009 US Preventive Services Task Force recommendations. Cancer 2013;119(14):2518–2523. [DOI] [PubMed] [Google Scholar]
- 8.Newell SA, Girgis A, Sanson-Fisher RW, Savolainen NJ. The accuracy of self-reported health behaviors and risk factors relating to cancer and cardiovascular disease in the general population: a critical review. Am J Prev Med 1999;17(3):211–229. [DOI] [PubMed] [Google Scholar]
- 9.Rauscher GH, Johnson TP, Cho YI, Walk JA. Accuracy of self-reported cancer-screening histories: a meta-analysis. Cancer Epidemiol Biomarkers Prev 2008;17(4):748–757. [DOI] [PubMed] [Google Scholar]
- 10.Cronin KA, Miglioretti DL, Krapcho M, et al. Bias associated with self-report of prior screening mammography. Cancer Epidemiol Biomarkers Prev 2009;18(6):1699–1705. [DOI] [PMC free article] [PubMed] [Google Scholar]
- 11.Carney PA, Goodrich ME, Mackenzie T, et al. Utilization of screening mammography in New Hampshire: a population-based assessment. Cancer 2005;104(8):1726–1732. [DOI] [PubMed] [Google Scholar]
- 12.Ballard-Barbash R, Taplin SH, Yankaskas BC, et al. Breast Cancer Surveillance Consortium: a national mammography screening and outcomes database. AJR Am J Roentgenol 1997;169(4):1001–1008. [DOI] [PubMed] [Google Scholar]
- 13.Population-based Research Optimizing Screening through Personalized Regimens (PROSPR) . National Cancer Institute. http://appliedresearch.cancer.gov/networks/prospr/. Published September 3, 2013. Accessed September 11, 2013.
- 14.U.S. census bureau . Methodology for the Intercensal Population and Housing Unit Estimates: 2000 to 2010. http://www.census.gov/popest/data/intercensal/index.html. Revised October 2012. Accessed November 2, 2012.
- 15.Makuc DM, Haglund B, Ingram DD, Kleinman JC, Feldman JJ. Health service areas for the United States. Vital Health Stat 2 1991; (112):1–102. [PubMed] [Google Scholar]
- 16.Surveillance Epidemiology and End Results Program . Standard populations (millions) for age-adjustment. National Cancer Institute. http://seer.cancer.gov/stdpopulations/. Published March 28, 2013. Accessed September 11, 2013. [Google Scholar]
- 17.Kim HJ, Fay MP, Feuer EJ, Midthune DN. Permutation tests for joinpoint regression with applications to cancer rates. Stat Med 2000;19(3):335–351. [DOI] [PubMed] [Google Scholar]
- 18.Braithwaite D, Zhu W, Hubbard RA, et al. Screening outcomes in older US women undergoing multiple mammograms in community practice: does interval, age, or comorbidity score affect tumor characteristics or false positive rates? J Natl Cancer Inst 2013;105(5):334–341. [DOI] [PMC free article] [PubMed] [Google Scholar]
- 19.Breen N, Gentleman JF, Schiller JS. Update on mammography trends: comparisons of rates in 2000, 2005, and 2008. Cancer 2011;117(10):2209–2218. [DOI] [PMC free article] [PubMed] [Google Scholar]
- 20.Sharpe RE, Jr, Levin DC, Parker L, Rao VM. The effect of the controversial US Preventive Services Task Force recommendations on the use of screening mammography. J Am Coll Radiol 2013;10(1):21–24. [DOI] [PubMed] [Google Scholar]
- 21.Howard DH, Adams EK. Mammography rates after the 2009 US Preventive Services Task Force breast cancer screening recommendation. Prev Med 2012;55(5):485–487. [DOI] [PubMed] [Google Scholar]
- 22.King M, Ruggles S, Alexander JT, et al. Integrated Public Use Microdata Series, Current Population Survey: Version 3.0.[Machine-readable database]. Minneapolis, Minn: University of Minnesota, 2010. Data based on the Census Bureau’s Annual March CPS. http://cps.ipums.org/cps/index.shtml. Accessed November 2, 2012. [Google Scholar]
- 23.Schueler KM, Chu PW, Smith-Bindman R. Factors associated with mammography utilization: a systematic quantitative review of the literature. J Womens Health (Larchmt) 2008;17(9):1477–1498. [DOI] [PubMed] [Google Scholar]
- 24.Jørgensen KJ, Gøtzsche PC. Overdiagnosis in publicly organised mammography screening programmes: systematic review of incidence trends. BMJ 2009;339:b2587. [DOI] [PMC free article] [PubMed] [Google Scholar]
- 25.Welch HG, Black WC. Overdiagnosis in cancer. J Natl Cancer Inst 2010;102(9):605–613. [DOI] [PubMed] [Google Scholar]
- 26.Duffy SW, Tabar L, Olsen AH, et al. Absolute numbers of lives saved and overdiagnosis in breast cancer screening, from a randomized trial and from the Breast Screening Programme in England. J Med Screen 2010;17(1):25–30. [DOI] [PMC free article] [PubMed] [Google Scholar]
- 27.Holahan J. The 2007-09 recession and health insurance coverage. Health Aff (Millwood) 2011;30(1):145–152. [DOI] [PubMed] [Google Scholar]
- 28.U.SDepartment of Labor , Bureau of Labor Statistics. Local area unemployment statistics. http://www.bls.gov/lau/. Published August 28, 2013. Accessed September 11, 2013.
Associated Data
This section collects any data citations, data availability statements, or supplementary materials included in this article.