

Abstract
Replication fork stalling can promote genomic instability, predisposing to cancer and other diseases1–3. Stalled replication forks may be processed by sister chromatid recombination (SCR), generating error-free or error-prone homologous recombination (HR) outcomes4–8. In mammalian cells, a long-standing hypothesis proposes that the major hereditary breast/ovarian cancer predisposition gene products, BRCA1 and BRCA2, control HR/SCR at stalled replication forks9. Although BRCA1 and BRCA2 affect replication fork processing10–12, direct evidence that BRCA genes regulate HR at stalled chromosomal replication forks is lacking due to a dearth of tools for studying this process. We report that the Escherichia coli Tus/Ter complex13–16 can be engineered to induce site-specific replication fork stalling and chromosomal HR/SCR in mammalian cells. Tus/Ter-induced HR entails processing of bidirectionally arrested forks. We find that the BRCA1 C-terminal tandem BRCT repeat and regions of BRCA1 encoded by exon 11—two BRCA1 elements implicated in tumor suppression—control Tus/Ter-induced HR. Inactivation of either BRCA1 or BRCA2 increases the absolute frequency of “long-tract” gene conversions at Tus/Ter-stalled forks—an outcome not observed in response to a restriction endonuclease-mediated chromosomal double strand break (DSB). Therefore, HR at stalled forks is regulated differently from HR at DSBs arising independently of a fork. We propose that aberrant long-tract HR at stalled replication forks contributes to genomic instability and breast/ovarian cancer predisposition in BRCA mutant cells.
Tus binds the 23-bp Ter site to induce polar replication fork arrest in E. coli13–16. To determine whether Tus/Ter can arrest mammalian replisomes, we introduced six TerB sites into a plasmid containing the Epstein Barr Nuclear Antigen 1 (EBNA1)-binding origin of replication (“p6xTerOri”, Fig. 1a). EBNA1 recruits mammalian replication factors, mediating predominantly unidirectional plasmid replication, due to a replication block at EBNA1-bound “FR” repeats17. In p6xTerOri, the major clockwise fork approaches the “non-permissive” (fork-stalling) face of Tus/Ter (Fig. 1a). We used two-dimensional DNA gel electrophoresis (2DGE) with Southern blotting to visualize replication through 6xTer. Transfection of 293E cells, which express EBNA118, with p6xTerOri and control empty vector revealed plasmid replication intermediates (arc “A”, Fig. 1b). Co-transfection of p6xTerOri and wild-type (wt) myc-tagged Tus revealed site-specific stalling of the clockwise fork (spot “B”, Fig. 1b, 1c; Extended Data Fig. 1). TusH144A, a Ter binding-impaired mutant16, induced minimal fork stalling. 6xTer in the “permissive” orientation (“6xREVTer”, Fig 1b) also mediated Tus-dependent stalling of the clockwise fork, albeit less efficiently than non-permissive 6xTer (Fig. 1b and 1c). The FR/EBNA1 replication block is incomplete19. A weaker Tus/Ter-dependent double-Y spot (“C”, Fig. 1b), reflects bidirectional fork arrest at 6xTer. (We estimate the FR/EBNA1 and Tus/6xTer replication block efficiencies as ~70%; Extended Data Fig. 2). Thus, Tus/Ter mediates bidirectional site-specific arrest of mammalian replication forks.
Figure 1. Tus/Ter-induced replication fork stalling in mammalian cells.
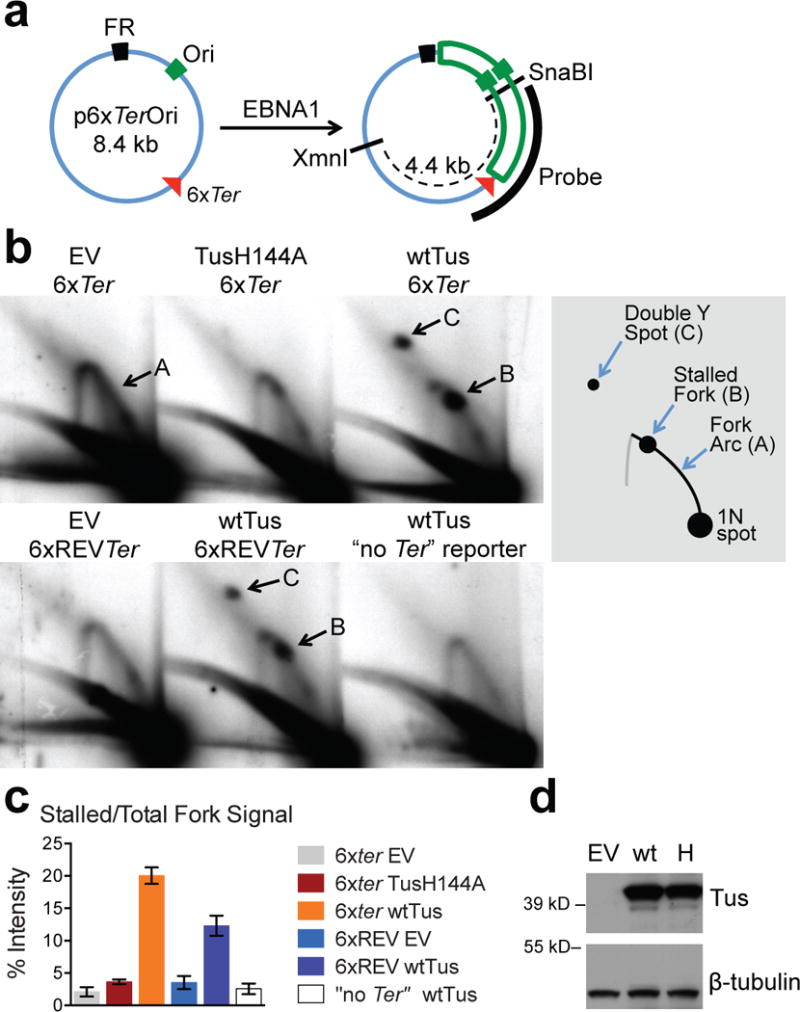
(a) EBNA1-driven plasmid replication. Ori: EBNA1-binding origin of replication. EBNA1-binding FR repeats impede counterclockwise fork. Red triangle: 6xTer array (vertex: non-permissive end). Southern blotting probe shown. (b) Plasmid replication intermediates in 293E cells transiently transfected with 6xTer-containing plasmids or “no Ter” control, co-transfected with empty vector (EV), TusH144A or wtTus. Samples from one experiment (Source Data 1). DNA digested with XmnI+SnaBI and analyzed by 2DGE/Southern blotting. 6xREVTer: clockwise fork encounters permissive end of Ter. Cartoon: Arc “A”: replication fork. Spot “B”: Tus/Ter-stalled clockwise fork. Spot “C” : Bidirectional fork arrest (“Double Y”) at Tus/6xTer, reflecting incomplete replication block at FR19. (c) Stall spot “B” quantitation, n=5 (Source Data 1). Error bars: s.e.m.: t-test 6xTer wtTus vs. any other, P<0.01. 6xREVTer wtTus vs. any other, P<0.01. 6xTer TusH144A vs. 6xTer EV, P<0.03. (d) Upper panel: Anti-myc immunoblot of 293E cells expressing empty vector (EV), wtTus (wt) or TusH144A (H). Lower panel: ß tubulin loading control.
To determine whether Tus/Ter induces HR/SCR at a defined chromosomal locus in mammalian cells, we placed 6xTer in an HR reporter of short- and long-tract gene conversion (STGC and LTGC) between sister chromatids20. Duplication of a red fluorescent protein (RFP) cassette distinguishes LTGC (length ≥1252 bp; GFP+RFP+) from STGC (length <1252 bp; GFP+RFP−; Fig. 2a)20. 6xTer abuts an I-SceI restriction site, interrupting an enhanced green fluorescent protein gene (“6xTer-I-SceI-GFP”, Fig. 2a). Recombination of the stalled left-hand fork (Fig. 2a) with the 5′-truncated GFP copy (“Tr-GFP”) of the sister chromatid generates wtGFP. If chromosomal fork arrest were bidirectional, this could produce a two-ended break, generating predominantly STGCs (Fig. 2a, Extended Data Fig. 3a)20. In contrast, unidirectional fork arrest with one-ended breaks would favor LTGC, and any STGCs arising from one-ended breaks would necessarily be terminated by non-canonical mechanisms (Extended Data Fig. 3b)20.
Figure 2. Tus/Ter-induced homologous recombination in mammalian cells.

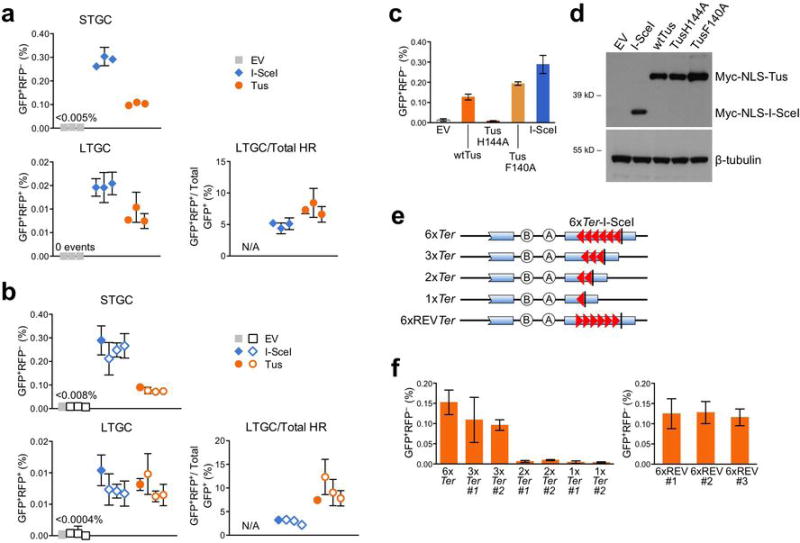
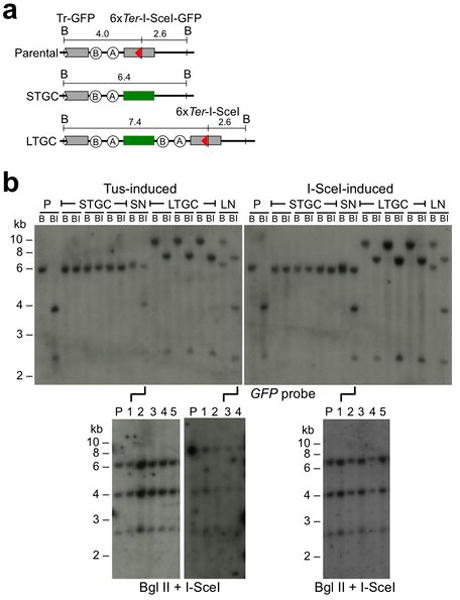
(a) 6xTer-HR reporter and major HR products (assuming 2-ended breaks). STGC/LTGC: short/long tract gene conversion. LTGC generates wtRFP expression through RNA splicing. Grey boxes: mutant GFP. Green box: wtGFP. Circles A and B: 5′ and 3′ artificial RFP exons. Tr-GFP: 5′ truncated GFP. Red triangle: 6xTer array adjacent to I-SceI site. B: BglII; GFP-hybridizing fragment sizes in kb. Bidirectional fork stalling triggers SCR. Green arrow: strand exchange. (b) FACS data of Brca1fl/BRCT 6xTer-HR cells transfected with empty vector (EV), I-SceI, wtTus or TusH144A. “no Ter” reporter: Brca1fl/BRCT cells carrying ROSA26-targeted HR reporter lacking Ter array20. (c) I-SceI- and Tus-induced HR (blue diamonds and orange circles, respectively) in three independent Brca1fl/BRCT clones. Mean of triplicate samples, n=3. Error bars: s.e.m. t-test LTGC/Total HR, I-SceI vs. Tus: P=0.0186. (d) Southern blot analysis of Tus- and I-SceI-induced HR in Brca1fl/BRCT 6xTer-HR cells (GFP probe). P: parental reporter. B: BglII digest. BI: BglII+I-SceI digest.
We targeted the 6xTer/HR reporter as a single copy to the ROSA26 locus of mouse embryonic stem (ES) cell line 11CO/47T (“Brca1fl/BRCT”)20. Brca1BRCT encodes a C-terminal truncated protein; the BRCT-encoding elements of Brca1fl can be conditionally deleted (generating “Brca1Δ”)20. Indeed, wtTus, but not TusH144A, induced HR within 6xTer/HR Brca1fl/BRCT cells, the major HR product being STGC (Fig. 2b). wtTus failed to induce HR in Brca1fl/BRCT cells containing a ROSA26-targeted HR reporter lacking the Ter array (Fig. 2b)20. Thus, Tus/Ter-induced chromosomal HR requires cognate Tus-Ter binding. The ratio LTGC/Total HR, a measure of the probability that HR resolves as LTGC, was ~7% in three independent Tus-transfected clones (Fig. 2c; Extended Data Fig. 4a). Three additional independent clones of Brca1fl/BRCT ES cells, each containing a single-copy randomly integrated chromosomal 6xTer/HR reporter, behaved similarly (Extended Data Fig. 4b). The predominance of STGC and the consistent results at different loci suggested that Tus/Ter-induced HR entails bidirectional fork arrest (Extended Data Fig. 3a). We resolved this definitively by Southern blot analysis of Tus/Ter-induced STGCs. Unidirectional fork arrest/breakage (Extended Data Fig. 3b) could produce a one-ended break, generating STGC products of variable size20. In contrast, bidirectional fork arrest (Fig. 2a, Extended Data Fig. 3a) could produce a two-ended break, with STGC termination by annealing. This would generate STGC products of fixed size, resembling the parental reporter but lacking the 6xTer array or I-SceI site (Fig 2a)20. Indeed, 44/44 Tus/Ter-induced STGCs in 6xTer/HR reporter Brca1fl/BRCT cells revealed this latter structure (Fig. 2d). As expected, I-SceI-induced HR behaved similarly (Fig. 2d). A second arrested fork (right-hand fork, Fig. 2a) must provide the homologous second end during Tus/Ter-induced STGC. Therefore, Tus/Ter-induced STGC is the product of bidirectional replication fork arrest. Overall I-SceI-induced HR in Brca1fl/BRCT 6xTer/HR reporter cells was ~20% of that in isogenic ROSA26-targeted Brca1fl/BRCT HR reporter cells, which differ only by the lack of a 6xTer array (data not shown)20. The reasons for this difference are unclear.
To investigate further the non-polar behavior of Tus/Ter in mammalian HR, we studied the Tus mutant F140A that binds duplex Ter with higher affinity than wtTus but is defective for the Ter C-6 base-flipping “locking” mechanism that contributes to polar fork arrest in E. coli16. TusF140A induced higher levels of HR than wtTus in 6xTer/HR Brca1fl/BRCT cells (Extended Data Fig. 4c and 4d), showing that the C-6 “lock” is dispensable for Tus/Ter-induced HR in mammalian cells. This might be explained by the different polarities of the E. coli DnaB and vertebrate MCM replicative helicases. Ter C-6 is located on the leading strand of the fork approaching the non-permissive end of Ter. Unlike DnaB, which translocates along the lagging strand, the MCM helicase translocates along the leading strand and might occlude Ter C-6 within its barrel, thereby denying Tus access to the C-6 lock mechanism. To determine the minimal number of Tus/Ter complexes needed for HR induction, we generated reporters containing 3, 2 or 1 Ter sites (Extended Data Fig. 4e). We targeted each, in parallel, as a single copy to the ROSA26 locus of Brca1fl/BRCT ES cells and found that a minimum of 3 Ter sites is required for robust Tus-induced HR (Extended Data Fig. 4f). We inverted the 6xTer array orientation to generate a “6xREVTer/HR” reporter. When targeted as a single copy to the ROSA26 locus of Brca1fl/BRCT ES cells, this reporter supported Tus-induced HR as robustly as the 6xTer/HR reporter (Extended Data Fig. 4f). Our findings do not exclude a polar component to Tus/Ter-induced fork stalling on a mammalian chromosome but this polarity, if present, is relative not absolute.
Interstrand DNA cross-link repair of plasmids replicating in Xenopus laevis egg extracts entails endonucleolytic attack of bidirectionally stalled forks21. Interestingly, Tus/Ter-induced HR was suppressed by depletion of the endonuclease scaffold Slx4/FancP22,23 to a greater extent than I-SceI-induced HR (Extended Data Fig. 5), suggesting that Slx4 contributes specifically to Tus/Ter-induced HR. However, it is not clear whether Slx4 mediates endonucleolytic attack of stalled forks during Tus/Ter-induced HR. Work in Schizosaccharomyces pombe suggests that alternative mechanisms, such as template switching, could mediate HR at stalled mammalian forks7.
To determine whether BRCA1 regulates HR at stalled replication forks, we transduced 6xTer/HR Brca1fl/BRCT cells with adeno-Cre and screened for wtBrca1 loss (Fig. 3a). The resulting Brca1Δ/BRCT cells are viable hypomorphs with growth characteristics similar to Brca1fl/BRCT cells20. We studied Tus-induced HR in three independent Cre-treated clones of each genotype (Fig. 3). Surprisingly, Tus-induced STGC in 6xTer/HR Brca1Δ/BRCT cells showed no reduction compared to Brca1fl/BRCT cells, but LTGC was elevated 2-fold (Fig. 3b). Correspondingly, the probability of engaging LTGC during Tus/Ter-induced HR was doubled to ~15% (Fig. 3b). Consistent with our recent findings, I-SceI-induced HR in 6xTer/HR Brca1Δ/BRCT cells was diminished and biased in favor of LTGC (Fig. 3b)20. Southern analysis of Tus/Ter-induced STGC and LTGC products in 6xTer/HR Brca1Δ/BRCT cells revealed patterns similar to Brca1fl/BRCT cells (Extended Data Fig. 6). However, in Brca1Δ/BRCT cells, 6/41 (15%) Tus/Ter-induced STGC and 3/15 (20%) LTGC clones retained an additional copy of the parental reporter (Extended Data Fig. 6). This was not separable by recloning, suggesting that it was retained by nondisjunction. 4/41 (9.8%) I-SceI-induced STGC Brca1Δ/BRCT clones revealed nondisjunction; thus, nondisjunction is not specific to Tus/Ter-induced HR. The fact that the donor sister was unaltered during LTGC excludes crossing-over as a cause of the LTGC outcome in these clones24,25.
Figure 3. The Brca1 tandem BRCT repeat regulates Tus/Ter-induced HR.
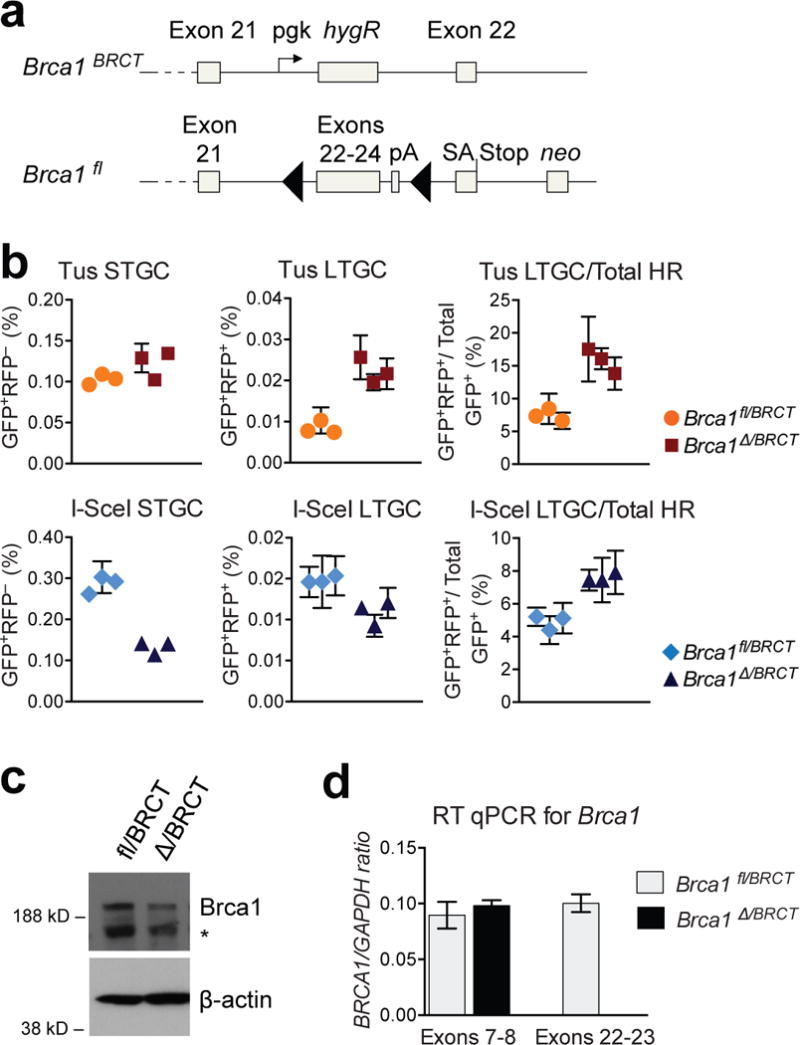
(a) Brca1 gene in Brca1fl/BRCT ES cells. Brca1BRCT encodes truncated protein. Cre converts Brcafl to exon 22–24-deleted Brca1Δ allele. Grey boxes: Brca1 exons; black triangles: loxP sites; pA: polyadenylation signal. SA: splice acceptor. neo: neomycin resistance gene. pgk: phosphoglycerate kinase promoter. (b) Tus- and I-SceI-induced HR in Brca1fl/BRCT and Brca1Δ/BRCT 6xTer-HR cells (three independent clones each). Mean of triplicate samples, n=4. Error bars: s.e.m. t-test Brca1fl/BRCT vs. Brca1Δ/BRCT in all 6 panels P<0.05. (c) Upper panel: endogenous Brca1 immunoblot in Brca1fl/BRCT and Brca1Δ/BRCT ES cells. *: background band. Lower panel: ß-actin loading control. (Source Data 5.) (d) RT qPCR for Brca1 mRNA. Exon 22-23 is deleted in Brca1Δ/BRCT cells.
We asked whether Brca1 domains additional to the BRCT repeat regulate Tus/Ter-induced HR. Indeed, siRNA-mediated Brca1 depletion suppressed STGC but increased LTGC in both Brca1fl/BRCT and Brca1Δ/BRCT cells (Extended Data Fig. 7). In Brca1-depleted Brca1Δ/BRCT cells, ~40% of all HR products were LTGCs. More than half of the BRCA1 polypeptide is encoded by exon 11, which is a target of inactivating germ line mutation in hereditary breast/ovarian cancer; exon 11 is also alternatively spliced, generating an in-frame nuclear Δexon11 gene product that retains N-terminal RING domain and C-terminal BRCT functions26. To test whether Brca1 exon 11 regulates Tus/Ter-induced HR, we targeted a single copy of the 6xTer/HR reporter to the ROSA26 locus of mouse Brca1fl/Exon11 ES cells. The Brca1Exon11 allele lacks exon 11; exon 11 of Brca1fl can be conditionally deleted to generate “Brca1Δ” (Fig. 4a)27. (Note: “fl” and “Δ” denote distinct Brca1 alleles in the two Brca1 conditional systems described here.) Following adeno-Cre treatment, we retrieved 6xTer/HR Brca1fl/Exon11 and 6xTer/HR Brca1Δ/Exon11 clones. Each of three independent 6xTer/HR Brca1Δ/Exon11 clones revealed reduced Tus/Ter-induced STGC but increased absolute frequencies of LTGC in comparison with three independent 6xTer/HR Brca1fl/Exon11 clones (Fig. 4b). Deletion of Brca1 exon 11 increased the probability of engaging Tus/Ter-induced LTGC ~4-fold to ~30% (Fig. 4b). In contrast, the absolute frequency of I-SceI-induced LTGC was reduced in Brca1Δ/Exon11 cells and ~20% of HR products were LTGCs (Fig 4b). Thus, Brca1 exon 11 contributes to Tus/Ter-induced HR both quantitatively and qualitatively.
Figure 4. Brca1 Exon11 regulates Tus/Ter-induced HR.
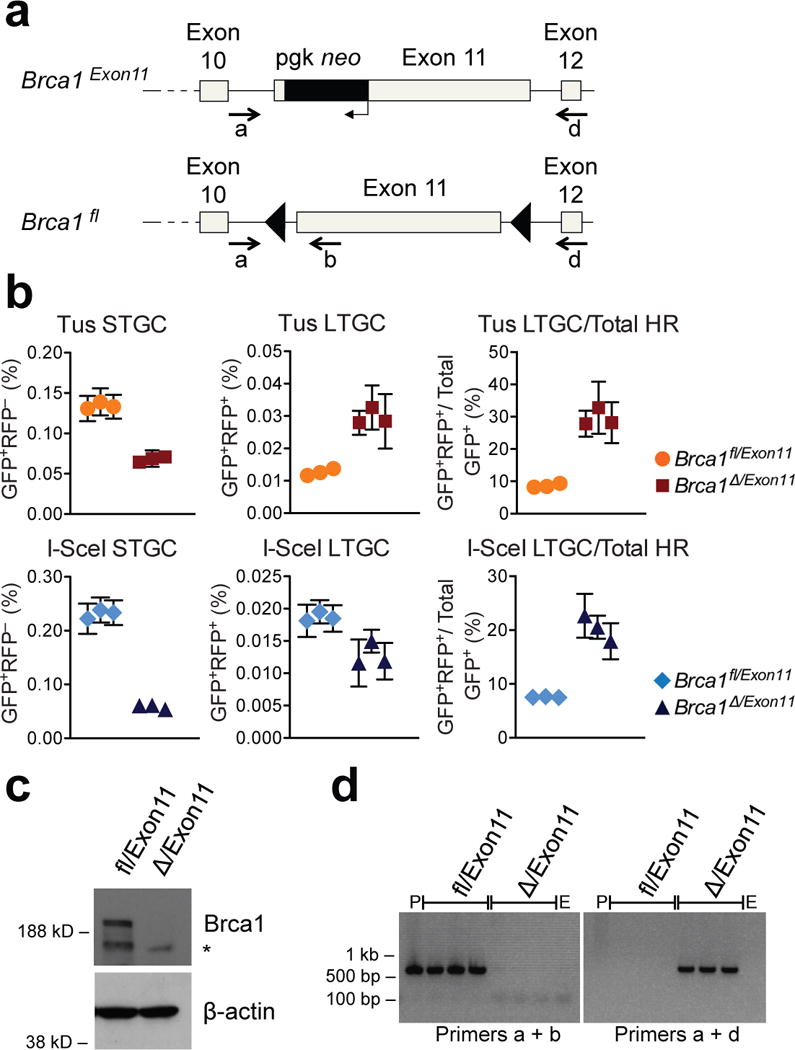
(a) Brca1 gene in Brca1fl/Exon11 ES cells. Brca1Exon11 encodes Δexon11 product. Cre converts Brca1fl to exon11-deleted Brca1Δ allele. Symbols as in Fig. 3. PCR primers a, b, and d shown. (b) Tus- and I-SceI-induced HR in Brca1fl/Exon11 and Brca1Δ/Exon11 6xTer-HR cells (three independent clones each). Mean of triplicate samples, n=4. Error bars: s.e.m. t-test Brca1fl/Exon11 vs. Brca1Δ/Exon11, in all 6 panels P<0.005. (c) Upper panel: endogenous Brca1 immunoblot in Brca1fl/Exon11 and Brca1Δ/Exon11 ES cells. *: background band. Lower panel: ß-actin loading control. (Source Data 7.) (d) PCR genotyping of Brca1fl/Exon11 and Brca1Δ/Exon11 clones from panel b. P: untargeted Brca1fl/Exon11. E: “empty” (no DNA) control. Brca1fl product: 531 bp. Brca1Δ product: 621 bp.
To determine whether BRCA2/Rad51 regulates Tus/Ter-induced HR, we used siRNA to deplete Brca2 or Rad51 during HR induction. Depletion of Brca2 suppressed Tus/Ter-induced STGC but elevated LTGC frequencies in both Brca1fl/BRCT and Brca1Δ/BRCT cells (Extended Data Fig. 8). In Brca1fl/BRCT and Brca1Δ/BRCT cells depleted of Brca2, ~30% and ~50% respectively of all Tus/Ter-induced HR products were LTGCs, while the equivalent probabilities for Rad51-depleted cells were ~40% and ~70% (Extended Data Fig. 9). Thus, suppression of LTGC at stalled forks is a shared function of BRCA1, BRCA2 and Rad51. Inhibition of 53BP1 partially reversed defective I-SceI-induced HR in Brca1Δ/BRCT cells, as expected20, but did not affect Tus/Ter-induced HR in either Brca1fl/BRCT or Brca1Δ/BRCT cells (Extended Data Fig. 10). This suggests that BRCA1’s functions in Tus/Ter-induced and SceI-induced HR are, in part, distinct. LTGC at stalled forks may include pathological responses analogous to break-induced replication in yeast3,8,28,29. Our work identifies loss of BRCA1/BRCA2/Rad51-dependent suppression of LTGC at stalled replication forks as a potential contributor to breast/ovarian cancer predisposition.
Methods Summary
A description of the molecular biology methods, cell culture and recombination assays can be found in the full Methods.
Methods
Molecular biology, siRNAs and antibodies
The vector for mammalian expression of myc epitope-tagged, nuclear localized, codon-optimized wild type (wt) Tus (pCMVβ myc-NLS-Tus), vectors p6xTerOri and p6xrevTerOri and the Ter HR reporters were constructed by conventional cloning methods using a previously described RFP-SCR reporter31. Ter-containing plasmids were cultivated in JJC33 (Tus−) strains of E. coli. siRNA SMARTpools were purchased from Dharmacon. Cells were lysed in RIPA buffer (50 mM Tris-HCl, pH 8.0, 250 mM NaCl, 0.1% sodium dodecyl sulfate, 1% NP-40 containing protease and phosphatase inhibitors PMSF and Roche complete protease inhibitor tablet). Extracted protein was resolved by 4 –12 % bis-Tris SDS-PAGE (Invitrogen) and analyzed by immunoblotting using the following antibodies; Brca1 (a kind gift of the Baer laboratory, 1:100), beta-tubulin (Abcam ab6046, 1:4,000), beta-actin (Abcam ab8226, 1:10,000), Myc (Abcam ab9106, 1:10,000), hRad51 (aliquot B32, 1:500), and HA (Santa Cruz sc-805, 1:200).
Cell lines and cell culture
Mouse embryonic stem (ES) cells were grown in ES medium on either MEF feeders or gelatinized plates as described previously31–33. 10 μg of the 6xTer HR reporter ROSA26 targeting plasmid was linearized by KpnI digest and introduced by electroporation to 1–2 × 10⁷ cells and subsequently seeded on 6 cm plates with puromycin-resistant feeders. Plates were supplemented with puromycin (4 μg/ml) 24 hours later and colonies were picked 5–10 days later. ROSA26 targeted lines were screened for by PCR and verified by Southern blotting31. We generated multiple Brca1-deficient ES clones by transient adenovirus-mediated Cre expression. ROSA26 genotyping primers: ROSA26-sense- (cat caa gga aac cct gga cta ctg); TerBx6 HR reporTer antisense- (cct cgg cta ggt agg gga tc). Brca1 exon11 status was determined by PCR: Brca1 5′ sense- (CTG GGT AGT TTG TAA GCA TCC); Brca1 exon11 antisense- (CAA TAA ACT GCT GGT CTC AGG C); Brca1 exon11 sense- (GGA AAT GGC AAC TTG CCT AG); Brca1 3′ antisense- (CTG CGA GCA GTC TTC AGA AAG).
Recombination Assays
1.6 × 10⁵ cells were transfected in suspension with 0.5 μg pcDNA3β-myc NLS-I-SceI34, pcDNA3β-myc NLS-Tus, pcDNA3β-myc NLS-TusH144A, pcDNA3β-myc NLS-TusF140A, or control vector using Lipofectamine 2000 (Invitrogen). GFP+ and GFP+RFP+ frequencies were scored 3 days after transfection by flow cytometry using a Becton Dickinson 5 Laser LSRII in triplicate and values presented corrected for background events and transfection efficiency. Transfection efficiency was measured by parallel transfection with 0.05 μg wt GFP expression vector and 0.45μg control vector. Typically 6 × 10⁵ total events were scored per sample. In all figures presented, data represents the mean and standard error of the mean (SEM) of at least three independent experiments. Tus or I-SceI expression vector transfection efficiencies were typically between 50% and 75%, and background levels of HR products typically <0.005% for GFP+RFP− and <0.001% for GFP+RFP+ (e.g., Extended Data Fig. 2a).
Statistical methods
Each figure legend reports the sample size in terms of number of replicates per experiment and number of experiments that were analyzed to generate the data shown. For statistical analysis of HR values, the arithmetic mean of triplicate samples was calculated for each independent experiment (i.e., experiments performed on different days) and these single data points for each experiment were used to calculate the mean and standard deviation between experiments. The standard error of the mean (s.e.m.) was calculated as standard deviation/√n, where n= number of experiments (not number of replicates). For example, if we measured triplicate samples in four different independent experiments, then n=4. Differences between groups were analyzed by Student’s two-tailed unpaired t-test, assuming unknown variance, using GraphPad Prism v5.0d software. P-values are given in the figure legends. Densitometry of 2D gel data was also analyzed by calculation of arithmetic mean and s.e.m. and analysis by t-test. Analysis of trend in Extended Data Fig. 4f was performed by ANOVA using GraphPad Prism v5.0d software, in addition to the t-test as described above.
RT-qPCR analysis
RNA from transfected ES cells was extracted by QIAGEN RNeasy Mini Kit (QIAGEN Sciences, Maryland, MD) 2 days post transfection. First-strand cDNA analysis was performed on an ABI 7300 Real time PCR System using Power SYBR Green RNA-toCT™ 1-Step Kit (Applied Biosystems, Foster City, CA). Taqman probe and primer sets to genotype for Brca1 were: Brca1-Exon-22-23-sense-TTC CGT GGT GAA GGA GCT T; Brca1-Exon-22-23-antisense-TGG CTG CAC GAT CAC AAC; Brca1-Exon-23-24-sense-GCC TGG ACA GAA GAC AGC A; Brca1-Exon-23-24-antisense-CAG TCC CAC ATC ACA AGA CG; Brca1-Exon-22-23-taqman probe-FAM-CGC TCA CCC ATG ACA CAG GTG C-BHQ; Brca1-Exon-23-24-taqman probe- FAM-TGC ACA GCT GCC CAA TAT CTG GG-BHQ). Conventional SYBR green RT-qPCR assays of Gapdh and siRNA-targeted gene was performed. We used the NIH NCI Nucleotide utility to Primer 3 software (Whitehead Institute, MIT) to generate gene-specific primer sequences for mouse Brca1 and Gapdh. We used the NIH NCI Nucleotide utility to generate gene-specific primer sequences for mouse Slx4, Slx1, Eme1, and Xpf. Primers for RT-PCR: Brca1-EXON21-22-sense-ATG AGC TGG AGA GGA TGC TG; Brca1-EXON21-22-antisense-CTG GGC AGT TGC TGT CTT CT; Brca1-EXON22-23-sense-GGT GCT CAT CTA GTT GTG ATC G; Brca1-EXON22-23-antisense-CTG TAC CAG GTA GGC ATC CA; Brca1-EXON7-8-sense-AGC CTA GGT GTC CAG CTG TC; Brca1-EXON7-8-antisense-CTG CAA TCA CCT GGC TTA GTT; Brca2-sense-(tct gcc act gtg aaa aat gc); Brca2-antisense-(tca agc tgg gct gaa gat t); Slx4-sense-(GTG GGA CGA CTG GAA TGA GG); Slx4-antisense-(GCA CCT TTT GGT GTC TCT GG); Slx1-sense-(GGA TGG ACC ATG CAG CAA GA); Slx1-antisense-(CCA TTC AAA CCG AAG GGC G); Eme1-sense-(AGG CCA GAG GAA TGC CTG AA); Eme1-antisense-(CCA GTC ATC TCC ATC CTC TAC C); Xpf-sense-(TGG TCA GAA TTC AGG TTG GC); Xpf-antisense-(TTT CAG GAC GTC AGT CAG CG). mRNA was measured in triplicates with a standard curve generated for each gene using cDNA obtained from each sample. The expression level of target genes was normalized to internal Gapdh.
293 Cell Transfection and Episome Two-dimensional gel electrophoresis
12 × 106 293HEK or 293E (ATCC CRL-10852) cells were plated per 15 cm dish 1 day prior to transfection. Cells were transfected with 4.5 μg pOri plasmids and 1 μg of control empty vector or pcDNA3β-myc NLS-Tus in antibiotic free media using Lipofectamine2000 reagent, and media changed 24 hours after transfection. 40 hours after transfection, plates were rinsed with 1× PBS and cells washed off the plate with ice-cold PBS, washed again with ice-cold PBS and HIRT extracted as described below. Purified DNA was restriction digested 8–16 hours and run on a 14 × 16 cm 0.4% agar 0.1 μg/ml ethidium bromide 0.5× TBE gel 13 hours in the dark at 40V. First dimension gel slabs were cut out and embedded in the second dimension slab gel (20 × 25 cm 1% agar, 0.5× TBE, 1 μg/ml ethidium bromide) and run at 160V for 7.5 hours in the cold room.
HIRT Episome Extraction from 293 Cells
Plasmid was extracted as published35. Briefly, PBS washed 293HEK or 293E cells were lysed in 2.25 mL 0.6% sodium dodecyl sulfate 33 mM Tris-HCl, 6 mM EDTA, 66 g/ml RNase followed by digestion with 0.5 μg Proteinase K for 90 minutes at 37°C. Samples were subject to brief, 20 second, base extraction with 0.75 mL 0.1 M NaOH and proteins precipitated by addition of 1 mL 4.2 M Gu-HCl, 0.9 M Potassium Acetate pH 4.8. Cell debris was pelleted at 39,000×g and supernatant loaded onto a Qiagen Miniprep spin column (QIAGEN Sciences, Maryland, MD). Columns were washed with 0.5 mL Qiagen Buffer PB (5 M Gu-HCl, 30% ethanol, adding 10 mM Tris-HCl pH 6.6) and 0.75 mL Qiagen Buffer PE (10 mM Tris-HCl pH 7.5, 80% ethanol) and plasmid DNA eluted using two volumes of 40 L Qiagen EB buffer.
Southern Blotting
Southern blotting of genomic DNA was performed using GFP cDNA or ROSA26 5′ probes as described previously33,34. For all experiments, including mouse ES cells containing a randomly integrated reporter not at ROSA26, clones containing only one intact copy of the reporter were used. Genomic DNA was extracted from confluent ES cells on 6-well plates (~5–10 × 106 cells) using a Puregene DNA Isolation Kit (Gentra Systems). Episomal plasmid DNA was extracted by HIRT extraction described above and Southern blotting performed using random labeled probe produced from the KpnI – HindIII restriction fragment of p6xTerOri.
Extended Data
Extended Data Figure 1. Tus/Ter-induced replication fork stalling visualized by additional restriction digests.

a, Plasmid elements as in Fig. 1a. MluI-XmnI digested plasmid yields linear fragment of 5.4 kb. Probe for Southern blotting indicated by black bar. b, Plasmid replication intermediates extracted from 293E cells transiently transfected with 6xTer-containing plasmids or “no Ter” control, co-transfected with empty vector (EV), TusH144A or wtTus as shown. All samples are from one experiment (see Source Data 2). Plasmid DNA extracted from 293E cells was digested with XmnI and MluI and analyzed by neutral/neutral 2DGE and Southern blotting. Replication intermediates as described in Fig. 1a. c, Predicted replication intermediates generated by Tus/Ter-induced replication fork stalling with or without effective FR/EBNA1 replication fork block. Diagrams below plasmid maps show shape of the major Tus/Ter-dependent fork arrest species. Green dotted line: predicted additional branch of double Y structure formed by stalling of counterclockwise fork at Tus/6xTer when FR/EBNA1 replication block fails. Length of additional branch is shown in each diagram. Note: The relationship between spots B and C will vary according to the length of this additional branch. d, Plasmid replication intermediates extracted from 293E cells transiently transfected with 6xTer-containing plasmids and co-transfected with empty vector (EV) or wtTus as shown. Restriction digests of extracted plasmids as shown. All samples are from one experiment (see Source Data 2). Note: replication fork size and position of stall spot B in relation to replication arc A varies with restriction digest. For example, spot B in KpnI-MluI is close to the 2n linear position, since the Tus/Ter-stall site is only ~680 bp from the KpnI site. For the same reason, spots B and C are closely placed in the KpnI-MluI-digested sample.
Note: the relatively weak spot C in the KpnI-MluI digest, which is consistent across multiple experiments, might reflect a proportionately large contribution of ssDNA (reflecting processed lagging strand DNA21) to the ~680 bp lagging strand of the stalled counterclockwise fork.
Extended Data Figure 2. Estimation of efficiencies of the FR/EBNA1 and Tus/6xTer replication fork barriers.
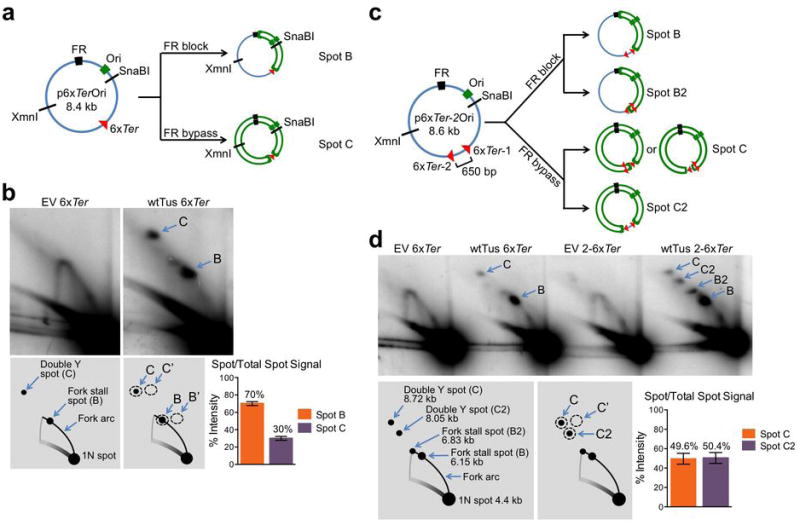
The stalling efficiency at FR/EBNA1 is therefore 70% ± 2.2% (s.e.m.).
The probability of the two 6xTer arrays blocking each fork on one p6xTer-2Ori plasmid (generating spot C2) is a2.
The probability of one 6xTer array being blocked and the second array being bypassed (generating spot C) is 2ab.
Therefore, the estimated efficiency of the Tus/6xTer replication fork block within the replicating plasmid is 67%. Note: the efficiency of the Tus/6xTer replication fork block within the chromosome is unknown.
Extended Data Figure 3. Two-ended vs. one-ended break repair models of Tus/Ter-induced HR.
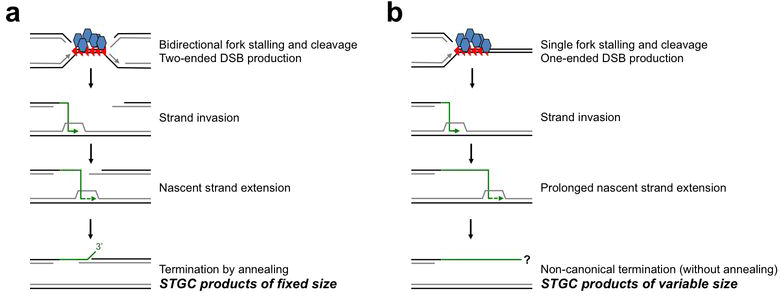
a, Bidirectional fork arrest would provide two DNA ends for sister chromatid recombination. Termination by annealing generates STGC products of a fixed size. Recombining GFP elements and HR reporter features other than Tus/Ter are not shown. Black strands: parental DNA. Grey strands: newly synthesized DNA. Arrow heads on DNA strands represent DNA synthesis. Blue/grey hexagons: Tus monomers. Red triangles: Ter sites. Green line: invading DNA strand. Green dotted line: nascent strand extension. b, Unidirectional fork arrest would provide only one DNA end for sister chromatid recombination. Following one-ended invasion of the neighboring sister chromatid, any STGC products could not be terminated by annealing, since there is no homologous second end. Termination by non-canonical mechanisms would generate STGCs of unpredictable/variable size, as in Chandramouly et al20. DNA and protein elements labeled as in panel (a).
Note 1: LTGC is not considered in this analysis, since the mechanisms of termination of the major LTGC products are not accessible from the current data.
Note 2: Each model invokes a hypothetical DSB intermediate. Tus/Ter-induced HR could be initiated by a template switching mechanism (i.e., without the formation of an initiating DSB intermediate). However, the requirement for a homologous second end is not altered by consideration of a template switch model and this second end must be provided by the processing of a second arrested fork (the right-hand fork in panel a).
Extended Data Figure 4. Tus/Ter-induced HR in Brca1fl/BRCT 6xTer/HR cells conforms to an affinity/avidity model.
a, Primary data from Fig. 2c, showing directly measured frequencies of background HR, Tus-induced HR and I-SceI-induced HR in three independent Brca1fl/BRCT 6xTer/HR reporter clones. Cells were transfected with empty vector (EV; grey squares), myc-NLS-I-SceI (I-SceI; blue diamonds), or myc-NLS-Tus expression vectors (Tus; orange circles). Each point represents the mean of triplicate samples from three independent experiments (i.e., n=3). Error bars: s.e.m. t-test of Tus vs. EV: STGC P< 0.0001; LTGC P< 0.0001. t-test of I-SceI vs. EV: STGC P< 0.0001; LTGC P< 0.0001. t-test of Tus vs. I-SceI: STGC P <0.0001; LTGC P= 0.0018 ; LTGC/Total HR P=0.0186. b, Primary data comparing a single ROSA26 targeted Brca1fl/BRCT 6xTer/HR clone with three independently derived clones, each harboring a single intact 6xTer/HR reporter randomly integrated at an unknown locus. Filled symbols: ROSA26-targeted clone (as in panel a). Open symbols: data from randomly integrated 6xTer/HR reporter clones. Each point represents the mean of six independent experiments, triplicate replicates for each experiment (i.e., n=6). Error bars: s.e.m. t-test of pooled random integrants Tus vs. EV: STGC P< 0.0001; LTGC P< 0.0001. t-test of pooled random integrants I-SceI vs. EV: STGC P< 0.0001; LTGC P< 0.0001. t-test of pooled random integrants Tus vs. I-SceI: STGC P< 0.0001; LTGC P= 0.3620; LTGC/Total HR P= 0.00012. c, Primary data of STGC products observed in Brca1fl/BRCT 6xTer/HR cells transfected with empty vector (EV), wtTus, DNA binding defective TusH144A, lock defective TusF140A, or I-SceI. All expression vectors are codon-optimized for mammalian expression and encode N-terminal myc epitope and NLS sequences. Each column represents the mean of six independent experiments (i.e., n=6). Error bars: s.e.m. t-test of wtTus vs. EV: P= 0.0002; wtTus vs. TusH144A: P= 0.0004; wtTus vs. TusF140A: P= 0.0042; wtTus vs. I-SceI: P= 0.0139; TusH144A vs. EV: P= 0.4406; TusF140A vs. EV: P< 0.0001; TusF140A vs. TusH144A: P< 0.0001; TusF140A vs. I-SceI: P= 0.0888. d, Myc-tagged protein abundance in transfected Brca1fl/BRCT 6xTer-HR cells: EV: empty vector. Other lanes as marked. Lower panel: beta-tubulin loading control. (Source Data 4) e, Cartoons of the Ter/HR reporter constructs assayed in panel (f). f, Frequencies of Tus-induced STGC in Brca1fl/BRCT cells carrying single copy, ROSA26-targeted Ter/HR reporters shown in panel (e). Left: HR in 6xTer, 3xTer, 2xTer and 1xTer HR reporters, as shown. Right: HR in three independently derived clones carrying single copy, ROSA26-targeted 6xREVTer HR reporters. Each column represents the mean of three independent experiments (i.e., n=3). Error bars: s.e.m. t-test of 6xTer vs. 3xTer#1: P= 0.2604; 6xTer vs. 3xTer#2: P= 0.5192; 6xTer vs. 2xTer#1: P= 0.0547; 6xTer vs. 2xTer#2: P= 0.0524; 6xTer vs. 1xTer#1: P= 0.0507; 6xTer vs. 1xTer#2: P= 0.0507; 3xTer#1 vs. 3xTer#2: P= 0.8291; 3xTer#1 vs. 2xTer#1: P= 0.0650; 3xTer#1 vs. 2xTer#2: P= 0.0606; 3xTer#1 vs. 1xTer#1: P= 0.0576; 3xTer#1 vs. 1xTer#2: P= 0.0574; 3xTer#2 vs. 2xTer#1: P= 0.1832; 3xTer#2 vs. 2xTer#2: P= 0.1748; 3xTer#2 vs. 1xTer#1: P= 0.1677; 3xTer#2 vs. 1xTer#2: P= 0.1697.
By one-way ANOVA (Analysis of Variance) test used to compare more than three sets of data, the trend in HR from 6x−1x p=0.0012.
Extended Data Figure 5. Slx4/FancP depletion suppresses Tus/Ter-induced HR.
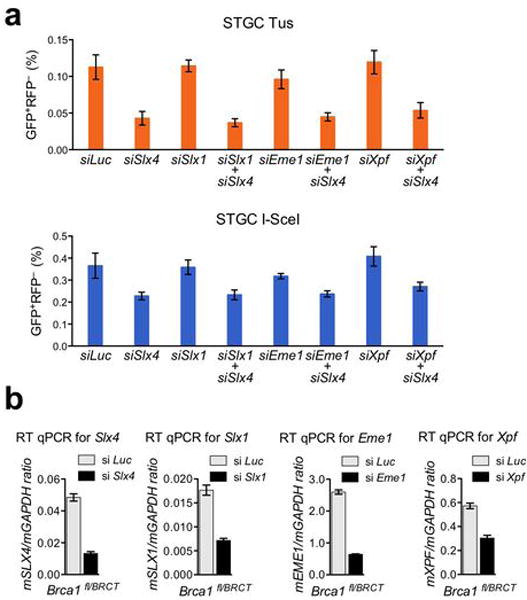
a, Frequencies of STGC in Brca1fl/BRCT 6xTer-HR cells co-transfected with Tus (orange) or I-SceI (blue) and with either control Luciferase siRNA (si Luc), Slx4 SMARTpool (si Slx4), Slx1 SMARTpool (si Slx1), Slx1 and Slx4 SMARTpools (si Slx1 si Slx4), Eme1 SMARTpool (si Eme1), Eme1 and Slx4 SMARTpools (si Eme1 si Slx4), Xpf SMARTpool (si Xpf), Xpf and Slx4 SMARTpools (si Xpf si Slx4). Each column represents the mean of triplicate samples from four independent experiments for each clone (i.e., n=4). Error bars: s.e.m. Tus-induced HR: t-test of si Slx4 vs. si Luc: P= 0.0219; si Slx4 vs. si Slx1: P= 0.0012; si Slx4 vs. si Slx4+1: P= 0.5983; si Slx4 vs. si Eme1: P= 0.0171; si Slx4 vs. si Slx4 +si Eme1: P= 0.8721; si Slx4 vs. si Xpf: P= 0.0098; si Slx4 vs. si Slx4+ si Xpf: P= 0.4711; si Slx1 vs. si Luc: P= 0.9332; si Eme1 vs. si Luc: P= 0.4631; si Xpf vs. si Luc: P= 0.7818; si Slx4+1 vs. si Luc: P= 0.0155; si Slx4+si Eme1 vs. si Luc: P= 0.0215; si Slx4 + si Xpf vs. si Luc: P= 0.0305. I-SceI-induced HR: t-test of si Slx4 vs. si Luc: P= 0.0907; si Slx4 vs. si Slx1: P= 0.0195; si Slx4 vs. si Slx4+1: P= 0.4897; si Slx4 vs. si Eme1: P= 0.0568; si Slx4 vs. si Slx4 +si Eme1: P= 0.3411; si Slx4 vs. si Xpf: P= 0.0745; si Slx4 vs. si Slx4+ si Xpf: P= 0.2726; si Slx1 vs. si Luc: P= 0.9198; si Eme1 vs. si Luc: P= 0.3349; si Xpf vs. si Luc: P= 0.9217; si Slx4+1 vs. si Luc: P= 0.1521; si Slx4+si Eme1 vs. si Luc: P= 0.2864; si Slx4 + si Xpf vs. si Luc: P= 0.2063. b, RT qPCR analysis of mRNA exon boundaries for Slx4, Slx1, Eme1, and Xpf mRNA in siRNA-SMARTpool-treated cells used in panel (a).
Extended Data Figure 6. Southern blot analysis of Tus/Ter- and I-SceI-induced HR products in Brca1Δ/BRCT 6xTer/HR cells.
a, Structure of the 6xTer/HR parental reporter, and major STGC or LTGC HR products (assuming two-ended breaks). Elements as shown in Fig. 2a. b, Southern blot analysis of Tus-induced and I-SceI induced HR products in Brca1Δ/BRCT 6xTer-HR cells. P: un-rearranged reporter; STGC and LTGC as shown. SN: STGC accompanied nondisjunction with retention of parental donor reporter; LN: LTGC accompanied nondisjunction with retention of parental donor reporter. B: BglII digest. BI: BglII + I-SceI digest. Membranes probed with full length GFP cDNA. Panels underneath two SN events and one LN event show that re-cloning does not separate the two reporters, confirming that the cell contains two copies of the reporter (consistent with nondisjunction).
Extended Data Figure 7. Brca1 contributes quantitatively and qualitatively to HR at stalled replication forks.
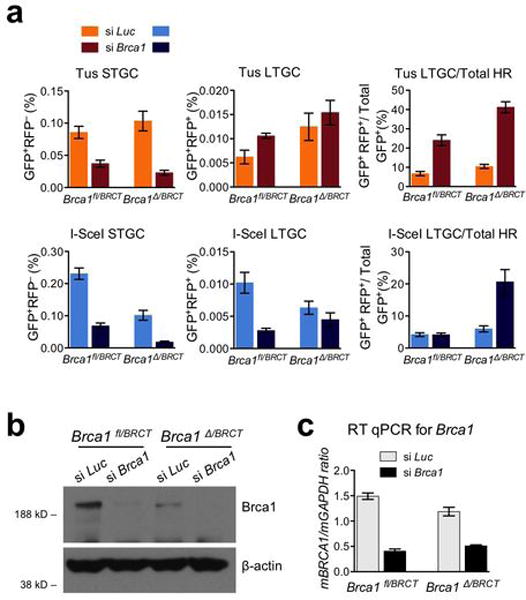
a, Frequencies of Tus-induced and I-SceI-induced HR in Brca1fl/BRCT and Brca1Δ/BRCT 6xTer/HR cells transiently co-transfected with Tus, or I-SceI and with either control Luciferase siRNA (si Luc) or Brca1 SMARTpool (si Brca1). Each column represents the mean of triplicate samples for each independent clone from seven independent experiments (i.e., n=7). Error bars: s.e.m. Tus-induced HR, Brca1fl/BRCT cells, t-test si Brca1 vs. si Luc: STGC: P= 0.0013; LTGC: P= 0.0206; LTGC/total HR: P= 0.0003; Brca1Δ/BRCT cells, si Brca1 vs. si Luc: STGC: P= 0.0016; LTGC: P= 0.4558; LTGC/total HR: P< 0.0001. I-SceI-induced HR, Brca1fl/BRCT cells, t-test si Brca1 vs. si Luc: STGC: P< 0.0001; LTGC: P= 0.0033; LTGC/total HR: P= 0.9214; Brca1Δ/BRCT cells, si Brca1 vs. si Luc: STGC: P= 0.0013; LTGC: P= 0.2348; LTGC/total HR: P= 0.0071. b, Brca1 protein levels and beta-actin loading control in Brca1fl/BRCT and Brca1Δ/Exon11 in siRNA-treated cells as shown. c, RT qPCR analysis of Brca1 mRNA in siRNA-treated cells as shown. (Source Data 6.)
Extended Data Figure 8. Brca2 contributes quantitatively and qualitatively to HR at stalled replication forks.
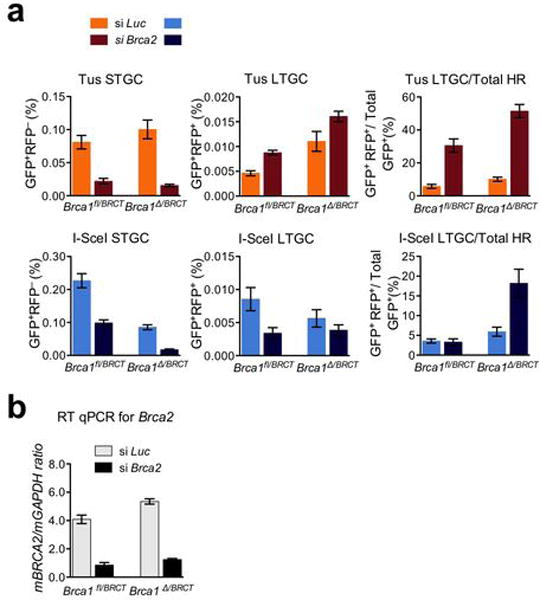
a, Frequencies of Tus-induced and I-SceI-induced HR in Brca1fl/BRCT and Brca1Δ/BRCT 6xTer/HR cells transiently co-transfected with Tus, or I-SceI and with either control Luciferase siRNA (si Luc) or Brca2 SMARTpool (si Brca2). Each column represents the mean of triplicate samples for each independent clone from five independent experiments (i.e., n=5). Error bars: s.e.m. Tus-induced HR, Brca1fl/BRCT cells, t-test si Brca2 vs. si Luc: STGC: P= 0.0031; LTGC: P= 0.0007; LTGC/total HR: P= 0.0042; Brca1Δ/BRCT cells, si Brca2 vs. si Luc: STGC: P= 0.0040; LTGC: P= 0.0013; LTGC/total HR: P= 0.0006. I-SceI-induced HR, Brca1fl/BRCT cells, t-test si Brca2 vs. si Luc: STGC: P= 0.0028; LTGC: P= 0.0456; LTGC/total HR: P= 0.7945; Brca1Δ/BRCT cells, si Brca2 vs. si Luc: STGC: P= 0.0010; LTGC: P= 0.2926; LTGC/total HR: P= 0.0316. b, RT qPCR analysis of Brca2 mRNA in siRNA-treated cells as shown.
Extended Data Figure 9. Rad51 contributes quantitatively and qualitatively to HR at stalled replication forks.
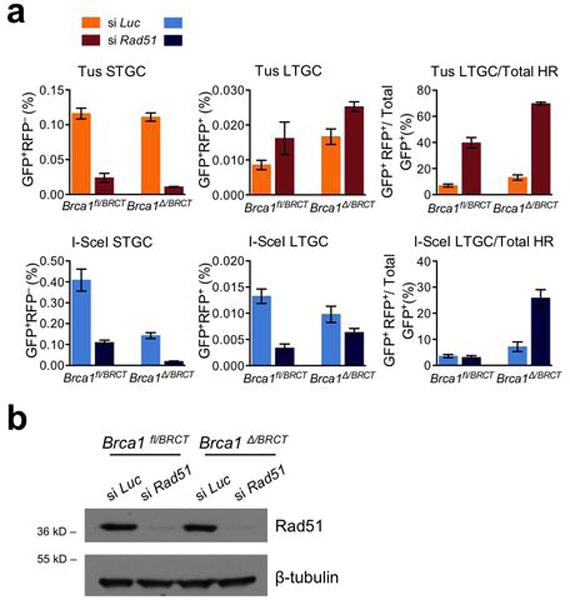
a, Frequencies of Tus-induced and I-SceI-induced HR in Brca1fl/BRCT and Brca1Δ/BRCT 6xTer/HR cells transiently co-transfected with Tus, or I-SceI and with either control Luciferase siRNA (si Luc) or Rad51 SMARTpool (si Rad51). Each column represents the mean of triplicate samples for each independent clone from seven independent experiments for Brca1fl/BRCT (i.e., n=7) and four independent experiments for Brca1Δ/BRCT cells (i.e., n=4). Error bars: s.e.m. Tus-induced HR, Brca1fl/BRCT cells, t-test si Rad51 vs. si Luc: STGC: P< 0.0001; LTGC: P= 0.1578; LTGC/total HR: P= 0.0002; Brca1Δ/BRCT cells, si Rad51 vs. si Luc: STGC: P= 0.0010; LTGC: P= 0.0676; LTGC/total HR: P< 0.0001. I-SceI-induced HR, Brca1fl/BRCT cells, t-test si Rad51 vs. si Luc: STGC: P= 0.0014; LTGC: P= 0.0002; LTGC/total HR: P= 0.6216; Brca1Δ/BRCT cells, si Rad51 vs. si Luc: STGC: P= 0.0068; LTGC: P= 0.2064; LTGC/total HR: P= 0.0186. b, Rad51 protein levels and beta-tubulin loading control in Brca1fl/BRCT and Brca1Δ/BRCT siRNA-treated cells as shown. (Source Data 8.)
Extended Data Figure 10. Effect of 53BP1 inhibition on Tus/Ter-induced HR.
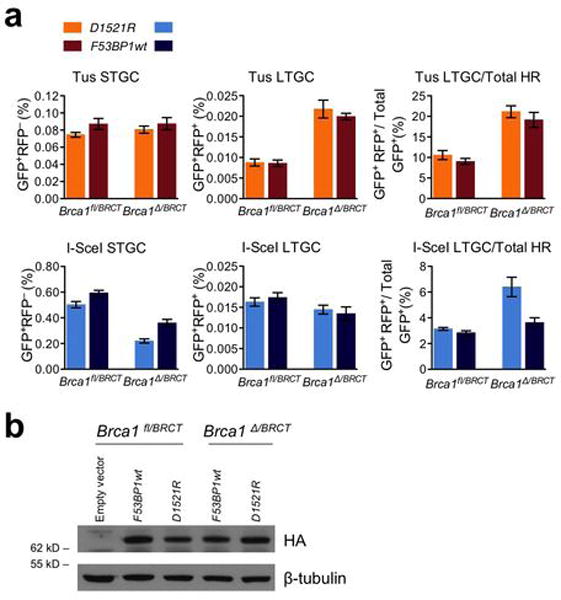
a, Frequencies of Tus-induced and I-SceI-induced HR in Brca1fl/BRCT and Brca1Δ/BRCT 6xTer/HR cells transiently co-transfected with Tus or I-SceI expression vectors and with either F53BP1 D1521R fragment (D1521R; non-chromatin-binding negative control for “dominant negative” 53BP1 fragment) or “dominant negative” F53BP1wt fragment (F53BP1wt). Each column represents the mean of triplicate samples for each independent clone from five independent experiments (i.e., n=5). Error bars: s.e.m. Tus-induced HR, Brca1fl/BRCT cells, t-test D1521R vs. F53BP1wt: STGC: P= 0.1818; LTGC: P= 0.9005; LTGC/total HR: P= 0.3570; Brca1Δ/BRCT cells, t-test D1521R vs. F53BP1wt: STGC: P= 0.5008; LTGC: P= 0.5375; LTGC/total HR: P= 0.4921. I-SceI-induced HR, Brca1fl/BRCT cells, t-test D1521R vs. F53BP1wt: STGC: P= 0.0442; LTGC: P= 0.5739 ; LTGC/total HR: P= 0.2250; Brca1Δ/BRCT cells, t-test D1521R vs. F53BP1wt: STGC: P= 0.0086; LTGC: P= 0.6888; LTGC/total HR: P= 0.0328. Tus-induced LTGC/total HR, Brca1fl/BRCT vs. Brca1Δ/BRCT cells, t-test F53BP1wt: 0.0064; Brca1fl/BRCT vs. Brca1Δ/BRCT cells, t-test D1521R: 0.0014; I-SceI-induced LTGC/total HR, Brca1fl/BRCT vs. Brca1Δ/BRCT cells, t-test F53BP1wt: 0.1556; Brca1fl/BRCT vs. Brca1Δ/BRCT cells, t-test D1521R: 0.0208. b, Abundance of 53BP1 fragments, and beta-tubulin (loading control) in treated Brca1fl/BRCT and Brca1Δ/BRCT 6xTer/HR reporter ES cells in (a). (Source Data 9.)
Acknowledgments
We thank B Michel for reagents and advice; D Livingston, K Marians, J Walter, I Hickson, S Powell, V Zakian and members of the Scully lab for helpful discussions; I Hickson and S Powell for sharing their unpublished data on Tus/Ter replication blocks in eukaryotes; R Baer for antibodies and A Ashworth for Brca1 conditional ES cell line 11CO/47T. This work was supported by NIH grants R01CA095175, R01GM073894 and R21CA144017 (to R.S.). N.A.W. was supported by an NIH/NCI postdoctoral fellowship (5T32 CA081156-10) and an ACS postdoctoral research fellowship (PF-12-248-01-DMC). C.F. was supported by NIH grant RO1GM26938 (to V.A.Z.).
Footnotes
Author Contributions
N.A.W., G.C. and R.S. designed experiments. N.A.W., G.C., B.H. and A.K. performed experiments. C.F. provided expert advice on execution of 2D gel electrophoresis experiments. C.D. generated Brca1 exon 11 conditional ES cells. N.A.W. analyzed the data. N.A.W. and R.S wrote the manuscript.
The authors declare that they have no competing financial interests.
References
- 1.Ciccia A, Elledge SJ. The DNA damage response: making it safe to play with knives. Mol Cell. 2010;40:179–204. doi: 10.1016/j.molcel.2010.09.019. [DOI] [PMC free article] [PubMed] [Google Scholar]
- 2.Nagaraju G, Scully R. Minding the gap: The underground functions of BRCA1 and BRCA2 at stalled replication forks. DNA Repair (Amst) 2007 doi: 10.1016/j.dnarep.2007.02.020. [DOI] [PMC free article] [PubMed] [Google Scholar]
- 3.Hastings PJ, Ira G, Lupski JR. A microhomology-mediated break-induced replication model for the origin of human copy number variation. PLoS Genetics. 2009;5:e1000327. doi: 10.1371/journal.pgen.1000327. [DOI] [PMC free article] [PubMed] [Google Scholar]
- 4.Kowalczykowski SC. Initiation of genetic recombination and recombination-dependent replication. Trends Biochem Sci. 2000;25:156–165. doi: 10.1016/s0968-0004(00)01569-3. [DOI] [PubMed] [Google Scholar]
- 5.Cox MM, et al. The importance of repairing stalled replication forks. Nature. 2000;404:37–41. doi: 10.1038/35003501. [DOI] [PubMed] [Google Scholar]
- 6.Michel B, Grompone G, Flores MJ, Bidnenko V. Multiple pathways process stalled replication forks. Proc Natl Acad Sci U S A. 2004;101:12783–12788. doi: 10.1073/pnas.0401586101. [DOI] [PMC free article] [PubMed] [Google Scholar]
- 7.Lambert S, et al. Homologous recombination restarts blocked replication forks at the expense of genome rearrangements by template exchange. Mol Cell. 2010;39:346–359. doi: 10.1016/j.molcel.2010.07.015. [DOI] [PubMed] [Google Scholar]
- 8.Carr AM, Lambert S, Replication Stress-Induced. Genome Instability: The Dark Side of Replication Maintenance by Homologous Recombination. J Mol Biol. 2013 doi: 10.1016/j.jmb.2013.04.023. [DOI] [PubMed] [Google Scholar]
- 9.Scully R, Livingston DM. In search of the tumour-suppressor functions of BRCA1 and BRCA2. Nature. 2000;408:429–432. doi: 10.1038/35044000. [DOI] [PMC free article] [PubMed] [Google Scholar]
- 10.Lomonosov M, Anand S, Sangrithi M, Davies R, Venkitaraman AR. Stabilization of stalled DNA replication forks by the BRCA2 breast cancer susceptibility protein. Genes Dev. 2003;17:3017–3022. doi: 10.1101/gad.279003. [DOI] [PMC free article] [PubMed] [Google Scholar]
- 11.Pathania S, et al. BRCA1 is required for postreplication repair after UV-induced DNA damage. Mol Cell. 2011;44:235–251. doi: 10.1016/j.molcel.2011.09.002. [DOI] [PMC free article] [PubMed] [Google Scholar]
- 12.Schlacher K, et al. Double-strand break repair-independent role for BRCA2 in blocking stalled replication fork degradation by MRE11. Cell. 2011;145:529–542. doi: 10.1016/j.cell.2011.03.041. [DOI] [PMC free article] [PubMed] [Google Scholar]
- 13.Amin AA, Hurwitz J. Polar arrest of the simian virus 40 tumor antigen-mediated replication fork movement in vitro by the tus protein-terB complex of Escherichia coli. J Biol Chem. 1992;267:18612–18622. [PubMed] [Google Scholar]
- 14.Hill TM, Marians KJ. Escherichia coli Tus protein acts to arrest the progression of DNA replication forks in vitro. Proc Natl Acad Sci USA. 1990;87:2481–2485. doi: 10.1073/pnas.87.7.2481. [DOI] [PMC free article] [PubMed] [Google Scholar]
- 15.Bidnenko V, Ehrlich SD, Michel B. Replication fork collapse at replication terminator sequences. EMBO J. 2002;21:3898–3907. doi: 10.1093/emboj/cdf369. [DOI] [PMC free article] [PubMed] [Google Scholar]
- 16.Mulcair MD, et al. A molecular mousetrap determines polarity of termination of DNA replication in E. coli. Cell. 2006;125:1309–1319. doi: 10.1016/j.cell.2006.04.040. [DOI] [PubMed] [Google Scholar]
- 17.Dhar SK, et al. Replication from oriP of Epstein-Barr virus requires human ORC and is inhibited by geminin. Cell. 2001;106:287–296. doi: 10.1016/s0092-8674(01)00458-5. [DOI] [PubMed] [Google Scholar]
- 18.Kirchmaier AL, Sugden B. Plasmid maintenance of derivatives of oriP of Epstein-Barr virus. J Virol. 1995;69:1280–1283. doi: 10.1128/jvi.69.2.1280-1283.1995. [DOI] [PMC free article] [PubMed] [Google Scholar]
- 19.Gahn TA, Schildkraut CL. The Epstein-Barr virus origin of plasmid replication, oriP, contains both the initiation and termination sites of DNA replication. Cell. 1989;58:527–535. doi: 10.1016/0092-8674(89)90433-9. [DOI] [PubMed] [Google Scholar]
- 20.Chandramouly G, et al. BRCA1 and CtIP suppress long-tract gene conversion between sister chromatids. Nat Commun. 2013;4:2404. doi: 10.1038/ncomms3404. [DOI] [PMC free article] [PubMed] [Google Scholar]
- 21.Raschle M, et al. Mechanism of replication-coupled DNA interstrand crosslink repair. Cell. 2008;134:969–980. doi: 10.1016/j.cell.2008.08.030. [DOI] [PMC free article] [PubMed] [Google Scholar]
- 22.Castor D, et al. Cooperative control of holliday junction resolution and DNA repair by the SLX1 and MUS81-EME1 nucleases. Mol Cell. 2013;52:221–233. doi: 10.1016/j.molcel.2013.08.036. [DOI] [PMC free article] [PubMed] [Google Scholar]
- 23.Garner E, Kim Y, Lach FP, Kottemann MC, Smogorzewska A. Human GEN1 and the SLX4-associated nucleases MUS81 and SLX1 are essential for the resolution of replication-induced Holliday junctions. Cell Rep. 2013;5:207–215. doi: 10.1016/j.celrep.2013.08.041. [DOI] [PMC free article] [PubMed] [Google Scholar]
- 24.Johnson RD, Jasin M. Sister chromatid gene conversion is a prominent double-strand break repair pathway in mammalian cells. EMBO J. 2000;19:3398–3407. doi: 10.1093/emboj/19.13.3398. [DOI] [PMC free article] [PubMed] [Google Scholar]
- 25.Nagaraju G, Odate S, Xie A, Scully R. Differential regulation of short- and long-tract gene conversion between sister chromatids by Rad51C. Mol Cell Biol. 2006;26:8075–8086. doi: 10.1128/MCB.01235-06. [DOI] [PMC free article] [PubMed] [Google Scholar]
- 26.Huber LJ, et al. Impaired DNA damage response in cells expressing an exon 11-deleted murine Brca1 variant that localizes to nuclear foci. Mol Cell Biol. 2001;21:4005–4015. doi: 10.1128/MCB.21.12.4005-4015.2001. [DOI] [PMC free article] [PubMed] [Google Scholar]
- 27.Xu X, et al. Conditional mutation of Brca1 in mammary epithelial cells results in blunted ductal morphogenesis and tumour formation. Nature Genet. 1999;22:37–43. doi: 10.1038/8743. [DOI] [PubMed] [Google Scholar]
- 28.Llorente B, Smith CE, Symington LS. Break-induced replication: what is it and what is it for? Cell Cycle. 2008;7:859–864. doi: 10.4161/cc.7.7.5613. [DOI] [PubMed] [Google Scholar]
- 29.Saini N, et al. Migrating bubble during break-induced replication drives conservative DNA synthesis. Nature. 2013;502:389–392. doi: 10.1038/nature12584. [DOI] [PMC free article] [PubMed] [Google Scholar]
- 30.Follonier C, Lopes M. Combined bidimensional electrophoresis and electron microscopy to study specific plasmid DNA replication intermediates in human cells. Methods Mol Biol. 2014;1094:209–219. doi: 10.1007/978-1-62703-706-8_16. [DOI] [PubMed] [Google Scholar]
- 31.Chandramouly G, et al. BRCA1 and CtIP suppress long-tract gene conversion between sister chromatids. Nat Commun. 2013;4:2404. doi: 10.1038/ncomms3404. [DOI] [PMC free article] [PubMed] [Google Scholar]
- 32.Xie A, et al. Distinct roles of chromatin-associated proteins MDC1 and 53BP1 in mammalian double-strand break repair. Mol Cell. 2007;28:1045–1057. doi: 10.1016/j.molcel.2007.12.005. [DOI] [PMC free article] [PubMed] [Google Scholar]
- 33.Xie A, et al. Control of sister chromatid recombination by histone H2AX. Mol Cell. 2004;16:1017–1025. doi: 10.1016/j.molcel.2004.12.007. [DOI] [PMC free article] [PubMed] [Google Scholar]
- 34.Puget N, Knowlton M, Scully R. Molecular analysis of sister chromatid recombination in mammalian cells. DNA Repair (Amst) 2005;4:149–161. doi: 10.1016/j.dnarep.2004.08.010. [DOI] [PMC free article] [PubMed] [Google Scholar]
- 35.Follonier C, Lopes M. Combined bidimensional electrophoresis and electron microscopy to study specific plasmid DNA replication intermediates in human cells. Methods Mol Biol. 2014;1094:209–219. doi: 10.1007/978-1-62703-706-8_16. [DOI] [PubMed] [Google Scholar]