Abstract
Objective
This study evaluated a 24-hour resuscitation protocol; established a formula to quantify resuscitation volume for the second 24 hours; described the relationship between the first and second 24 hours; and, identified which patients required high volumes.
Methods
A protocol for >15% TBSA burn-injured patients was implemented in 2009. Initial fluid was based on Parkland's calculation, and adjusted to meet a goal urine output. Protocol compliance was defined as appropriate fluid titration to maintain urine output. Resuscitation ratio in the second 24 hours was tabulated as total fluid /(evaporative loss+maintenance fluid+estimated colloid). Data were prospectively collected from 2009-2011. Wilcox rank test compared differences between groups. Regression analyses analyzed volume administered. P< 0.05 was statistically significant.
Results
40 patients with ≥ 15% TBSA burn injury met criteria for inclusion. Mean age, burn size, and resuscitation volumes in the first and second 24 hours were as follows (mean ± SD): 47± 20.7 years, 29.9 ± 14.6% TBSA, 7.4 ±3.7 cc/kg/% TBSA, and a ratio of 1.9 times expected volume (SD=1.3), respectively. Protocol compliance was 34%. Intubation, older age, and increased narcotic administration correlated with higher resuscitation volumes. A higher resuscitation volume in the first 24 hours significantly correlated with a higher resuscitation volume in the second 24 hours (p<0.001).
Conclusions
There is a significant relationship between fluid administration in the first and second 24 hours of resuscitation; intubation, older age, and narcotics correlate with higher volumes. A formula for observed/expected volumes in the second 24 hours is total fluid/(evaporative loss+maintenance fluid+estimated colloid).
Keywords: Resuscitation, fluid protocol, crystalloid, colloid
Introduction
Investigators have analyzed the etiology of excessive fluid administration in acute burn injury over the past decade, though the “fluid creep” phenomenon remains a vexing issue [1]. Since Basil Pruitt coined the term “fluid creep” in 2000, multiple institutions have confirmed that their current resuscitation volumes are at least one-and-a-half times those predicted by Charles Baxter's original Parkland formula [2-7]. The Parkland formula provides a framework for appropriate fluid resuscitation based on body weight and percent total body surface area (TBSA) burn to maintain end-organ perfusion. Volumes administered in excess of its 4 cc/kg/%TBSA recommendation may result in devastating complications such as abdominal compartment syndrome (ACS) [8].
Efforts to raise awareness of and offer solutions to excessive fluid resuscitation include “colloid rescue,” minimizing opioid administration, instituting fluid resuscitation protocols, and utilizing “closed loop” computer-driven protocols [9-12]. Some burn centers also have advocated the utilization of an intake and output ratio (I/O) as a means of more effectively assessing resuscitation than simple volume alone [13].
This discussion of “fluid creep” has been focused on the first 24 hours of resuscitation. This is despite the fact that the Parkland calculation provides guidance for the full 48 hours of resuscitation following injury. There are few recent reports on the volume of fluid given in the second 24 hours of resuscitation.
A historical review of resuscitation practices in a specific subset of patients from 2001-2004 at this institution revealed that resuscitation values averaged 8.3 cc/kg/%TBSA in resuscitated patients with an average burn size of 27% TBSA, and that resuscitation volumes were higher in intubated patients compared to those who never were on ventilators [14]. In response to the results of this audit, this burn center implemented a nurse-driven fluid resuscitation protocol for the first 24 hours of resuscitation.
The burn center then sought to evaluate this 24-hour protocol; establish a formula to quantify resuscitation volume for the second 24 hours utilizing an observed/expected (O/E) ratio with the Parkland formula as denominator; describe the relationship between the first and second 24 hours of resuscitation; and, identify which patients require high resuscitation volumes. It was hoped that this data ultimately could guide resuscitation practices and improve patient care.
The hypothesis was that there would be a relationship between the first and second 24 hours of resuscitation volumes; and, age, ventilator dependence, and analgesic/sedative medications would be associated with an increase in resuscitation volumes. Though it was thought that the implementation of a protocol likely would result in lower resuscitation volumes, other centers previously had demonstrated this to be true, and thus was not a primary focus of this study.
Methods
This was a prospective observational study of patients admitted to this burn center and resuscitated using a nurse-driven protocol for treatment of acute burns >15% TBSA from August 2009 to August 2011. Prior to initiation of the protocol and collection of patient data, the burn center received Institutional Board Review approval from the Weill Cornell Medical College. Attending surgeons, residents, and nursing staff underwent extensive in-service education.
All patients who were 15 years or older, greater than 30 kilograms, arrived to the burn center within eight hours of their burn injury, and survived longer than 72 hours were included in the study. Exclusion criteria included those patients who did not meet these characteristics, as well as those who suffered associated trauma or electrical injury. Study data were collected and managed using REDCap (Research Electronic Data Capture) electronic data capture tool hosted at the Clinical and Translational Resource Center at Weill Cornell Medical College [15].
Demographic data collected on the patients included age, gender, admit height and weight, burn size, time from injury to arrival at burn center, and cause of burn. Respiratory data included presence of inhalational injury (IHI) as defined by the inhalation of smoke or thermal elements [16]. Admission bronchoscopy with presence of soot in airway and consensus by burn center attending surgeons during monthly review of every case were used to determine inhalation in this patient population.
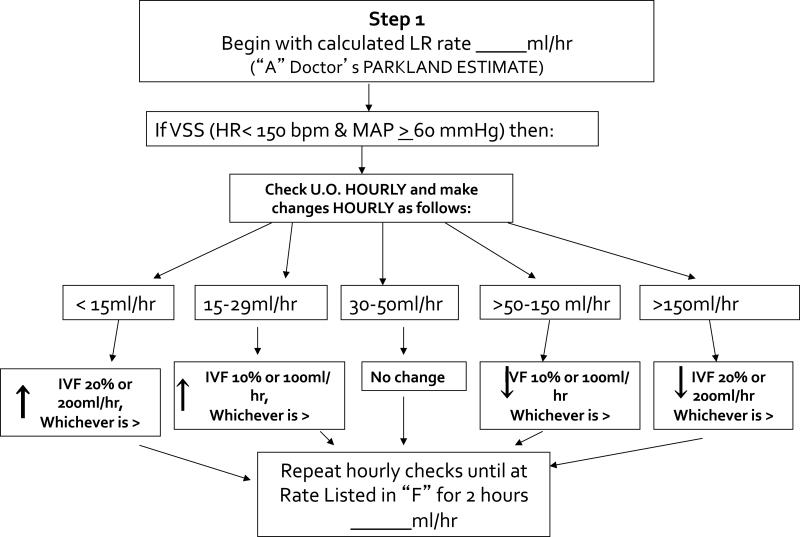
The 24-hour resuscitation protocol was modeled after that proposed by the University of Utah [5]. See Figure 1. Data collected included total number of hours of resuscitation of 48 possible hours, hourly intravenous fluid (crystalloid plus colloid, if administered) and enteral supplementation, urine output, time colloid started post-burn, and record of whether the protocol was followed each hour. Protocol compliance was defined as appropriate fluid titration (per protocol diagram) in response to urine output.
Figure 1.
Adult Fluid Resuscitation Algorithm
Though the resuscitation protocol ended after the initial 24 hours, the administered fluid and urine output data was recorded until the 48-hour mark. The resuscitation volume for the first 24 hours was quantified using the total fluid given (cc) divided by kilogram of body weight divided by percent TBSA burn, and an O/E ratio was quantified; expected ratio was defined as 4 cc/kg/%TBSA.
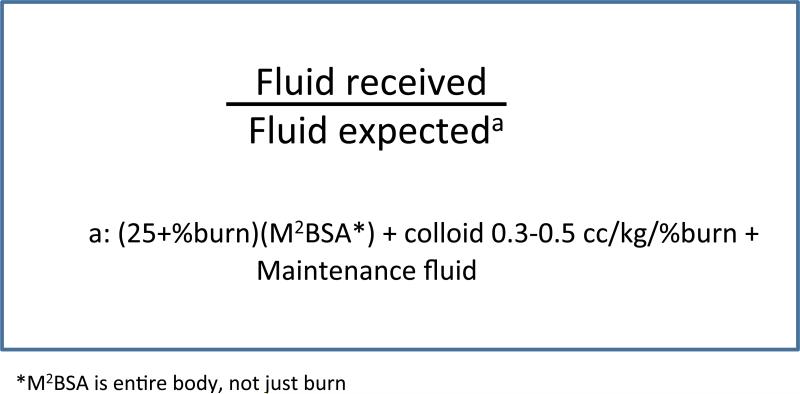
The resuscitation volume for the second 24 hours was quantified as O/E with actual fluid given divided by ((25+%burn) × M2BSA)) × 24 + colloid 0.3-0.5cc/kg/%TBSA + maintenance fluid. This expected value was based on a combination of the modified Brooke formula and Parkland formula that replaces plasma volume deficit with colloid, as described by David Herndon in Total Burn Care, as well as Basil Pruitt (17, 18). It is the formula that this institution uses as guidance for the 2nd 24 hours of resuscitation. M2BSA represented the entire body surface area of each patient (not just the burn), and its units are (meters)2. 0.3 cc/kg/%TBSA was used as the figure for calculation purposes. Ideal hourly maintenance fluid was calculated for each patient, based on individual body weights: 4 ml/kg for the first 10kg of body weight, 2 ml/kg for the next 10 kg, and 1 ml/kg for every kg over 20. Because there was no protocol for the second 24 hours, this formula served only as a guide for resuscitation, and the amount of colloid and time of administration was determined by the attending physician on call. See Figure 2.
Figure 2.
Equation for quantifying second 24 hours of resuscitation
The total milligrams (mg) of lorazepam administered in the first and second 24 hours was recorded, as was the total mg of intravenous (IV) morphine equivalent in the first and second 24 hours. Ten mg IV morphine was equivalent to 30 mg PO morphine to 1.5 mg IV dilaudid to 7.5 mg PO dilaudid to 100 mcg IV fentanyl. Length of stay, death, and total number of days on ventilator as percentage of total admission days was recorded for outcome measures. Continuous variables are presented as mean ± standard deviation (range).
Data was analyzed in Stata version 11. Linear regression analyses were used for continuous outcome variables. Logistic regression analyses were used for dummy-coded outcome variables. P value less than 0.05 was considered statistically significant.
Results
One thousand seven hundred and seventy two patients were admitted to the burn center between August 2009-August 2011. Forty patients met inclusion criteria and were included in the analysis. Six additional patients had > 15% burn but were excluded as follows: four age < 15, one death within 72 hours, and one who arrived to the burn center > 8 hours after injury. See Figure 3. Thirty patients (75%) were male. The mean age was 47.2 years ±0.7 (15-92). Mean burn size was 29.9% ±14.6 (15-70%). Twelve patients (31.6%) suffered IHI; the total number of patients (including all with IHI) intubated was 18 (45%). The average length of stay (LOS) was 51.6 days (±65.3) and there were eight deaths (20.5%). Burn injury secondary to flame exposure occurred in 32 patients (80%) and scald or steam exposure in 8 (20%). Nine patients suffered third degree burn injury, with a mean third degree size of 7.1 %TBSA ± 16.1 (0-70) See Table 1.
Figure 3.
1st 24 hours versus 2nd 24 hours resuscitation volume
Table 1.
Demographic Data
| Measurement | Total patients=40 |
|---|---|
| Male, N(%) | 30 (75) |
| Age, mean (SD) | 47 (21) |
| Burn size %, mean (SD) | 29.9 (14.6) |
| Mean 3rd degree (SD) | 7.1 (16.1) |
| Inhalation injury, N(%) | 12(31.6) |
| Intubation, N(%) | 18(45) |
| Length of stay (days), mean (SD) | 51.6(65.5) |
| Deaths, N(%) | 8(20.5) |
| Cause of burn, N(%) | Flame 32(80), hot water 8 (20) |
Overall protocol compliance in all patients and all resuscitation hours was 34%. Nine patients (23%) received appropriate fluid protocol titration >50% of time in their initial 24 hours of resuscitation. Protocol compliance was defined as appropriate fluid titration each hour based on hourly urine output. For example, if a patient made 200 cc of urine in the previous hour, then the intravenous fluid should have been decreased in the next hour by 200cc or 20% of the previous hour's rate (whichever value was greater). If this change was not made properly, then that hour was considered non-compliant with protocol.
Compared with historical experience at this institution that demonstrated resuscitation volumes of 8.3 cc/kg/%TBSA, The average resuscitation volume for the first 24 hours was 7.4 cc/kg/%TBSA ±3.7; the O/E ratio was 1.85 + 0.92. Based on Wilcoxon signed rank sum test, the difference between 8.3 and 7.4 was not statistically significant. The average O/E ratio for the second 24 hours was 1.9 ±1.3.
The average fluid volume administered in the first 24 hours was 15,649 ml ± 8,704 (4,395-37,283). The average fluid volume administered in the second 24 hours was 9,464 ml ± 6,862 (2,808-43,276). Average pre-burn center fluid was 2,427 ml ±1865 (0-6,000). The average volume of colloid fluid administered was 1194 cc ± 718 (310-3900). The average hour of resuscitation colloid was started was 22. Colloid was used in 27 patients. See Table 2.
Table 2.
Resuscitation Data
| Protocol and Fluid data | |
|---|---|
| Overall protocol compliance, N(%) | 34% |
| Individual patients with >50% protocol compliance, N(%) | 9 (23%) |
| Average resuscitation volume 1st 24 hours, mean (SD) | 7.4(3.7) |
| Observed/expected volume ratio, 2nd 24 hours, mean (SD) | 1.9(1.3) |
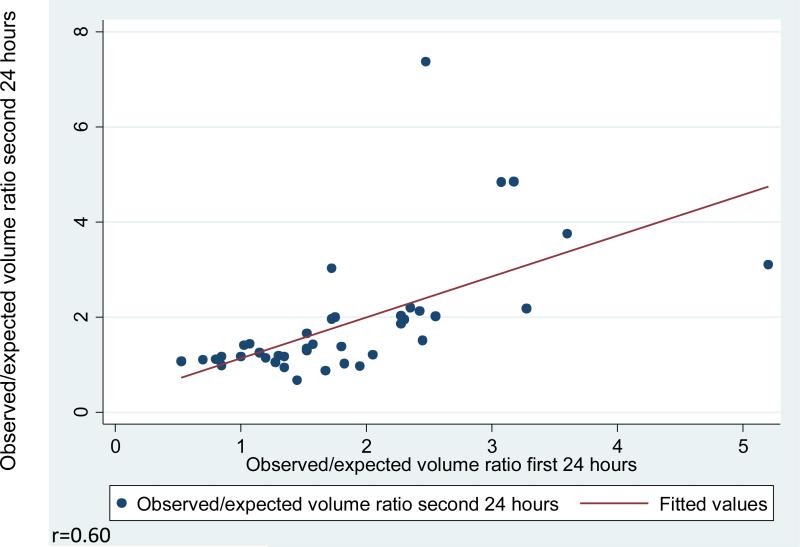
A higher resuscitation volume in the first 24 hours significantly correlated with a high resuscitation volume in the second 24 hours (p<0.001). See Figure 4. The second 24 hour volume averaged 2/3 the value of the first 24 hour volume. Patients with resuscitation volumes > 8 cc/kg/%TBSA had a ten times higher mortality rate than those less than 8 (odds ratio 10.29, CI 95%, 1.69-62.74, p=0.012). There was a statistically significant relationship between increased fluid volume and increased %TBSA burn (p<0.001). Fluid volume for patient outcomes resulting in death also was statistically significantly higher (p<0.001).
Figure 4.
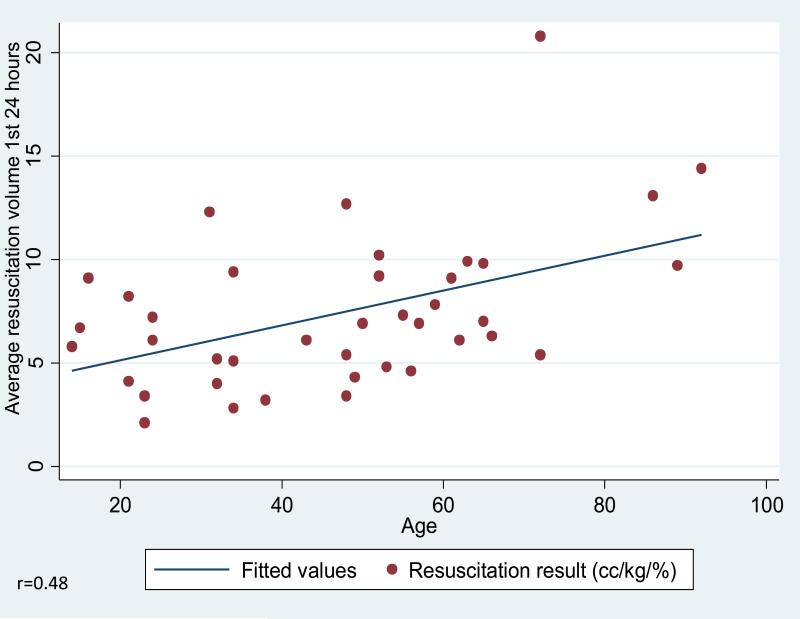
Age and Resuscitation Volume
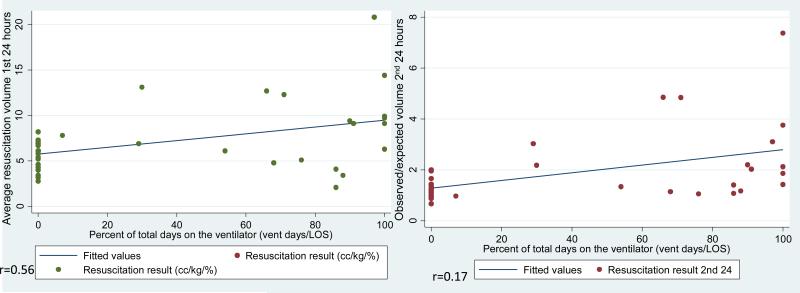
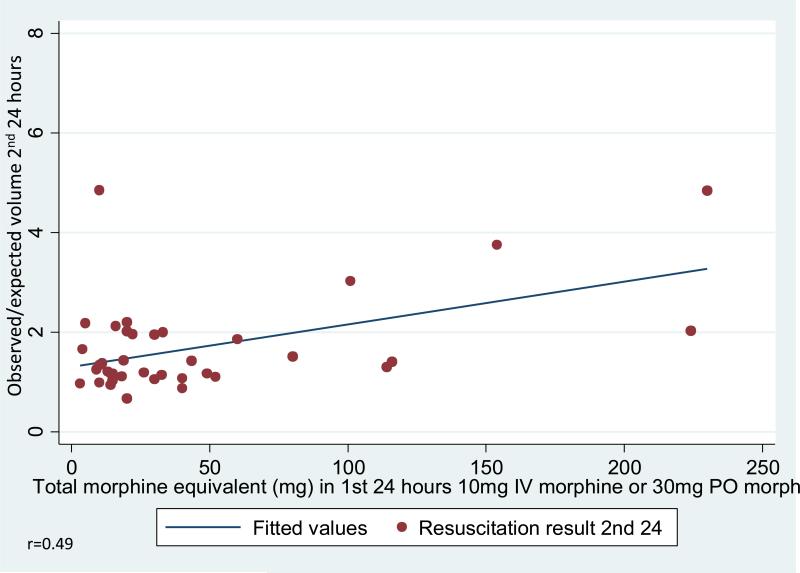
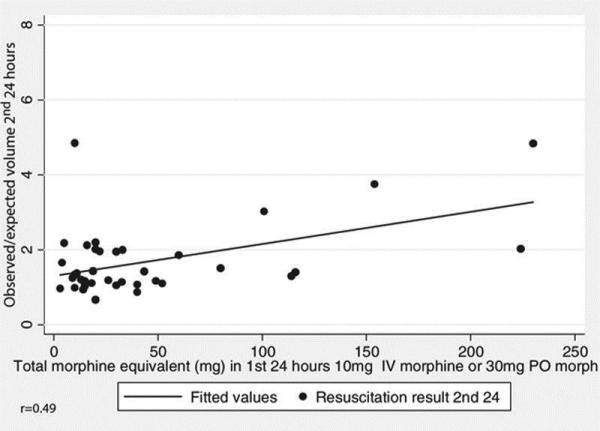
Increased age was significantly associated with an increased resuscitation volume in the first 24 hours (p=0.002). See figure 4. Resuscitation volume in the second 24 hours trended to increase (p=0.055) with advancing age. See Figure 5. Increased ventilator dependence was associated with increased resuscitation volume in the first (p<0.001) and second 24 hour periods (p=0.003). See Figure 6. Higher doses of morphine equivalents in either the first or second 24 hours was associated with increased resuscitation volume in the second 24 hours (p=0.002 for the first 24 hours and p=0.026 for the second 24 hours). See Figure 7.
Figure 5.
Ventilator dependence and resuscitation volume
Figure 6.
Narcotics and resuscitation volume
Figure 7.
CONSORT diagram showing the flow of participants through enrollment
There was no significant relationship observed between the following: IHI injury versus no IHI injury on any statistical testing; benzodiazepines and resuscitation volumes; IHI and LOS; IHI or age and protocol compliance; protocol compliance and death. Burn size did not correlate with increased number of days on ventilator or opiod use.
Discussion
This review of 48 hours of resuscitation practice at a single institution shows that large volume-resuscitation in the first 24 hours correlates with large volume-resuscitation in the second 24 hours. Increased age, narcotic use, and ventilator dependence also correlated with larger-volume resuscitation. There is no statistically significant decrease in fluid volume between historical numbers in a specific patient subset and that observed after the institution of a protocol. This suggests that regardless of some compliance with a protocol, both provider practices and underlying patient comorbidities and burn size may cause difficulty in maintaining resuscitation volumes close to those predicted by the Parkland formula.
A recent study that Utah conducted on its experience with a nurse-driven fluid protocol confirms that despite initiation of a protocol, volumes nevertheless remain higher than those predicted by the Parkland formula. In this study, Utah reported that patients with larger burn sizes demonstrated increased fluid resuscitation volumes regardless of nursing efforts to comply with protocol [19]. In addition, though Cartotto and Zhou did not implement a resuscitation protocol at their institution, they nevertheless demonstrate high fluid volumes that have not decreased over time [4]. This corroborates previous audits conducted in Seattle on volumes in the 1970s compared against the 2000's; increased volume above that predicted by the Parkland formula is a newer phenomenon, though few have demonstrated consistent and widely-applicable means of reducing this volume [7]. The most promising means of reducing resuscitation volumes have been demonstrated through the use of computer algorithms, which show with increased provider instruction and exposure, can reduce volumes administered compared with non-computerized controls [12].
In addition to the observational and uncontrolled nature of this study, limitations include no data on factors known to increase resuscitation volumes: patient drug or alcohol use. Acid-base status of patients also was not collected, and would be a consideration for future studies. The small patient sample size is not unusual in studies of this nature in burn-injured patients, though this institution continues to record new patients and will aim for future studies with increased inclusion numbers. Although the death rate compared with patient groups of similar ages, % TBSA, and inhalational injury was consistent with national averages, this study was underpowered and generalizations about fluid administration cannot be made until prospective testing is undertaken. [20].
This study demonstrated a low provider protocol compliance with limited understanding of contributory factors, or when and why providers deviated from protocol. Due to the low protocol compliance, this study ultimately provided information about resuscitation volumes at this burn center, but not whether the protocol itself contributed to these resuscitation volumes. Protocol compliance was defined strictly (as described in “methods”), and the low statistical compliance potentially resulted from this strict definition. If the protocol mandated that the patient needed fluid decreased by 100 cc and it only was decreased by 75 cc, it was considered a non-compliant hour. Nevertheless, there was no structure in place for nurses or physicians to record the reason for potential protocol compliance, and this would represent an improvement in the future. For example, in this study, there was no structure to record protocol deviation in response to patient hemodynamic instability. Overall, this represents an opportunity for investigation into potential drivers of this quality adherence in this burn center and potential protocol adjustments and/or further improvement in care.
These results regarding protocol compliance also may suggest that adjunctive agents such as ionotropes or Vitamin C could be beneficial going forward [21-23]. Hypertonic saline may decrease fluid requirements in the first 24 hours of resuscitation and may represent another potential intervention to increase protocol compliance [24-25]. Further, a recent study has suggested that hydroxyethyl starch provided more effective resuscitation and resulted in fewer inflammatory mediators than crystalloid resuscitation [26].
Though this institution did not demonstrate that the first 24 hours of resuscitation directly affected the second 24 hours, it did show an observational correlation between both periods of time. While O/E is not a novel concept, this institution hoped that sharing data from the second 24 hours of resuscitation and argue that that resuscitation studies should include the full 48 hours of resuscitation. We hoped that creating an O/E equation would establish a reference value for the second 24 hours, the way that 4 cc/kg/%TBSA exists for the first 24 hours. Thus, this experience argues for multi-institutional, randomized controlled studies on fluid resuscitation protocols based on the full 48 hours of resuscitation. To provide an ideal value for resuscitation volume in the second 24 hours, these studies could utilize the formula total fluid given/(evaporative loss+maintenance fluid+estimated colloid).
Based on this burn center's experience and other data reported in the literature, resuscitation volumes in excess of those predicted by the Parkland Formula remain widespread and difficult to reduce despite implementation of protocols at individual institutions. Thus, this institution advocates joining together in nationwide collaboration to study resuscitation volumes in standardized, universal protocol format across 48 hours in relation to burn size and patient comorbidities.
Acknowledgements
Abraham Huong, MD; Katie Pulick, RN, The Weill Cornell Medical College Clinical Translational Science Center (CTSC) (NIH UL1-RR024996) are acknowledged for Mr. Shao's effort.
Financial disclosures: The Clinical and Translational Science Center grant UL1-RR024996 supported the use of the REDCap data management system in this study.
Supported in part by a grant from the New York Firefighters Burn Center Foundation.
Footnotes
Disclosures: No conflicts of interest
References
- 1.Pruitt BA. Protection from excess resuscitation: “pushing the pendulum back.”. J Trauma. 2000;49:567–8. doi: 10.1097/00005373-200009000-00030. [DOI] [PubMed] [Google Scholar]
- 2.Endorf FW, Dries DJ. Burn resuscitation. Scand J Trauma ResuscEmerg Med. 2011;19:69. doi: 10.1186/1757-7241-19-69. 98. [DOI] [PMC free article] [PubMed] [Google Scholar]
- 3.Baxter CR, Shires GT. Physiological response to crystalloid resuscitation of severe burns. Ann NY AcadSci. 1968;150:874–894. doi: 10.1111/j.1749-6632.1968.tb14738.x. [DOI] [PubMed] [Google Scholar]
- 4.Cartotto R, Zhou A. Fluid creep: The pendulum hasn't swung back yet! J Burn Care Res. 2010;31:551–558. doi: 10.1097/BCR.0b013e3181e4d732. [DOI] [PubMed] [Google Scholar]
- 5.Saffle JL. The phenomenon of “fluid creep” in acute burn resuscitation. JBCR. 2007;28:382–5. doi: 10.1097/BCR.0B013E318053D3A1. [DOI] [PubMed] [Google Scholar]
- 6.Cartotto RC, Innes M, Musgrave MA, et al. How well does the Parkland Formula estimate actual fluid resuscitation volumes? J Burn Care Res. 2002;23:258–65. doi: 10.1097/00004630-200207000-00006. [DOI] [PubMed] [Google Scholar]
- 7.Friedrich JB, Sullivan, Engrav LH, et al. Is supra-Baxter resuscitation in burn patients a new phenomenon? Burns. 2004;30:464–6. doi: 10.1016/j.burns.2004.01.021. [DOI] [PubMed] [Google Scholar]
- 8.Kirkpatrick AW, Ball CG, Nickerson D. Intraabdominal hypertension and the abdominal compartment syndrome in burn patients. World J Surg. 2009;33:1142–49. doi: 10.1007/s00268-009-9995-4. [DOI] [PubMed] [Google Scholar]
- 9.Sullivan SR, Friedrich JB, Engrav LH, et al. “Opiod creep” is real and may be the cause of “fluid creep.”. Burns. 2004;30:583–90. doi: 10.1016/j.burns.2004.03.002. [DOI] [PubMed] [Google Scholar]
- 10.Engrav LH, Colescott PL, Kemalyan N, et al. A biopsy of the use of the Baxter formula to resuscitate burns or do we do it like Charlie did it? J Burn Care Rehabil. 2000;21:91–95. doi: 10.1097/00004630-200021020-00002. [DOI] [PubMed] [Google Scholar]
- 11.Lawrence A, Faraklas I, Watkins H, et al. Colloid administration normalizes resuscitation ratio and ameliorates “fluid creep.”. J Burn Care Res. 2010;31:40–7. doi: 10.1097/BCR.0b013e3181cb8c72. [DOI] [PubMed] [Google Scholar]
- 12.Salinas J, Chung KK, Mann EA, et al. Computerized decision support system improves fluid resuscitation following severe burns: An original study. Crit Care Med. 2011;39:2031–2038. doi: 10.1097/CCM.0b013e31821cb790. [DOI] [PubMed] [Google Scholar]
- 13.Kelly J, McLaughlin D, Rittenour A, Simmos IIJ, Wade C, Wolf S. A novel means by which to classify the response to acute resuscitation in the severely burned patients. J Burn Care Rehabil. 2008;29:S50. [Google Scholar]
- 14.Gallagher J, Houng A, Rabbits A, et al. Does mechanical ventilation alter fluid requirements in burn shock?. Supplement to Journal of Burn Care and Rehabilitation; Presented at 37th Annual Meeting; Chicago Ill. May 10-13 2005.Apr, 2005. p. S92. [Google Scholar]
- 15.Harris PA, Taylor R, Thielke R, et al. Research electronic data capture (REDCap)-A metadata-driven methodology and workflow process for providing translational research informatics support. J Biomed Inform. 2009;42:377–81. doi: 10.1016/j.jbi.2008.08.010. [DOI] [PMC free article] [PubMed] [Google Scholar]
- 16.Rehberg S, Maybauer MO, Enkhbaatar P, et al. Pathophysiology, management, and treatment of smoke inhalation injury. Expert Rev Resp Medicine. 2009;3:283–297. doi: 10.1586/ERS.09.21. [DOI] [PMC free article] [PubMed] [Google Scholar]
- 17.Warden GD. Fluid resuscitation and early management. In: Herndon D, editor. Total burn care. 2nd ed. Philadelphia, PA: 2002. p. 95. [Google Scholar]
- 18.Pruitt BA., Jr. Advances in fluid therapy and the early care of the burn patient. World J. Surg. 1978;2:139–150. doi: 10.1007/BF01553536. [DOI] [PubMed] [Google Scholar]
- 19.Faraklas I, Cochran A, Saffle J. Review of a fluid resuscitation protocol: “fluid creep” is not due to nursing error. J Burn Care Res. 2012;1:74–83. doi: 10.1097/BCR.0b013e318234d949. [DOI] [PubMed] [Google Scholar]
- 20.McGwin G, Jr, Cross JM, Ford JW, et al. Long-term trends in mortality according to age among adult burn patients. J Burn Care Res. 2003;24:21–25. doi: 10.1097/00004630-200301000-00006. [DOI] [PubMed] [Google Scholar]
- 21.Shah A, Connolly CM, Kirschner RA, et al. Evaluation of hyperdynamic resuscitation in 60% TBSA burn-injured sheep. Shock. 2004;21:86–92. doi: 10.1097/01.shk.0000101666.49265.b4. [DOI] [PubMed] [Google Scholar]
- 22.Kahn SA, Beers RJ, Lentz CW. Resuscitation after severe burn injury using high-dose ascorbic acid: a retrospective review. J Burn Care Res. 2011;32:110–7. doi: 10.1097/BCR.0b013e318204b336. [DOI] [PubMed] [Google Scholar]
- 23.Dubick MA, Williams C, Elgjo GL, et al. High-dose vitamin c infusion reduces fluid requirements in the resuscitation of burn-injured sheep. Shock. 2005;24:139–44. doi: 10.1097/01.shk.0000170355.26060.e6. [DOI] [PubMed] [Google Scholar]
- 24.Belba MK, Petrela EY, Belba GP. Comparison of hypertonic vs isotonic fluids during resuscitation of severely burned patients. Am J Emerg Med. 2009;27:1091–6. doi: 10.1016/j.ajem.2008.08.008. [DOI] [PubMed] [Google Scholar]
- 25.Hartford EC. Invited critique: fluid creep. J Burn Care and Res. 2007;5:770–772. doi: 10.1097/BCR.0b013e318148cba7. [DOI] [PubMed] [Google Scholar]
- 26.James MF. Place of the colloids in fluid resuscitation of the traumatized patient. CurrOpinAnaesthesiol. 2011 Dec 21; doi: 10.1097/ACO.0b013e32834fcede. [DOI] [PubMed] [Google Scholar]


