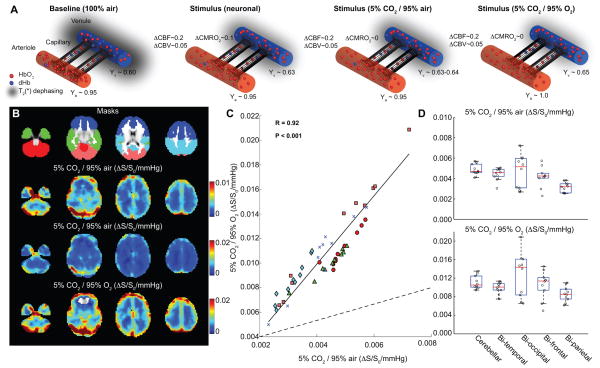
Figure 1. Hypercarbic gas comparison.
(A) Graphical representations of fractional changes in oxy-hemoglobin (HbO2) relative to deoxy-hemoglobin (dHb) at baseline and for different stimuli. For neuronal stimuli, cerebral blood flow (CBF), cerebral blood volume (CBV) and the cerebral metabolic rate of oxygen consumption (CMRO2) all increase, causing a small increase in venous oxygenation (Yv) in veins. For 5%CO2/95%air, CBF and CBV increase only. For hypercarbic hyperoxia (i.e., carbogen; 5%CO2/95%O2), CBF and CBV increase, however increases in the partial pressure of arterial oxygen will lead to elevation of arterial (Ya) and Yv, increasing the BOLD effect in a manner non-specific to cerebrovascular reactivity (CVR). (B) Signal changes (ΔS/S0) normalized by change in end-tidal CO2 for the different gas stimuli for healthy volunteers; the hypercarbic normoxic maps have been scaled for maximal contrast and identically to carbogen stimuli maps (Table 1; n=10). (C) The hypercarbic normoxic Δ S/S0/mmHg is smaller than the carbogen ΔS/S0/mmHg as expected, however the two measures correlate tightly (P<0.05) across all brain lobes; colors denote different lobes shown in (B; Masks). Dashed line=line of unity; solid line=best fit line to data. The boxplot in (D) also demonstrate that relative ΔS/S0 between brain regions vary similarly for the two gas stimuli. These data are consistent with carbogen BOLD CVR providing similar information to hypercarbic normoxic BOLD CVR, however with an additional contribution from increased oxygen saturation secondary to hyperoxia.

