

Abstract
The intracellular fluorescence of 6-methoxy-N-(3-sulfopropyl)- quinolinium (SPQ), a Cl−-sensitive fluorescent dye, is quenched by intracellular organic anions and proteins of unknown identity. The concentration of these intracellular quenchers (ICQs), however, is dependent on cell volume. In the absence of Cl−, changes in the observed SPQ fluorescence may therefore reflect changes in cell volume. This concept has been applied to determine relative changes in cell volume of cultured corneal endothelium in response to anisosmotic shocks, using as the Cl− substituent. SPQ fluorescence increased with decreasing osmolarity and vice versa. A 20 mosM hypertonic shock was needed to detect a change in SPQ fluorescence with a signal-to-noise ratio of >25. Assuming dynamic quenching by ICQs, we applied an extension of the Stern-Volmer equation to develop a simple relationship between the measured SPQ fluorescence and relative changes in cell volume. For large hyposmotic shocks, regulatory volume decrease (RVD) was observed. The rate of RVD could be enhanced by exposure to 0.5 μM gramicidin in low-Na+ Ringer solution (i.e., efflux), indicating that K+ conductance is rate limiting for RVD. These results demonstrate the principle of using fluorescence quenching to measure changes in cell volume in real time. Because SPQ is sensitive to Cl−, its usefulness as a quenching probe is limited. However, a structure-activity study can be expected to yield useful Cl−-insensitive analogs.
Keywords: corneal endothelium, 6-methoxy-N-(3-sulfopropyl)quinolinium, volume regulation
Measurement of cell volume, with high temporal resolution and sensitivity, is critical for estimating osmotic water permeability (Pf) (12, 14), investigating mechanisms of cell volume regulation (1, 2, 9, 10, 18, 23), and ascertaining transient changes in cell volume on stimulation of ion transport mechanisms under isosmotic conditions (11,25). Many techniques to measure cell volume have been developed based on light scattering (11, 12, 14), radioisotope equilibration (24), cell height measurement (10), electrophysiological techniques (1), imaging using Nomarski optics (15), fluorescent dye dilution (23), and Coulter counter measurement (9). The method of light scattering is a sensitive technique but remains an empirical approach and needs complementary techniques for corroboration (12). The methods based on radioisotope equilibration are tedious and provide poor temporal resolution (24). The dye dilution technique makes use of confocal imaging [or a high numerical aperture (NA) objective] of individual cells to determine changes in the concentration of a fluorescent volume marker. In confocal imaging, the collection of fluorescence emission is poor, and, as a result, the technique requires the use of high levels of excitation, which can cause phototoxicity and/or photobleaching of the dyes. Cell sizing using the Coulter counter requires that the cells be in suspension (9). The electrophysiological technique, applicable for single cells, is invasive, requiring membrane permeabilization (for loading of an impermeable ion, e.g., tetramethyammonium) and subsequent impalement of microelectrodes (1). Measurement of cell height using confocal microscopy and fluorescent microbeads at the basal and apical sides (10) has been suggested; however, this technique is not useful for measuring rapid changes in cell volume. In an effort to overcome some of these limitations, this study proposes a novel approach to measure relative changes in cell volume of cultured cells, with the use of the principle of collisional quenching of fluorescent dyes, which requires only conventional fluorescence microscopy. The method, applied in this study to cells grown to confluence on glass coverslips, is applicable to cells in suspension and potentially to intact tissues.
A principal requirement of this method is that the fluorescent dye of choice must undergo collisional quenching with an intracellular component entrapped in the cell. The concentration of this intracellular quencher would then vary with changes in cell volume. In the absence of dye leakage, the extent of quenching, measured as changes in the observed fluorescence, would reflect changes in cell volume. As a model for the application of this principle, a well known Cl−-sensitive fluorescent dye, 6-methoxy-N-(3sulfopropyl)quinolinium (SPQ) has been used. In addition to Cl−, the fluorescence of SPQ is significantly quenched by other halides1 and to a small extent by , , and gluconate (20, 26, 28, 29). However, the quenching constant of SPQ for Cl− in Ringer solutions usually exceeds by ~8 times its value measured in intact cells (6, 8, 15, 17, 20, 22, 28-30). This is attributed to competitive quenching by intracellular organic anions and proteins of unknown identity through an apparent collisional mechanism (8). The use of SPQ, while limiting the scope of experiments to those in the absence of Cl−, meets the requirements for monitoring cell volume and provides a first step toward a successful identification or development of related congeners of SPQ with insensitivity to Cl− and potentially higher sensitivity toward intracellular quenchers (ICQs).
In this study, we demonstrate the feasibility of the technique using a confluent monolayer of the corneal endothelium. Changes in cell volume in response to anisosmotic shocks of as little as 7% are easily detected, and insights into a principal mechanism of regulatory volume decrease (RVD) by the corneal endothelium is demonstrated.
MATERIALS AND METHODS
Solutions
Cl -free -free Ringer solution containing (in mM) 145 Na+, 4 K+, 0.6 Mg2+, 1.4 Ca2+, 145 , 1 , 10 N-2-hydroxyethylpiperazine-N′-2-ethanesulfonic acid (HEPES), 3.5 gluconate, and 5 glucose was equilibrated with air and adjusted to pH 7.50. Low-Na+ Ringer solution was obtained by equimolar replacement of Na+ by N-methyl- d-glucamine (NMDG- ), which was prepared by equimolar mixtures of NMDG base and HN03. Osmolarity was measured using a vapor pressure osmometer (model 5500; Wescor, Logan, UT), and isosmotic solutions were adjusted to 295 ± 5 mosM with sucrose. Hyposmotic solutions were made by diluting the normal Ringer solution with water, and hyperosmotic solutions were prepared by addition of sucrose.
SPQ loading
Monolayers of cultured bovine corneal endothelium were grown to confluence on glass coverslips as described previously (5). SPQ was loaded into the cells using a hyposmotic shock protocol (5) but with some modifications. The coverslips were rinsed in Cl−-free Ringer for 10 min and were then transferred to a hyposmotic Ringer (40% dilution of Cl−-free Ringer with deionized water) containing 20 mM SPQ. After 5-6 min of loading, the coverslip was transferred to isosmotic Cl−-free Ringer also containing 20 mM SPQ for 30–40 min at 37°C. The coverslip was then washed for 5 min with Cl−-free Ringer and mounted onto the microscope perfusion chamber.
Perfusions system
A perfusion system for fluorescence measurement with an inverted microscope was used. The coverslip, with the monolayer of cells loaded with SPQ, forms the bottom of an aluminum perfusion channel (vol = 80 μl), the top of which is formed by another coverslip. Ringer solutions were filled in hanging syringes placed in a thermostat chamber at 37°C, and the flow (4–6 vol/min) was achieved by gravity through PE-50 tubing.
Measurement of fluorescence quenching
Excitation of SPQ was obtained from a xenon lamp (75 W, Nikon) filtered at 365 ± 10 nm and reflected to the microscope objective (×40, 1.3 NA Nikon or ×63 Neoflaur; 1.25 NA Zeiss) by a dichroic mirror centered at 400 nm (Chroma Technologies, Brattleboro, VT). Neutral density filters (2.5–3.5 OD) were included in the excitation path to minimize photobleaching. Cell fluorescence was collected by the objective, passed through the dichroic mirror to a 420-nm long-pass filter, and directed either to a photomultiplier (HC-125-02; Hamamatsu, Bridge-water, NJ) or an intensified charge-coupled device (ICCD; model C2400, 8 bits/pixel, 540 × 480 resolution; Hamamatsu Photonics). Photomultiplier output was amplified (SR630; Stanford Research Systems, Sunnyvale, CA) and sampled at 1 Hz. The camera images were acquired at 4- to 8-s intervals using a frame grabber (Image-LC; Matrox Electronics Systems, Dorval, Quebec City, Canada) and averaged over eight frames. To minimize photobleaching, excitation was synchronous with sampling with the use of shutter assembly (Lambda-10; Sutter Instruments, Novato, CA). The camera images were analyzed in real time for average pixel intensities encompassing a set of regions of interest (ROIs) using Meta-Fluor Imaging software (Universal Imaging Systems, Chester, PA). These ROIs, selected manually with a maximum of ~20/field, framed single cell boundaries with the ×63 objective; however, one to three cells were enclosed per ROI with the ×40 objective. The change in the average intensity for a given ROI did not alter when images blurred on swelling, particularly with the ×40 objective. Thus the objectives integrated the total depth of the cells (~4–5 βm). The background due to autofluorescence was determined using SCN- (~150 mM), which is known to completely quench SPQ fluorescence (5,29).
Measurement of cytosolic Na+ concentration
Cytosolic Na+ concentration ([Na+]i) was measured with Na+-binding benzofuran isophthalate (SBFI) as described previously (5). SBFI- loaded cells were alternately exposed to 340 ± 11 and 380 ± 13 nm with the use of interference filters (Omega Optical, Brattleboro, VT) through a 400-nm dichroic mirror and an ultraviolet objective (×40, 1.3 NA, Nikon). Emitted light was passed through a barrier filter (450-nm long-pass filter; Omega Optical) and directed to a photomultiplier tube (RFIQL-30F; Thorn EMI, Fairfield, NJ) equipped with a photoncounting unit.
Chemicals
SPQ and the acetoxymethyl ester of SBFI (SBFI-AM) were obtained from Calbiochem (San Diego, CA) and Molecular Probes (Eugene, OR), respectively. Cell culture supplies were obtained from GIBCO BRL (Grand Island, NY). All other chemicals were obtained from Sigma (St. Louis, MO). Stock solutions of SBFI-AM (10 mM) and gramicidin D (10 mM) in dimethyl sulfoxide were stored desiccated at −20°C.
RESULTS
Fluorescence response to anisosmotic shocks
Figure 1A shows a typical SPQ fluorescence response to a 33% hyposmotic shock in the absence of Cl−. Immediately after the shock (at point A), there is a rapid increase in fluorescence by 48 gray levels (to point B) associated with the instantaneous increase in cell volume. The increased fluorescence is due to dilution of ICQs. Subsequently, there is a slow fluorescence decrease by 22 gray levels (to point C), which represents a combination of cell volume decrease due to RVD and dye leakage from the cells. At point C, the cells are returned to isosmotic Ringer, leading to an immediate decrease in fluorescence by 41 gray levels (to point D). Given that the magnitude of the shock at point C is equal but opposite in sign to that at point A, the initial peak change should be the same (i.e., δFH = δFI; see legend for Fig. 1) if there is no dye loss from the cells during the interval (i.e., between points B and C). However, the fluorescence change between points C and D is seven gray levels less than that between points A and B, indicating dye leakage. When this dye leakage is assumed to occur exponentially with time (shown as the line segment B−E), the “corrected RVD” profile is obtained (line segment B−C*). The actual regulatory volume loss then corresponds to an equivalent of 15 gray levels (δFR).
Fig. 1.
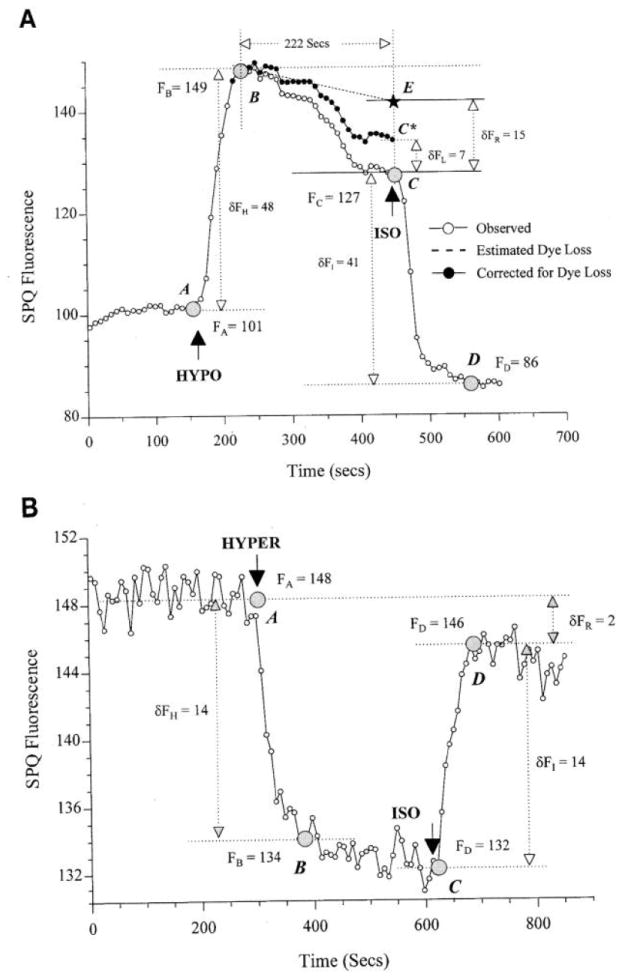
Typical 6-methoxy-N-(3-sulfopropyl)quinolinium (SPQ) fluorescence profile when anisosmotic shocks occur. Confluent layer of endothelial cells was perfused with Cl−-free Ringer solution. After initial osmotic equilibrium (i.e., the transitions A to B) and subsequent volume regulation were recorded, cells were returned to isosmotic Ringer at point C. FA, FB, FC, and FD are the average pixel intensities (in gray levels) at points A, B, C, and D. δFH = FB – FA and δFI = FC – FD represent peak changes in SPQ fluorescence due to immediate volume changes by osmotic equilibrium after exposure to anisosmotic shocks (at point A) and return to isosmotic conditions (at point C), respectively. A: at point A, perfusate was switched to a 33% hyposmotic solution. δFR = FB – FC* = −15 and δFL = FC – FC* = −7 represent changes in SPQ fluorescence due to volume loss by regulatory volume decrease (RVD; also shown as line segment B–C*) and an estimated dye loss, respectively. Hypo, hyposmotic; Iso, isosmotic. B: at point A, perfusate was switched to a 20% hyperosmotic Ringer (Hyper). There is no observable regulatory volume increase (δFR = FB – FC = 0). Dye loss is relatively small compared with swollen conditions δFL = FA – FD = 2). Note that 1) under isosmotic conditions (Iso), all regions of interest (ROIs) showed different levels of steady-state fluorescence, indicating heterogeneity in dye loading among the cells (data not shown); 2) in response to hypotonic shock, both the rate and extent of fluorescence decreased when RVD was heterogeneous. Therefore, all calculations for determination of dye leakage and RVD should be performed for each ROI separately; 3) profiles in A and B represent typical ROIs from among some 20 ROIs selected in each of the experiments. Results are also typical of >20 experiments on separate coverslips.
The dye loss determined above corresponds to a loss rate of 105%/h. From previous studies, it is known that SPQ leaks from the corneal endothelium at a rate of ~15%/h under isosmotic conditions (5), and, as expected, the observed leakage under swollen conditions is sevenfold higher.
To show that the fluorescence decrease is associated with volume loss (i.e., shrinkage), the cells were exposed to hyperosmotic shocks. A typical response to a hyperosmotic shock is shown in Fig. 1B. There is an immediate decrease in SPQ fluorescence by 14 gray levels as measured from points A to B, a transition that must be associated with immediate cell shrinkage. On returning to isosmotic conditions (at point C), there is an increase in SPQ fluorescence, also by 14 gray levels. This indicates that, during this short exposure to hyperosmotic perfusate, dye leakage is relatively small compared with the loss under swollen conditions.
Relationship between SPQ fluorescence response and cell volume
The quenching of SPQ fluorescence by Cl− follows the Stern-Volmer equation (8, 29) given by
| (1) |
where F is the observed SPQ fluoresence, F0 is the fluorescence when Cl− concentration ([Cl−]) = 0 and KCl, is the quenching constant for Cl−. The factor F0 is dependent on the mass of the dye, quantum yield of the dye, excitation intensity, and the efficiency of fluorescence collection. When modeling SPQ fluorescence during intracellular Cl− measurements, quenching by the ICQs should be considered. With the assumption that the quenching by ICQs follows a collisional mechanism and, in addition, is independent of collisions between SPQ and Cl−, Eq. 1 can be extended to multiple quenchers, assuming an additive principle (8, 28-30). Thus
| (2) |
where F0 is now the fluorescence when intracellular [Cl−] ([Cl−]i) = 0 and Cp = 0, Cp represents an apparent concentration factor representing the ICQs, and Kp is an apparent quenching constant for the ICQs. The heterogeneity among ICQs is neglected and lumped to constitute a single quencher, which is denoted by subscript “P.” In the absence of Cl−, Eq. 2 in terms of cell volume is
| (3) |
where V is the cell volume, MP is the mass of ICQs, and b is the cell volume that is not osmotically active water (16). Because the ICQs are entrapped in the cell, Mp is a constant. Thus Eq. 3 provides a direct relationship between the observed SPQ fluorescence (F) and cell volume (V) in the absence of Cl−, with the condition that ICQs are entrapped. Further, Eq. 3 can also be written in terms of osmolarity, invoking a modification of the Boyle-van’t Hoff equation (16)
| (4) |
This equation implies that if VI and πI represent cell volume and osmotic pressure under isosmotic conditions (as a convenient reference), then V would be the cell volume at any arbitrary value of osmotic pressure π. Solving for (V – b) in Eq. 4 and its substitution into Eq. 3 yields
| (5) |
where
where is the apparent concentration of ICQs at V = VI Figure lA shows an increase in the observed SPQ fluorescence (F) on cell swelling [i.e., (πlπI) < 11] in qualitative agreement with Eq. 5. Similarly, Fig. 1B shows a decrease in the observed SPQ fluorescence, consistent with imposed cell shrinkage [i.e., (π/πI) > 1]. To validate Eq. 5 over a wide range of osmolarity, the cells were subjected to a short sequence of shocks of increasing tonicity. Hyperosmotic shocks were used in an attempt to reduce dye leakage. In addition, Cl− was substituted with gluconate instead of to minimize changes in cell volume due to regulatory volume increase (RVI), which is often facilitated in the presence of permeable anions such as (18). Figure 2A shows a stepwise decrease in SPQ fluorescence after each of the hyperosmotic shocks. From these responses, we can develop a useful form of Eq. 5. Under isosmotic conditions [i.e., (π/πI) = 1], Eq. 5 reduces to
| (6) |
where FI is the fluorescence under isosmotic conditions. Now, dividing Eq. 5 by Eq. 6, we get
| (7) |
Where FI/F is the ratio of isosmotic fluorescence to anisosmotic fluorescence. Based on our previous studies on corneal endothelium, we estimate2 γ to be ~8. Further, we note that, for small hyposmotic shocks [i.e., (πlπI) ≈ 1] or large hyperosmotic shocks [i.e., (πlπI) > 1], we can assume (l/γ ≈ = 0 and [(γ – 1)/γ] ≈ 1, so that Eq. 7 simplifies to
| (8) |
Equation 8 is a considerable simplification compared with Eqs. 5 or 7. However, both Eqs. 7 and 6 have to be corrected for background, which is important for intracellular measurements (5). If FB is the background signal, then Eqs. 7 and 8 can be rewritten
| (9) |
| (10) |
Fig. 2.
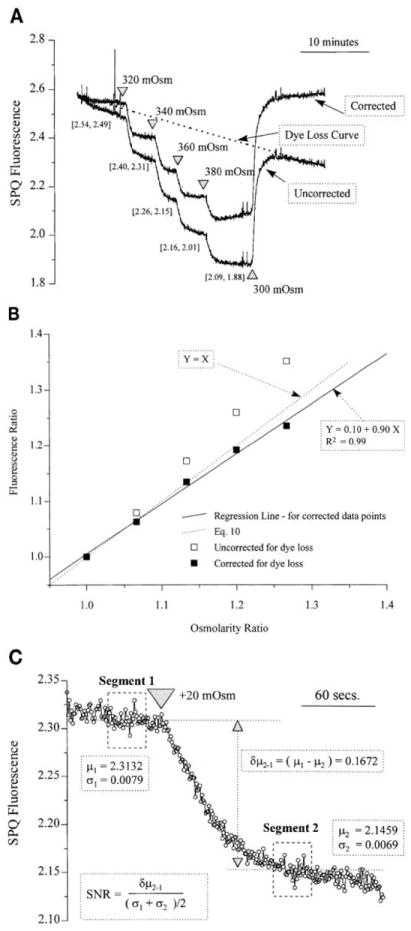
Relationship between SPQ fluorescence and osmolarity. A: confluent monolayer of endothelial cells was perfused with Cl−-free gluconate Ringer and then exposed to successive 20 mosM hyperosmotic shocks. Dye leakage curve (dotted line) was calculated assuming an exponential loss. Bracketed number pairs represent values of SPQ fluorescence at each point with and without correction for dye leakage. B: validation of Eqs. 9 and 10 are shown by a plot of [(F – FB)/(FI – FB)] vs. (π/πI). □, Uncorrected ratios; ■, ratios corrected for dye leakage. All data points are corrected for background. Solid regression line represents a regression curve after correction for dye leakage. Dotted straight line represents Eq. 10. C: segment of response from A is shown with calculation of signal-to-noise ratio (SNR). Results shown are typical of 3 experiments on separate coverslips; 5 experiments with just 2 osmotic shocks on either side of the isosmotic point showed qualitatively similar results.
The background level detected using the photomultiplier system was found to be 33 ± 21% (range l0–91%; n = 16) of the maximum SPQ fluorescence signal (i.e., in the absence of Cl−). These backgrounds are significant and therefore have to be subtracted from the measured fluorescence.
Figure 2B)] shows of plot of fluorescene ratio [(FI–FB)/(F–FB)] against osmolarity ratio (π/πI). The correlation is linear, consistent with Eqs. 9 and 10 over an ~100 mosM hyperosmotic range. From plots similar to Fig. 2B, the actual values of the slope and intercept can be used to estimate γ independently according to Eq. 9. From the slope and intercept of the regression line in Fig. 2B for the data obtained after correction for dye loss, a value of γ close to 8 is found. Additionally, we note that, for small hyperosmotic shocks, Eqs. 9 and 10 are identical, suggesting that, for small shocks, knowledge of Kp (or the value of γ) is not essential to obtain a quick estimate of the volume change.
Sensitivity of the method
For comparison with other can express the sensitivity of the method in terms of signal-to-noise ratio (SNR). Figure 2C shows a small segment of the response from Fig. 2A. The noise level (σ) can be calculated as the average of standard deviations of the signal acquired over a short time period before and after the hyperosmotic shock under steady-state conditions [i.e., σS, = (σ1 + σ2)/2]. The magnitude of the change in the signal (δμs,) is the difference in the mean levels of fluorescence before (μ1) and after the shock (μ2). The SNR (=δμs/σs) is then 24 for this response, which is acceptable for many physiological experiments.
Effect of ouabain on cell volume under isosmotic conditions
To examine the specificity of the SPQ response to volume changes, we exposed the cells to ouabain in both the presence and absence of gramicidin. Figure 3A shows that ouabain (200 μM) leads to a continuous increase in SPQ fluorescence, which is slightly accelerated by the addition of gramicidin (1 μM). However, gramicidin (0.5–2 μM) addition in the absence of ouabain does not lead to any noticeable increase in the SPQ fluorescence (data not shown), suggesting that gramicidin leads to net Na+ entry only in the absence of Na+-K+-ATPase activity. This has been verified by measuring [Na+]i (Fig. 3B). Similar to the increase in SPQ fluorescence, [Na+]i increases on addition of ouabain, and the rate of increase is enhanced by the addition of gramicidin. These results are consistent with the accelerated SPQ fluorescence shown in Fig. 3A.
Fig. 3.
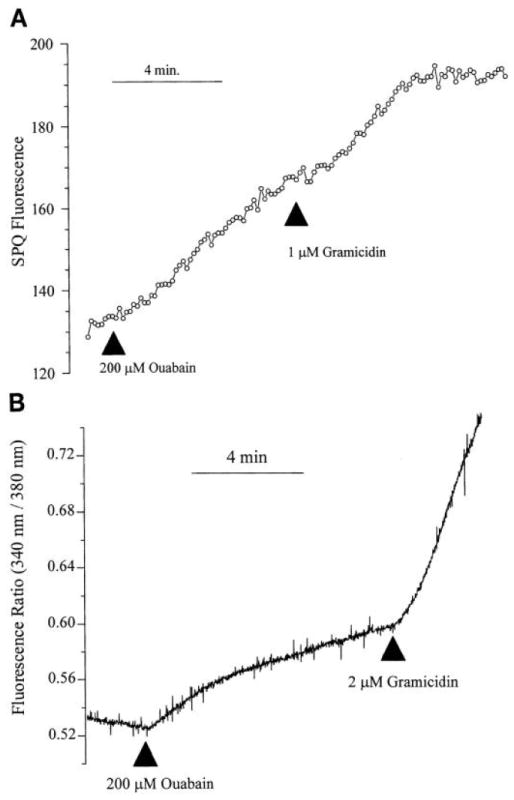
Influence of ouabain SPQ fluorescence and cytosolic Na+ ([Na+]i) under isosmotic conditions. Cells, being perfused with Cl−- free Ringer, were exposed to 200 μM ouabain and 1 μM gramicidin where indicated under isosmotic conditions. A: typical SPQ fluorescence response obtained in at least 5 experiments on separate coverslips at varying levels of ouabain (100-200 μM). B: relative changes in Na+-binding benzofuran isophthalate fluorescence ratio (340/380 nm). Increase in fluorescence ratio is indicative of an increase in [Na+]i. Results shown are typical of at least 7 experiments on separate coverslips conducted at varying levels of gramicidin (0.5–2 μM).
Effect of urea on cell volume under isosmotic conditions
In many epithelia and red blood cells, urea is known to permeate the plasma membrane, leading to cell swelling under isosmotic conditions (1). An attempt was made to induce this phenomenon to compare the SPQ response to cell swelling by a hyposmotic shock with that by urea (Fig. 4). The hyposmotic response (33% shock, equivalent to 100 mosM load) was first obtained, and, subsequently, the same cells were exposed to 120 mM urea under isosmotic conditions. The urea response is slow (dependent on the urea permeability), but the extent of the response is equivalent to the peak of the hyposmotic response, consistent with the expected swelling due to urea.
Fig. 4.
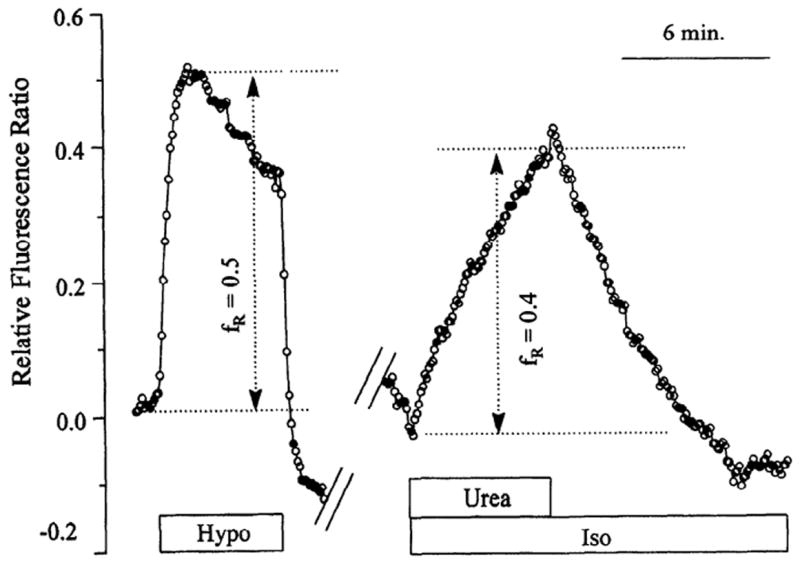
Influence of urea on SPQ fluorescence under isosmotic conditions. Cells were perfused with Cl− free Ringer. Cells were exposed to a 33% hyposmotic shock (i.e., equivalent to 100 mosM shock) and returned to isosmotic conditions after ~5 min. After another ~10 min, cells were exposed to 120 mM urea under isosmotic conditions. Y-axis shows relative change in SPQ fluorescence given by (FI – F)/FI, where FI is SPQ fluorescence under isosmotic conditions. This ratio is equal to the relative change in cell volume given by (VI – V)/VI, where VI is cell volume under isosmotic conditions. This follows from Eq. 8. Results shown are typical of at least 2 experiments on separate coverslips.
Influence of gramicidin on RVD
In many epithelia, RVD is brought about by KCl efflux due to K+ and Cl− loss through conductive pathways, and, in some cases, the rate of RVD is limited by the conductance of K+ channels (2, 18). Figure 5A shows an SPQ fluorescence response to a hyposmotic shock in the presence of normal levels of Na+ in the Ringer solution. The addition of gramicidin led to a further increase in SPQ fluorescence, implying a cell volume increase, presumably due to influx of Na+ and . This was confirmed by measurements of [Na+]i (Fig. 5B). There is a rapid decrease in [Na+]i on the shock that can be attributed to dilution because of rapid water movement. When the hyposmotic shock is repeated and the cells are exposed to gramicidin within 2 min of the shock, a rapid increase in Na+ entry occurs.
Fig 5.
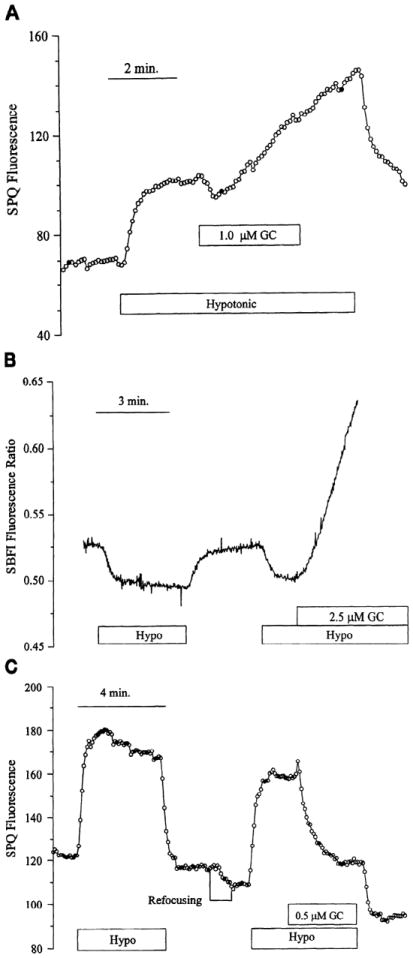
Influence of gramicidine (GC) during RVD. Confluent layer of endothelial cells was perfused with Cl− free Ringer. A: SPQ fluorescence after a 33% hyposmotic shock and exposure to gramicidin in presence of Na+. B: [Na+]i levels after a 33% hyposmotic shock in presence of Na +. SBFI, Na+-binding benzofuran isophthalate. C: SPQ fluorescence after a 33% hyposmotic shock in presence of 4 mM Na+. Results shown are typical of at least 6 experiments on separate cover slips.
To limit the influx of Na+ on exposure to gramicidin and to enhance KNO3 efflux, experiments were conducted in the presence of low extracellular Na+ (4 mM). It was expected that the enhanced conductance for K+ (due to gramicidin) in the presence of volume-activated anion channels could lead to accelerated RVD. Figure 5C shows that, at the point of addition of gramicidin ~2 min after the hyposmotic shock, there is a rapid decrease in SPQ fluorescence, indicating volume loss.
DISCUSSION
This study demonstrates the application of the principle of dynamic fluorescence quenching to measure changes in cell volume with the use of confluent corneal endothelial cells. We have measured changes in cell volume to anisosmotic loads as small as 20 mosM with an SNR of ~25. The technique can also easily detect slow volume changes characteristic of isosmotic modulation and RVD. Although SPQ demonstrates the principle, its halide sensitivity limits its general usefulness. A few trials with N-( 3-sulfopropyl)acridinium (Molecular Probes), an analog of SPQ without Cl− sensitivity, showed rapid dye leakage and, therefore, could not be used further (data not shown).
Advantages of the quenching method
Unlike the approach based on the principle of dye dilution (23), the quenching technique does not require the measurement of dye concentration in a cell; rather, it requires an integrated response from the whole volume of a cell. Thus neither a high NA objective nor a confocal microscope is required. In this study, we used a conventional quantitative fluorescence microscope equipped with a ×40 objective; however, the results also could have been obtained with a cuvette-based fluorometer. Because the method is based on collisional quenching, the frequency content of the actual volume-sensitive fluorescence response is limited only by the diffusion velocity of the probe (i.e., SPQ). This is reported to be of the order of milliseconds for SPQ (29). Thus this technique could be applied to estimate osmotic water permeability. In this study, using integration times of ~50 ms with a photomultiplier tube and ~250 ms with an ICCD, we achieved sufficiently high temporal sensitivity as demonstrated by the biphasic response that is expected when a hyposmotic shock occurs (Fig. 1).
Choice of SPQ as the fluorescent probe
The method requires a fluorescent dye and a corresponding quencher, both of which must be entrapped in the cells. Our adherence specifically to SPQ was motivated by the following: 1) a variety of cell types [epithelial (5, 6, 17, 29, 30), smooth muscle cells (20), fibroblasts (8), acinar cells (15)] shows quenching of SPQ by ICQs in addition to halides; 2) the loading procedures for SPQ are well established (5, 6, 8, 29, 30); 3) SPQ is not toxic to a variety of cell types (5, 8, 29); 4) SPQ does not sequester into any cytoplasmic compartments (5, 29); 5) structure-sensitivity relationships are known for the synthesis of analogs of SPQ with decreased sensitivity toward Cl− (3, 4, 29); 6) the SPQ response during [Cl−]i measurements could be sensitive to cell volume when [Cl−]i assumes low values (15, 17, 30); and 7) other [Cl−]i-sensitive dyes [e.g., N-(ethoxycarbonylmethyl)-6- methoxy-quinolinium bromide (MQAE)] have quenching constants that are also reduced to similar extents when measured in intact cells (6, 20), presumably through a similar quenching mechanism, and they would have been suitable as well.
The changes in the extent of fluorescence quenching are related to changes in cell volume through the Stern-Volmer model for dynamic quenching (Eqs. l–10). The collisional quenching is evident from studies on 3T3 fibroblasts by Chao et al. (8), in which fluorescence lifetimes of SPQ were measured. In the absence of Cl−, the lifetime of SPQ in the cells was reduced by sevenfold in comparison with its value in aqueous solutions. This decrease is not due to compartmentation of SPQ into the cells, because SPQ loaded in the membrane vesicles or liposomes did not show any reduction (8). Because the phenomenon of dynamic fluorescence quenching can be measured in terms of fluorescence lifetime (21), cell volume changes can be related to fluorescence lifetimes. The principal advantage of lifetime measurements would be the independence of dye concentration so that leakage effects are avoided.
The derivation leading to Eqs. 9 and 10 assumes that the ICQs are entrapped in the cells. This is consistent with the observation that there is no increase in fluorescence under isosmotic conditions when the cells are continuously perfused with Cl−-free Ringer solution. Any substantial loss of ICQs would lead to a significant increase in SPQ fluorescence. An additional assumption in the derivation is that the [Cl ]i is reduced to zero before the volume experiments are begun. The removal of [Cl−i is assured by exposure to Cl−-free conditions for at least 1 h at 37°C before the experiments. This time is sufficient, since acute removal of Cl− from these cells leads to a new steady state of SPQ fluorescence within 15 min (5). Furthermore, uptake experiments with 36C1− show that an equilibrium with extracellular 36C1− could be achieved within 15 min (data not shown).
The choice of SPQ, however, necessitates the absence of halides. The replacement of Cl− by limits the scope of the studies to mechanisms of volume regulation not invoking the activity of the K+-Cl− or Na+-K+-2Cl− cotransporters, for which is not a substrate. These participate during RVD and RVI, respectively (18). However, has a substantial permeability through a variety of Cl channels, including swelling-activated Cl− channels (13), and enables the examination of RVD through K+ and Cl− conductance (Fig. 5).
Significance of intracellular viscosity
For a given cell volume, the probability of a collisional quenching is determined by the mobilities of SPQ and those of the quenchers (i.e., ICQs) (21). These mobilities are directly proportional to the respective diffusion coefficients and, therefore, should be inversely proportional to cytoplasmic viscosity (21). If viscosity is a major factor in determining the SPQ fluorescence response, the quenching constants will be higher, since a potential decrease in cytoplasmic viscosity can be expected during swollen conditions (19). This suggests a decrease in SPQ fluorescence response on cell swelling, but all the experimental observations3 in this study and others (15, 30) show an increase in SPQ fluorescence with a decrease in extracellular osmolarity. Another study conducted with A6 cells using MQAE, an analog of SPQ, also showed a swift increase in MQAE fluorescence in response to hyposmotic shocks, suggesting an involvement of ICQs (6). These results, taken together, suggest that either the effects of changes in cytoplasmic viscosity are negligible or the changes in viscosity are small.
Influence of dye leakage
An apparent problem with SPQ that confounds characterization of volume regulation is its leakage from cells. We noted a 105%/h leakage rate under swollen conditions compared with ~15%/h under isosmotic conditions (5). However, an approach to compensate for leakage was suggested to achieve a quantitative assessment of the fluorescence response. In Fig. lA, we assume that the peak changes in fluorescence response must be equal at points A and C, at which the cells are subjected to exactly the same magnitude of osmotic shock. Therefore, the extent of volume change during points A to B and C to D must be the same. However, for the assumed equality δFH = δFI to be valid, the dye loss during the approach to osmotic equilibrium (points A to B and C to D), as well as diffusional loss during the time allowed for RVD (i.e., points B to C), must be negligible. Because the rate of approach to osmotic water equilibrium is very fast (time constant < 1 s) (12, 14), the dye loss during the transition from points A to B is negligible. Dye loss during the transition from points C to D can be expected to be affected by solvent drag as a consequence of osmotic water efflux. When the time allowed for RVD was small (line segment B–C), estimated dye loss also decreased, indicating that most of the dye loss is by diffusion during RVD (i.e., between B and C).
The dye leakage can be decreased by conjugating SPQ analogs to polymeric dextrans; such procedures exist for many dyes prone to leakage, including SPQ (5). Leakage is not a problem for Pf determination, since the measurements are required for only a few seconds (12, 14).
On the identity and distribution of ICQs
The homogeneous distribution of cellular SPQ fluorescence suggests that the ICQs must be distributed uniformly within a cell. Because the known intracellular cations and anions under Cl–-free conditions [i.e., ≤ 200 mM] do not quench SPQ fluorescence, the high value of γ suggests a high value for Kp according to Eq. 6, because total osmolarity of ICQs cannot exceed ~100 mosM. When an ICQ concentration of ~100 mM and γ = 8 is assumed, we get a value of 70 M−l for Kp with the use of Eq. 6. This is within the range of quenching constants determined for a variety of anions (20, 22, 26, 28, 29). It is unlikely that the total concentration of ICQs is significantly smaller. For example, when the concentration of an ICQ is ~10 mM, then Kp is ~700 M−l. This large value has not been reported to date for any of the known quenchers of SPQ fluorescence (26, 28, 29). These arguments suggest that there is a collection of ICQs that are responsible for the observed decrease in the Cl− sensitivity. Many pH buffers (e.g., HEPES, used in the study at a concentration of 10 mM) are known to quench the SPQ fluorescence strongly, particularly in their zwitterionic forms (22, 26, 28). However, the different forms of HEPES are not known to permeate the plasma membrane (7). In addition, the maximum quenching constant reported for HEPES is 50 M−l (26, 28), and this low value cannot explain the observed 8- to 10-fold decrease in the intracellular quenching constant for Cl−. Therefore, it is highly unlikely that HEPES contributes toward intracellular quenching; this conclusion is consistent with the general observation that the SPQ fluorescence is insensitive to changes in intracellular pH (pHi). In this context, we also note that, when the endothelial cells were being perfused with Ringer solution free of a hyposmotic shock (20%) caused an acidification of ~0.08 units, but the changes were slow, taking ~8 min to reach a steady value (data not shown). When hyperosmotic shocks (also of 20%) were imposed, the cells alkalinized by 0.1 pH units slowly, taking again ~8 min, to reach a steady state (data not shown). These small and slow changes in pHi cannot be reconciled with the large and fast changes (within 30–40 s) that occur (Figs. 1, 2, and 5) in SPQ fluorescence subsequent to anisosmotic shocks. Therefore, we conclude that the immediate changes in SPQ fluorescence, devoid of volume regulation, are due to changes in the concentration of ICQs alone. In addition, when we induced predictable changes in pHi, no aberrant effect on SPQ response to volume changes was noticeable. Thus, when the cells under Cl−-free (substituted with ) HCO3 -free conditions were exposed to , there was an increase in SPQ fluorescence (data not shown). This maneuver increases pHi significantly (~0.2 units) because of the cotransport mechanism in the endothelium (5). Thus alkalinization in the presence of simultaneous cell swelling showed an increase in SPQ fluorescence. However, when cells swell under Cl–-free -free conditions in response to hyposmotic shock, usually there is a slight pH decrease (data not shown). Therefore, SPQ fluorescence is not altered significantly by the effect of changes in pHi on the ICQs. However, the ramifications of slow pHi changes on the apparent quenching constant of the ICQs cannot be neglected and will have to be examined in a separate study.
Isosmotic volume changes
Exposure to ouabain and urea is known to cause swelling in many cells (1). This knowledge is used in Figs. 3 and 4 to induce slow and directed volume changes to validate the principle of dynamic quenching. In the case of ouabain, a net Na+ influx leads to swelling in the endothelium (Fig. 3B; see also Ref. 31). The technique of volume measurement is therefore confirmed by a direct measurement of the osmolyte responsible for cell swelling. The swelling response to urea (Fig. 4; 120 mM in isosmotic Ringer) is slow relative to an anisomotic shock. On equilibrium, the extent of the SPQ fluorescence response is equivalent to a 33% hyposmotic shock. The results in Figs. 3 and 4, therefore, show specificity of the SPQ fluorescence response to changes in cell volume obtained by distinctly different methods.
RVD in corneal endothelium
A principal mechanism for RVD observed in many epithelia entails the efflux of K+ and Cl– through conductive pathways (1, 2, 18). The conductive loss of K+ requires complementary anion channel activity to facilitate Cl– loss required to ensure intracellular electroneutrality (1, 2, 18). Because is known to have high permeability through swelling-activated Cl− channels, our method is applicable to studying RVD mechanisms. Exposure to gramicidin under resting conditions does not cause noticeable cell swelling (data not shown); this is consistent with the notion that corneal endothelium does not have a very high resting anion channel activity (27, 31). However, exposure to gramicidin under hyposmotic conditions (Fig. 5A) shows an accelerated increase in cell swelling due to a net influx of [Na+]i (Fig. 5B). Low Na+ (~4 mM) abolishes this gramicidin-induced swelling and leads to an accelerated RVD. These results indicate that K+ channel conductance may be limiting under hyposmotic conditions.
Acknowledgments
We thank Ward M. Peterson for many productive discussions. Heidi Hill provided excellent editorial assistance in the preparation of the manuscript. We also thank Yusei Miyamoto for experiments with radioisotopes and Dan Harvitt for a critical reading of the manuscript.
This work was supported by National Eye Institute Grants EY-11107 (to S. P. Srinivas) and EY-08834 (to J. A. Bonanno).
Footnotes
Portions of this work have been presented in abstract form at the Annual Meeting of the Salt and Water Club in Morro Bay, CA, in March 1996.
Quenching constants: K [Cl−] = 118 M−1; K [Br−] = 180 M−1; K [I−] = 240 M−1; = 8 M−1; K [gluconate] = 12 M−l; = 0.5 M−1 measured in Ringer solution (29).
Dividing Eq. 2 on both sides by (1 + KPCP), we get , which is analogous to Eq. 1, but ; this new equation can also be fitted with experimental data for SPQ fluorescence quenching by [Cl−]i (5, 6, 8, 17, 20, 22, 29, 30). In a previous study, we reported to be 14.7 ± 0.9 M−l for the corneal endothelium (5) and others have reported 12–20 M−l in other cell types (5, 6, 8, 17, 20, 22, 29, 30). Under isosmotic conditions (i.e., ) we get , from which a value of 8 can be calculated for γ.
An exception to this observation is reported with fibroblasts, in which hypotonic shocks in the presence of , as the Cl− substituent do not appear to have caused any change in SPQ fluorescence (13).
References
- 1.Adorante JS. Regulatory volume decrease in frog retinal pigment epithelium. Am J Physiol. 268 doi: 10.1152/ajpcell.1995.268.1.C89. [DOI] [PubMed] [Google Scholar]; Cell Physiol. 1995;37:C89–C100. [Google Scholar]
- 2.Adorante JS, Cala PM. Mechanisms of regulatory volume decrease in nonpigmented human ciliary epithelial cells. Am J Physiol. 268 doi: 10.1152/ajpcell.1995.268.3.C721. [DOI] [PubMed] [Google Scholar]; Cell Physiol. 1995;37:C721–C731. [Google Scholar]
- 3.Biwersi J, Farah N, Wang Y-X, Ketcham R, Verkman AS. Synthesis of cell-impermeable Cl-sensitive fluorescent indicators with improved sensitivity and optical properties. Am J Physiol. 262 doi: 10.1152/ajpcell.1992.262.1.C243. [DOI] [PubMed] [Google Scholar]; Cell Physiol. 1992;31:C243–C250. [Google Scholar]
- 4.Biwersi J, Tulk B, Verkman AS. Long-wavelength chloride-sensitive fluorescent indicators. Anal Biochem. 1994;219:139–143. doi: 10.1006/abio.1994.1242. [DOI] [PubMed] [Google Scholar]
- 5.Bonanno JA, Srinivas SP, Brown M. Effect of acetazolamide on intracellular pH and bicarbonate transport in bovine corneal endothelium. Exp Eye Res. 1995;60:425–434. doi: 10.1016/s0014-4835(05)80099-5. [DOI] [PubMed] [Google Scholar]
- 6.Brochiero E, Banderali U, Lindenthal S, Raschi C, Ehrenfeld J. Basolateral membrane chloride permeability of A6 cells: implication in cell volume regulation. Pflügers Arch. 1995;431:32–45. doi: 10.1007/BF00374375. [DOI] [PubMed] [Google Scholar]
- 7.Case RM, Conigrave AD, Favaloro EJ, Novak I, Thompson CH, Young JA. The role of buffer anions and protons in secretion by the rabbit mandibular salivary gland. J Physiol (Lond) 1982;322:273–286. doi: 10.1113/jphysiol.1982.sp014037. [DOI] [PMC free article] [PubMed] [Google Scholar]
- 8.Chao AC, Dix JA, Sellers MC, Verkman AS. Fluorescence measurement of chloride transport in monolayer cultured cells. Mechanisms of chloride transport in fibroblasts. Biophys J. 1989;56:1071–1081. doi: 10.1016/S0006-3495(89)82755-9. [DOI] [PMC free article] [PubMed] [Google Scholar]
- 9.Civan MM, Peterson-Yantorno K, Coca-Prados M, Yantorno RE. Regulatory volume decrease by cultured nonpigmented ciliary epithelial cells. Exp Eye Res. 1992;54:181–191. doi: 10.1016/s0014-4835(05)80207-6. [DOI] [PubMed] [Google Scholar]
- 10.Crowe WE, Wills NK. A simple method for monitoring changes in cell height using fluorescent microbeads and an Ussing-type chamber for the inverted microscope. Pflügers Arch. 1991;419:349–357. doi: 10.1007/BF00371117. [DOI] [PubMed] [Google Scholar]
- 11.Dho S, Chou S, Chang XB, Rommens JM, Foskett JK. Right-angle light scattering to assay basal and regulated plasma membrane Cl conductances. Am J Physiol. 263 doi: 10.1152/ajpcell.1992.263.2.C530. [DOI] [PubMed] [Google Scholar]; Cell Physiol. 1992;31:C530–C534. [Google Scholar]
- 12.Echevarria M, Verkman AS. Optical measurement of osmotic water transport in cultured cells. Role of glucose transporters. J Gen Physiol. 1992;99:573–589. doi: 10.1085/jgp.99.4.573. [DOI] [PMC free article] [PubMed] [Google Scholar]
- 13.Ehring GR, Osipchuk YV, Cahalan MD. Swelling- activated chloride channels in multidrug-sensitive and -resistant cells. J Gen Physiol. 1994;104:1129–1161. doi: 10.1085/jgp.104.6.1129. [DOI] [PMC free article] [PubMed] [Google Scholar]
- 14.Fischbarg J, Li J, Kuang K, Echevarria M, Iserovich P. Determination of volume and water permeability of plated cells from measurements of light scattering. Am J Physiol. 265 doi: 10.1152/ajpcell.1993.265.5.C1412. [DOI] [PubMed] [Google Scholar]; Cell Physiol. 1993;34:C1412–C1423. [Google Scholar]
- 15.Foskett JK. [Ca2+]i modulation of Cl− content controls cell volume in single salivary acinar cells during fluid secretion. Am J Physiol. 259 doi: 10.1152/ajpcell.1990.259.6.C998. [DOI] [PubMed] [Google Scholar]; Cell Physiol. 1990;28:C998–C1004. [Google Scholar]
- 16.Hallows KR, Knauf PA. Principles of cell volume regulation. In: Strange K, editor. Cellular and Molecular Physiology of Cell Volume Regulation. Boca Raton, FL: CRC; 1994. pp. 3–24. [Google Scholar]
- 17.Halm DR, Kirk KL, Sathiakumar KC. Stimulation of Cl permeability in colonic crypts of Lieberkuhn measured with a fluorescent indicator. Am J Physiol. 265 doi: 10.1152/ajpgi.1993.265.3.G423. [DOI] [PubMed] [Google Scholar]; Gastrointest Liver Physiol. 1993;28:G423–G431. [Google Scholar]
- 18.Hoffmann EK, Dunham PB. Membrane mechanisms and intracellular signalling in cell volume regulation. Int Rev Cytol. 1995;161:173–262. doi: 10.1016/s0074-7696(08)62498-5. [DOI] [PubMed] [Google Scholar]
- 19.Kao HP, Abney JR, Verkman AS. Determinants of the translational mobility of a small solute in cell cytoplasm. J Cell Biol. 1993;120:175–184. doi: 10.1083/jcb.120.1.175. [DOI] [PMC free article] [PubMed] [Google Scholar]
- 20.Koncz C, Daugirdas JT. Use of MQAE for measurement of intracellular [Cl−] in cultured aortic smooth muscle cells. Am J Physiol. 267 doi: 10.1152/ajpheart.1994.267.6.H2114. [DOI] [PubMed] [Google Scholar]; Heart Circ Physiol. 1994;36:H2114–H2123. [Google Scholar]
- 21.Lakowicz JR. Principles of Fluorescence Spectroscopy. New York: Plenum; 1983. [Google Scholar]
- 22.Lau KR, Evans RL, Case RM. Intracellular Cl− concentration in striated intralobular ducts from rabbit mandibular salivary glands. Pflügers Arch. 1994;427:24–32. doi: 10.1007/BF00585938. [DOI] [PubMed] [Google Scholar]
- 23.Muallem SB, Zhang X, Loessberg PA, Star RA. Simultaneous recording of cell volume changes and intracellular pH or Ca2+ concentration in single osteosarcoma cells UMR-106-01. J Biol Chem. 1992;267:17658–17664. [PubMed] [Google Scholar]
- 24.O’Donnell ME, Brandt JD, Curry FR. Na-K-Cl cotransport regulates intracellular volume and monolayer permeability of trabecular meshwork cells. Am J Physiol. 268 doi: 10.1152/ajpcell.1995.268.4.C1067. [DOI] [PubMed] [Google Scholar]; Cell Physiol. 1995;37:C1067–C1074. [Google Scholar]
- 25.Ohtsuyama M, Suzuki Y, Samman G, Sato F, Sato K. Cell volume analysis of gramicidin-treated eccrine clear cells to study regulation of Cl channels. Am J Physiol. 265 doi: 10.1152/ajpcell.1993.265.4.C1090. [DOI] [PubMed] [Google Scholar]; Cell Physiol. 1993;34:C1090–C1099. [Google Scholar]
- 26.Orosz DE, Garlid KD. A sensitive new fluorescence assay for measuring proton transport across liposomal membranes. Anal Biochem. 1993;210:7–15. doi: 10.1006/abio.1993.1143. [DOI] [PubMed] [Google Scholar]
- 27.Rae JL, Watsky MA. Ionic channels in corneal endothelium. Am J Physiol. 270 doi: 10.1152/ajpcell.1996.270.4.C975. [DOI] [PubMed] [Google Scholar]; Cell Physiol. 1996;39:C975–C989. [Google Scholar]
- 28.Vasseur M, Frangne R, Alvarado F. Buffer-dependent pH sensitivity of the fluorescent chloride-indicator dye SPQ. Am J Physiol. 264 doi: 10.1152/ajpcell.1993.264.1.C27. [DOI] [PubMed] [Google Scholar]; Cell Physiol. 1993;33:C27–C31. [Google Scholar]
- 29.Verkman AS. Development and biological applications of chloride-sensitive fluorescent indicators. Am J Physiol. 259 doi: 10.1152/ajpcell.1990.259.3.C375. [DOI] [PubMed] [Google Scholar]; Cell Physiol. 1990;28:C375–C388. [Google Scholar]
- 30.Verkman AS, Chao AC, Hartmann T. Hormonal regulation of Cl transport in polar airway epithelia measured by a fluorescent indicator. Am J Physiol. 262 doi: 10.1152/ajpcell.1992.262.1.C23. [DOI] [PubMed] [Google Scholar]; Cell Physiol. 1992;31:C23–C31. [Google Scholar]
- 31.Wigham CG, Guggenheim JA, Hodson SA. Sodium movement into and out of corneal endothelium. Pflügers Arch. 1994;428:577–582. doi: 10.1007/BF00374580. [DOI] [PubMed] [Google Scholar]