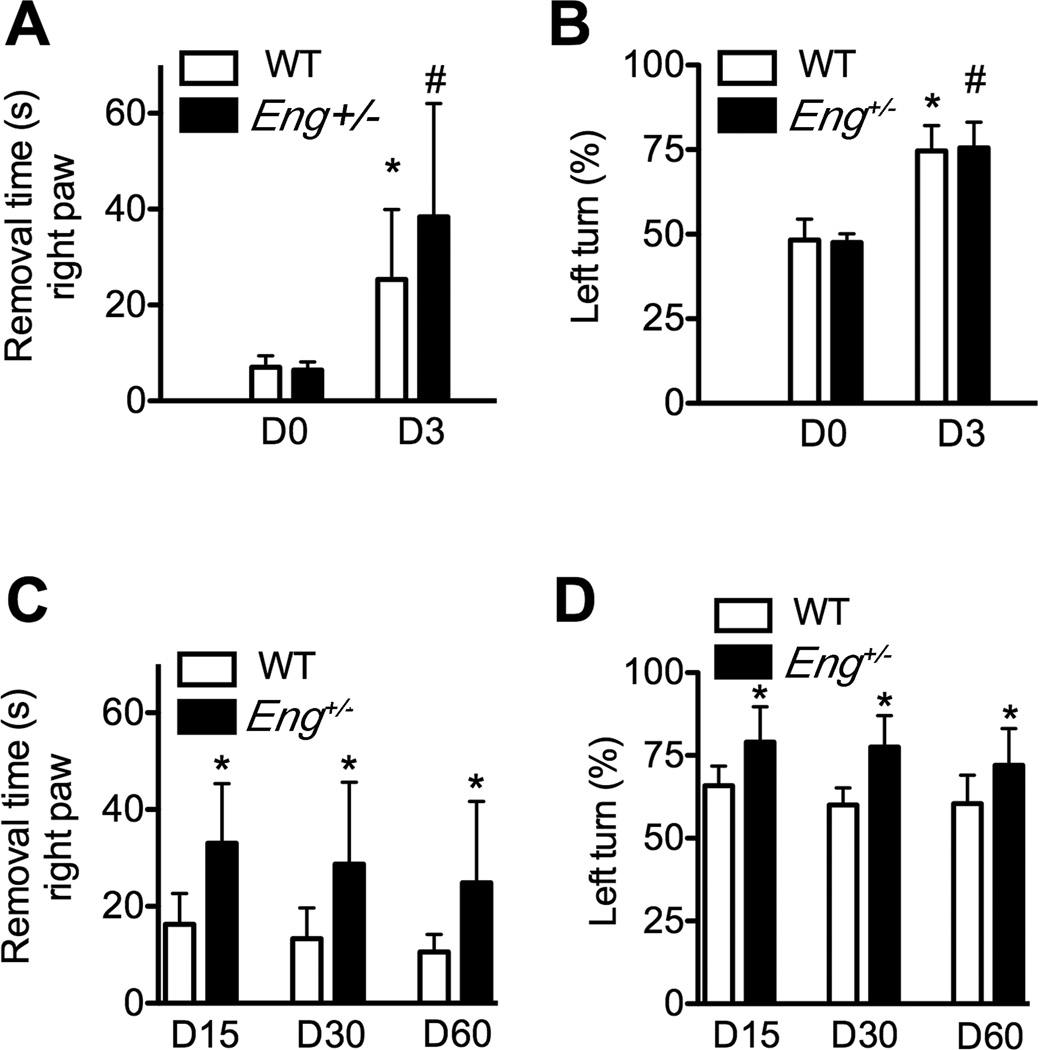
Figure 1. Behavior dysfunction.
A. Quantification of the adhesive removal test from the right paw. *p=0.001 vs. WT on day 0; #: P=0.13 vs. WT on day 3 B. Quantification of the corner test on day 0 and day 3. *: P<0.001 vs WT on day 0. #: P=0.78 vs. WT on day 3. C. Quantification of the adhesive removal test from the right paw on days 15, 30 and 60 after pMCAO. *: P<0.05 vs. corresponding WT groups. D. Quantification of the corner test on days 15, 30 and 60. *: P<0.05 vs. corresponding WT group. D0, D3, D15, D30 and D60 are 0, 3, 15, 30 and 60 days, respectively, after pMCAO.

