Abstract
Drug penetration into solid tumors is critical for the effectiveness of clinical chemotherapy. Failing to consider the efficiency of drug penetration can lead to fatal recurrence in many cancers. Three-dimensional (3D) cell cultures have served as an important model system and have contributed to valuable assays in drug discovery studies. However, limited methodologies result in incomplete evaluation of the distribution of many anticancer drugs. As a proof-of-concept study, we have applied matrix-assisted laser desorption/ionization (MALDI) imaging mass spectrometry (IMS) in HCT 116 colon carcinoma multicellular spheroids to assess the distribution of the anticancer drug, irinotecan. The time-dependent penetration of irinotecan was visualized and the localization of three metabolites as well as the parent drug in treated spheroids was mapped. To validate the identities of the metabolites, we analyzed extracts from drug-treated spheroids using nanoflow liquid chromatography-tandem mass spectrometry (nLC-MS/MS). Ten metabolites were identified with nLC-MS/MS, including those detected by MALDI IMS. This novel approach allows the measurement of drug penetration and distribution in 3D culture mimics and provides a more cost and time-effective approach for the testing of new pharmaceuticals compared to animal models.
Fast growing tumors frequently have inadequate vasculature, creating a significant barrier for chemotherapeutic agents to reach all cells within the tumor mass.1,2 This feature of the tumor microenvironment results in limited distribution of several anticancer drugs, which has been shown to be a probable cause of clinical drug resistance.3–6 During pharmaceutical development, one of the core goals is to understand the tissue distribution of drugs and their metabolites.7 However, because of technical challenges, little is known about the ability of even some of the most established anticancer drugs to fully penetrate solid tumors.8
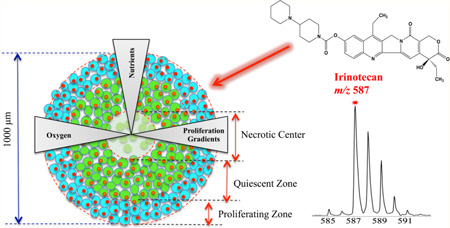
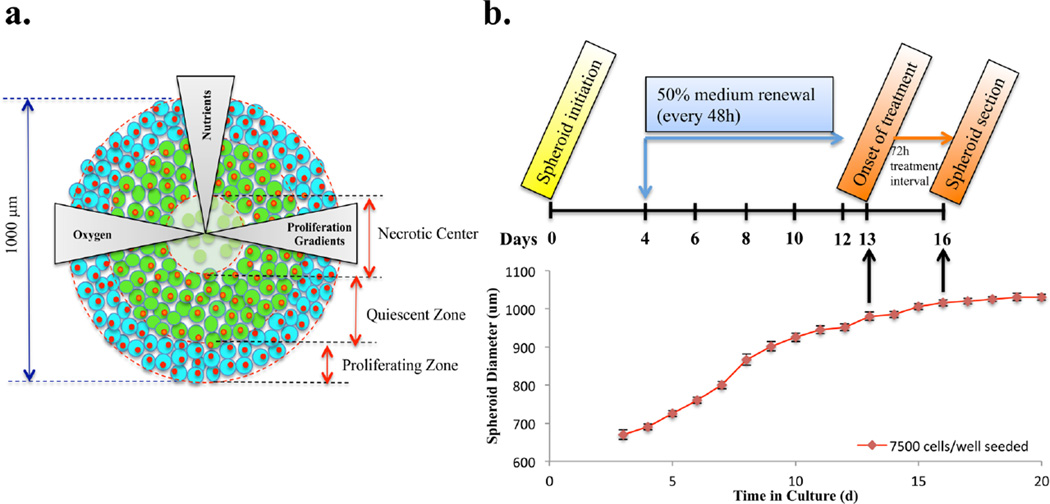
The standard cell-based assay for testing anticancer agents is two-dimensional (2D) cell cultures. 2D cell cultures are simple and convenient but do not accurately mirror the structure, complexity and pathophysiology of in vivo tissue.2,9 Animal models are more representative of the tumor environment; however, animal studies are comparably more time-consuming and expensive to perform than cell culture for large-scale drug screening.10,11 3D cell culture systems are becoming essential tools in bridging the gap between unsophisticated 2D culture models and in vivo studies as they closely mimic the tumor microenvironment in terms of cell–cell and cell–matrix interactions, and genetic profiles.2,9,12,13 Among 3D cultures, multicellular spheroids are well studied and most commonly used in assessing drug penetration.12 These tumor mimics can grow to a diameter of 1 mm and the heterogeneity of the spheroid is similar to avascular microregions of tumors.12,14 Spheroids display a pathophysiological gradient with an outer layer of actively proliferating cells, a middle layer of quiescent cells, and a core of necrotic cells, as a result of decreasing nutrient and oxygen concentrations from the exterior of the spheroid to the center (Figure 1a).12–14 The complexity in these structures mimics the physiological barrier for drugs to target cells in vivo, resulting in a heterogeneous response to anticancer drugs, which is critical for pharmaceutical testing.2
Figure 1.
Timetable for setting up spheroid-based drug evaluation. (a) Cartoon structure of the in vitro tumor spheroid. (b) Schematic illustration of dosing procedures and diameter growth of HCT 116 spheroids as a function of time. Photographs (n = 8) were acquired every day and spheroid diameters were calculated using a hemocytometer scale bar. The interwell variation in spheroid diameter was under 5%.
Traditionally, direct assessment of the distribution of drugs in 3D tissue relies on methodologies such as microscopy or autoradiography.15,16 Most drugs possess insufficient color or fluorescent properties to be examined, except for certain clinical drugs like doxorubicin and mitoxantrone.2,5,6 Also, metabolites that do not contain a radiolabel cannot be detected.2,17 Other noninvasive imaging techniques such as positron emission tomography (PET) and magnetic resonance imaging (MRI) do provide information on drug dispersion in tumors, but the submillimeter and millimeters resolution is an obvious deficiency in reflecting the microregional differences of drug distribution within tissues.18
MALDI IMS is a potent label-free technology, which enables visualization of a variety of different endogenous and exogenous species directly from tissue sections.19–21 In this case, a photoactive MALDI matrix is uniformly applied to the sample surface and cocrystallizes with the analytes. When the analytes are irradiated with a laser, they are converted into the gas phase and ionized. By rastering a laser over the sample surface, an ordered array of mass spectra is acquired to generate an ion density map.
The MALDI imaging approach was initially developed for protein imaging.19,22 In a previous study in our group, this technology was used to map spatial distributions of proteins across spheroids from the colon carcinoma cell line HCT 116, with specific species detected only in the central necrotic core and other proteins present throughout the structures.14 Not only is MALDI IMS valuable in profiling proteins, for pharmacology studies, it is also an attractive technology capable of providing a specific ion image for the simultaneous evaluation of drugs and their metabolites in tissue and whole animals.23–25 As a small biomolecules-imaging tool, it does not require any specific labels for the analytes. As a result, the approach can be used in a discovery mode to determine the location of novel metabolites. Applications in analyzing pharmaceutical agents have shown success in studies of cancer,26–28 lung diseases,29,30 and brain diseases.31–33
The focus of this study is to expand MALDI IMS in 3D spheroids for assessing the distribution of pharmaceuticals and their metabolites. As a proof-of-concept study, we started with evaluation of 7-ethyl-10-[4-(1-piperidino)-1-piperidino]-carbonyloxy camptothecin or irinotecan, a water-soluble drug given clinically for colon cancer.34 Irinotecan can be converted into the active metabolite 7-ethyl-10-hydroxycamptothecin (SN-38) in vivo by carboxylesterases.34,35 Binding to its target Topoisomerase I, which plays a significant role in DNA replication and transcription, SN-38 interferes with DNA synthesis, and repair process and finally leads to cell death.36 The alteration of SN-38 to a glucuronide metabolite (SN-38G) can inactivate the active metabolites being formed.35,36 Other metabolites from irinotecan such as 7-ethyl-10-[4-N-(5-aminopentanoic acid)-1-piperidino]carbonyloxycamptothecin (APC) and 7-ethyl-10-(4-amino-1-piperidino) carbonyloxycamptothecin (NPC) are from oxidation reactions mediated by cytochrome P-450 (CYP) 3A.34,35,37 APC and NPC are both weak inhibitors of Topoisomerase I.35 While NPC can be converted to SN-38 by human carboxylesterase, APC is not a substrate of this enzyme.34,38 Although metabolites have been assessed for irinotecan, spatial distribution of the drug and its metabolites in tumor tissues is still under study.39
By applying MALDI IMS in 3D cell culture systems, we are able to demonstrate a time-dependent penetration of irinotecan in HCT 116 3D spheroids as well as simultaneous mapping of the drug and three metabolites in sections of the tumor mimics. For validation of IMS results, nLC-MS/MS was used to confirm drug metabolite identities. This approach is more effective in screening the efficacy of drug candidates than 2D culture assays. It also provides a less expensive and higher-throughput alternative for the testing of therapeutics compared to animal models.
EXPERIMENTAL SECTION
Cell Culture and In Vitro 3D Tumor Spheroids Formation
The colon carcinoma cell line HCT 116 was purchased from the American Type Culture Collection (ATCC, Manassas, VA) and maintained in McCoy’s 5A cell culture media (Life Technologies, Grand Island, NY) supplemented with 10% fetal bovine serum (Thermo Scientific, Gaithersburg, MD) and 1% L-glutamine (Invitrogen, San Diego, CA). Cells were grown in 5% CO2 at 37 °C and passed every five days. Cell lines were used within three months after resuscitation of frozen aliquots thawed from liquid nitrogen. The provider assured the authentication of these cell lines.
Spheroids were prepared in agarose-coated 96-well plates as previously described.14 Cells were seeded into each well at the density of 7000 cells/well, gently agitated for 3 min, incubated at 37 °C, and 50% of the culture media was changed every 48 h after 4 days in culture. The uniform and compact multicellular spheroids were used for follow-up studies. Spheroids were analyzed in biological triplicate.
Drug Efficacy Assay in HCT 116 Spheroids
Irinotecan hydrochloride was purchased from Sigma (St. Louis, MO). A range of concentrations (0.2, 0.8, 1.7, 2.7, 5.3, 8.5, 10.7, 21.3, 34.1, 42.6, 85.2, 170.4, and 511.1 µM) of irinotecan were prepared by dissolving the drug in nanoPure water and diluted in McCoy’s 5A media. Two hundred microliters of irinotecan solutions were then added to the spheroids with a diameter around 950 µm (12–14 days in culture for 7000 cells/well initial seeding density) by replacing the old media. Untreated control spheroids were cultured in parallel as reference. After 72 h, cell viability and metabolic activity was measured using the Cell Titer-Blue Viability assay (Promega, Madison, WI), which is based on the reduction of a nonfluorescent dye resazurin to the red fluorescent product resorufin resulting from active growth of cells. Five spheroids for each concentration of irinotecan were transferred to a new 96-well plate containing 100 µL of media in each well, and 20 µL of dye was then added. After one and a half hours of incubation, plates were read for fluorescence intensity at 560 and 590 nm wavelengths for excitation and emission, respectively, using a plate reader (Spectramax M5, Sunnyvale, CA). Viability of irinotecan-treated spheroids was compared to untreated spheroids. Dose– response curves and half maximal inhibitory concentration (IC50) values were calculated via Statistical Program for Social Sciences (SPSS) software (IBM, Chicago, IL).
Spheroids Preparation for MALDI IMS Analysis
Irinotecan was dissolved in nanoPure water and added to McCoy’s 5A media at a final concentration of the determined IC50 20.6 µM (Supporting Information Figure 1). The spheroid diameter at the onset of treatment was the same as in the drug efficacy assay. A schematic illustration of the model system is shown in Figure 1. Stock solution of irinotecan was prepared in nanoPure water at 2 mg/mL. This solution was then diluted in McCoy’s 5A media to achieve a final concentration of 20.6 µM. For visualization of drug penetration, spheroids were treated with 20.6 µM of irinotecan for various lengths of time (2, 6, 12, 24, 48, and 72 h) whereas the same volume of media without the drug was added to the control spheroids. After specific incubation times, the media was aspirated and the spheroids were washed with 1× phosphate buttered saline (PBS) three times. The tumor spheroids were then harvested and sectioned into 12 µm-thick slices by using the gelatin assisted sectioning method as previously described. To avoid the delocalization of the drug and its metabolites, the washing steps for the slices were skipped.
The MALDI matrix generates “background ions” that can interfere with analysis, especially of small molecules.20,21 In this research, the matrix α-cyano-4-hydroxycinnamic acid (CHCA, m/z 190.17) (Sigma-Aldrich, St. Louis, MO), shows the least background interference with irinotecan. CHCA was dissolved in 50:50 HPLC-grade acetonitrile (ACN)/water with 0.1% trifluoroacetic acid (TFA) (EMD, Billerica, MA) to yield a final concentration of 10 mg/mL. An airbrush was used to apply the matrix to the sample, and the application was monitored under an inverted microscope with 10× magnification.
Extraction of Small Molecules for nLC-MS/MS Analysis
A 96-well plate of spheroids was prepared. Half of the spheroids were left untreated and the remainder was incubated with media containing irinotecan at a concentration of 20.6 µM. After 72 h, 10 treated and 10 untreated spheroids were washed with PBS three times and harvested in separate microcentrifuge tubes. A protein precipitation method (PPE)39,40 was used to extract small molecules from the spheroids. Briefly, 200 µL HPLC-grade methanol (Honeywell Burdick & Jackson, Muskegon, MI) was added to the tubes containing the spheroids and homogenized by sonication. After 20 min, samples were centrifuged at 14000 × g for 10 min at 4 °C and supernatants were decanted into new microcentrifuge tubes and evaporated to dryness using a Speedvac. The samples were resuspended in 30 µL of HPLC-grade water and 2 µL was injected directly into the nLC-MS/MS system for analysis.
MALDI IMS
An AutoFlex III (Bruker Daltonics, Billerica, MA) was operated in positive ion mode with the reflector on and set to acquire a mass range of 380–700 m/z. The laser raster was set to 75 µm along both x-axis and y-axis and the attenuator was set at 68%. Each MALDI mass spectrum for each voxel is the result from 200 consecutive laser shots at each spot. External calibration was performed using a custom peptide mixture by adding a calibration spot on one spheroid region on the section. The images were then processed with FlexAnalysis 3.0 and FlexImaging 2.1 (Bruker Daltonics, Billerica, MA) to generate a 2D ion density map with semiquantitative information accompanied by a color scale exported from the FlexImaging software.
For statistical analysis, image files were converted to mzXML format and preprocessed using in-house written scripts for MATLAB (Mathworks, Natick, MA). This processing consisted of baseline subtraction, alignment of peaks to specific m/z values on the spectra, and reduction of noise. All spectra were normalized against total ion current, defined as the sum of all intensities in the mass range analyzed (380–700 m/z), to reduce influences by, that is, matrix hot spots.21
nLC-MS/MS Conditions
A nanoAcquity ultra performance LC system (Waters, Milford, MA) was used for separation of the small molecules. Spheroid extracts were automatically loaded onto a commercial C18 reversed-phase column (Waters, 100 µm × 100 mm, 1.7 µm particle size, column temperature 40 °C) with 97% buffer A (0.1% formic acid in water) and 3% buffer B (0.1% formic acid in ACN) for 10 min at a low rate of 1.2 µL/min, followed by gradient separation in 40 min. Buffer B was increased from 3% to 60% in 15 min, 0.1 min to 85% and maintained for 5 min. The column was equilibrated for 10 min with 3% buffer B before the next injection. Each sample was injected multiple times providing three technical replicates per sample. The eluted small molecules were analyzed by a Q-Exactive instrument (Thermo Fisher Scientific, Waltham, MA). The Orbitrap mass analyzer was used to acquire full MS scans over the range m/z 350–1800 with a mass resolution of 70000 (target value 1.00 × 10⁶). The twelve most intense peaks were fragmented in the HCD collision cell with normalized collision energy of 30%, and tandem mass spectra were acquired with a mass resolution of 35 000 (target value 1.00 × 1006). The maximum allowed ion accumulation time was 250 ms for full MS scans and 120 ms for tandem mass spectra. Data were analyzed by Xcalibur software (Thermo Fisher Scientific, Waltham, MA).
RESULTS AND DISCUSSION
Multicellular spheroids, which closely represent morphological and functional features of in vivo tumor tissue, provide an excellent 3-dimensional model for distribution studies of drugs and metabolites. For example, in mouse tumors and human breast cancer, doxorubicin has been shown to accumulate around blood vessels, resulting in decreasing drug concentrations in tumor cells that are distant from the micro-vessels.5,41,42 These results are consistent in showing poor penetration of doxorubicin into spheroids.43–46 Radiolabeled methotrexate47,48 and vincristine49 have also been shown to have limited penetration into spheroids. Cells located in the spheroid periphery with direct access to the drug in culture media are comparable to those tumor cells situated close to capillaries in vivo. In contrast, the innermost cells in spheroids are representative of tumor cells distal from capillaries with poor access to the drug.45,46 However, evaluation for therapeutics has been restricted for these drugs incorporating endogenous or exogenous chemical labels before measurements.47–50 Modifications to the native structure of drugs can have unpredicted influences on the absorption, distribution, metabolism, and activity properties of the drug.2 As a powerful alternative method that does not require labeling the samples, MALDI IMS has shown its ability in accurate characterization of endogenous proteins and lipids, as well as drugs and small molecules within the tissue. In this study, we used this technique to map the unlabeled drug irinotecan and its metabolites in 3D cell culture systems.
Time-Dependent Penetration of Irinotecan
In clinical use, irinotecan for injection must be diluted prior to infusion, using 5% dextrose injection or 0.9% sodium chloride injection with the final concentration not exceeding 0.5 mg/mL (851.8 µM).51 In this study, the determined IC50 for irinotecan in HCT 116 spheroids is 20.6 µM, which is within the range of clinical dose of the drug. Spheroids treated with this concentration of irinotecan maintained their structural integrity (Supporting Information Figure 2), and could be harvested and sectioned.
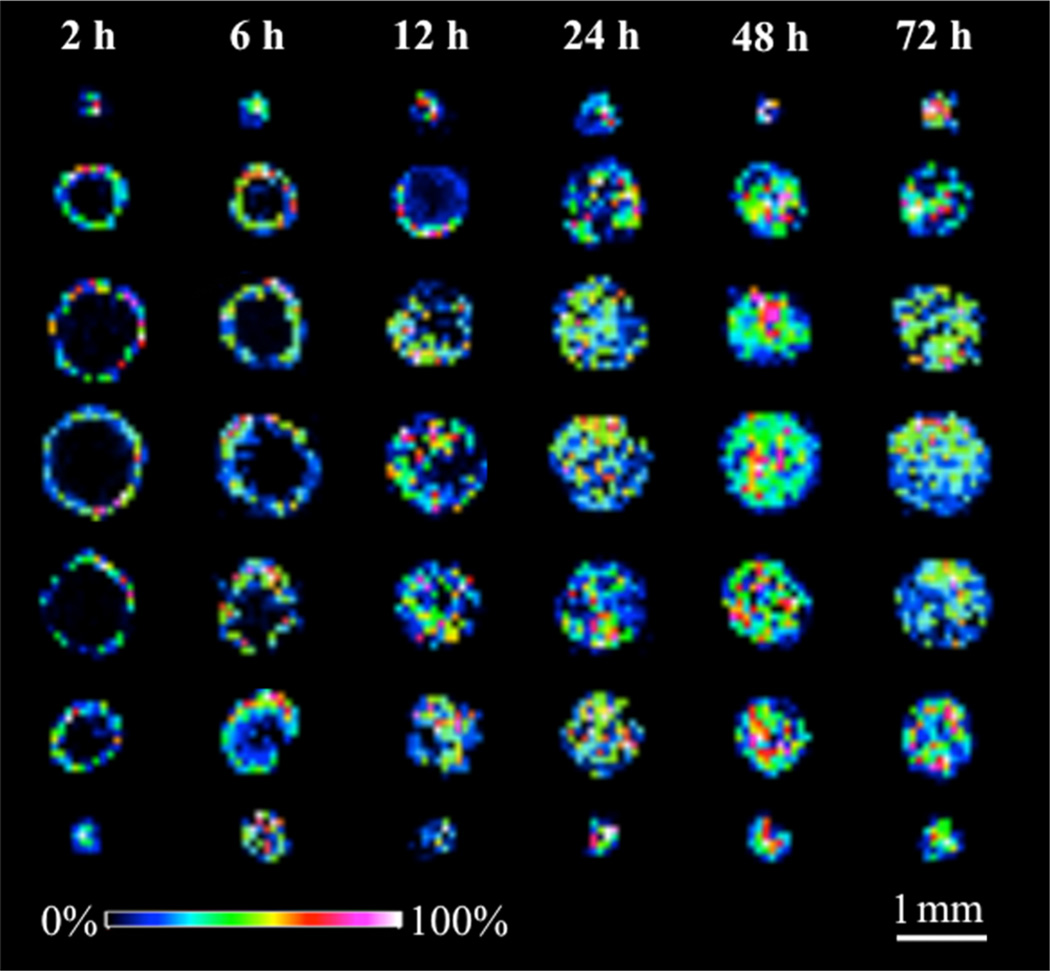
Spheroids initiated from same seeding density of HCT 116 cells were treated with the drug for different lengths of time. Spheroids were then harvested and sectioned. The thickness of the section affects the mass spectrometry results. The overall number and intensity of peaks increase with thinner sections.14 To achieve the maximum spectral signal while keeping the integrity of section, we cut 12 µm thick sections. A total of 13 consecutive 12 µm slices in 60 µm vertical intervals were imaged for every spheroid. To avoid redundancy, the color gradient intensity maps from every other slice (7 of the 13 imaged) in 120 µm vertical intervals are shown in Figure 2.
Figure 2.
Time-dependent penetration of irinotecan (m/z 587) in HCT 116 spheroids analyzed by MALDI-IMS. Spheroids were treated with 20.6 µM irinotecan for 2, 6, 12, 24, 48, and 72 h (from left to right). For every treatment duration, color gradient intensity maps were generated from 7 consecutive 12 µm slices from a single spheroid in 120 µm vertical intervals.
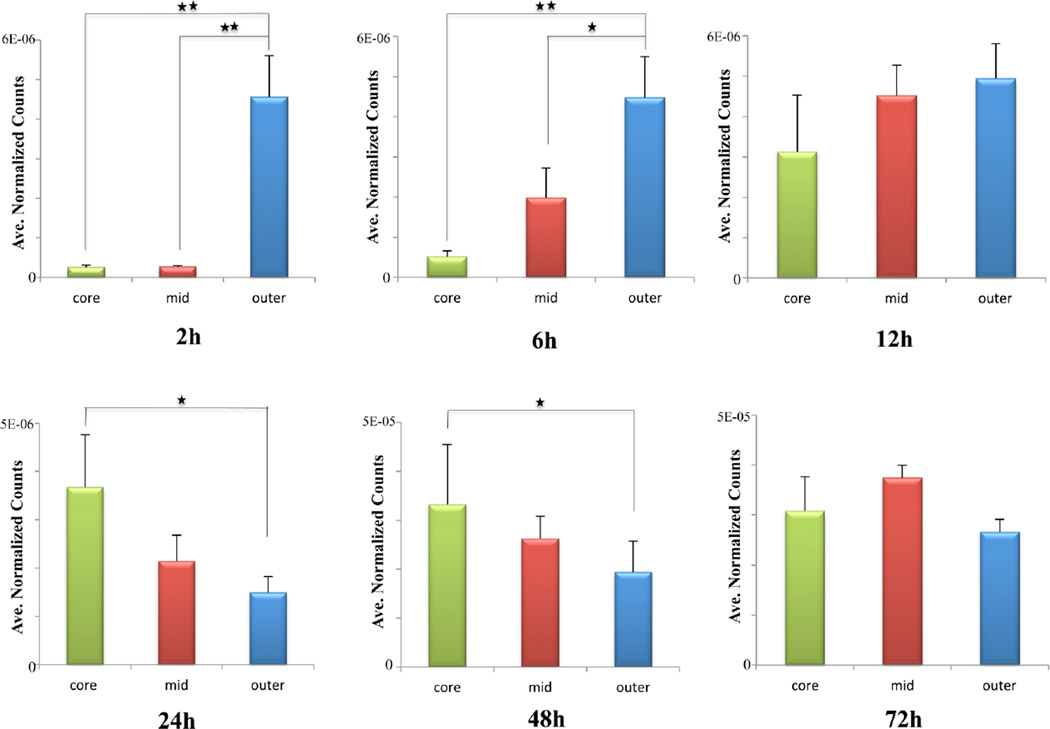
Spheroids exhibit an inherent gradient of nutrients and oxygen, resulting in a necrotic core surrounded by an inner layer of quiescent cells and an outer layer of proliferating cells. (Figure 1a) Depending on their location, these cells have different access to the drug in culture media. Therefore, relative quantification was performed to compare drug signal intensities between different regions of dosed spheroids over time. After the spectra were processed and normalized as described before, three different regions, representing the core, mid, and outer areas, respectively, were selected based on the optical image of each dosed spheroid sections (Supporting Information Figure 3). Spectra from these regions of interest were then extracted and the average intensities of the pixels for irinotecan were calculated using MATLAB. Data from the central three sections of each single spheroid at each drug treatment time point (slices on third, fourth, and fifth rows of Figure 2) were analyzed using the method described above. Significant differences in the drug signal between different regions were assessed using one-way analysis of variance (ANOVA) with SPSS software. Differences were considered significant if p < 0.05 (Figure 3).
Figure 3.
Relative quantification of irinotecan levels in three regions (core, mid, outer) of dosed spheroids. Data was processed and normalized by using MATLAB. Spectra were extracted from different regions of interest and irinotecan signal intensity was then averaged. Error bars stands for the standard error for measurements of three sections from a single dosed spheroid at each time point. *p < 0.05, **p < 0.01.
Irinotecan accumulation in the periphery and the center of spheroids increased with time. At the initial time points of 2 and 6 h of treatment, irinotecan starts spreading into the spheroids without entering the core. The drug is shown to be concentrated in the outer rim, compared to the mid or inner areas (p values < 0.01 for both regions). An enhanced penetration of drug into the central part of the spheroids is observed after 12 h of incubation. Irinotecan was distributed across the entire structure of the tumor spheroids after 24 and 48 h of treatment, with the central hypoxic and necrotic regions of the spheroids showing higher levels of drug compared to the outer regions (p values < 0.05). The accumulation of irinotecan in the hypoxic regions of spheroids indicates a less active metabolism of the parent drug by nonproliferative or dead cells. In contrast, an increasing metabolism of irinotecan by highly proliferating cells results in a lower level of the drug detected in the outer area of spheroid sections.
Drugs penetrate tissues by both diffusion and concerted transportation.2 The physicochemical properties of drugs (for example, size, shape, and solubility) determine the rate of diffusion through tissue.2 The results show the presence of the drug molecule in all regions of the spheroid structure after 12 h treatment, indicating that as a water-soluble drug, irinotecan can efficiently diffuse between and through cells.
Identification of Irinotecan Metabolites by nLC-MS/MS
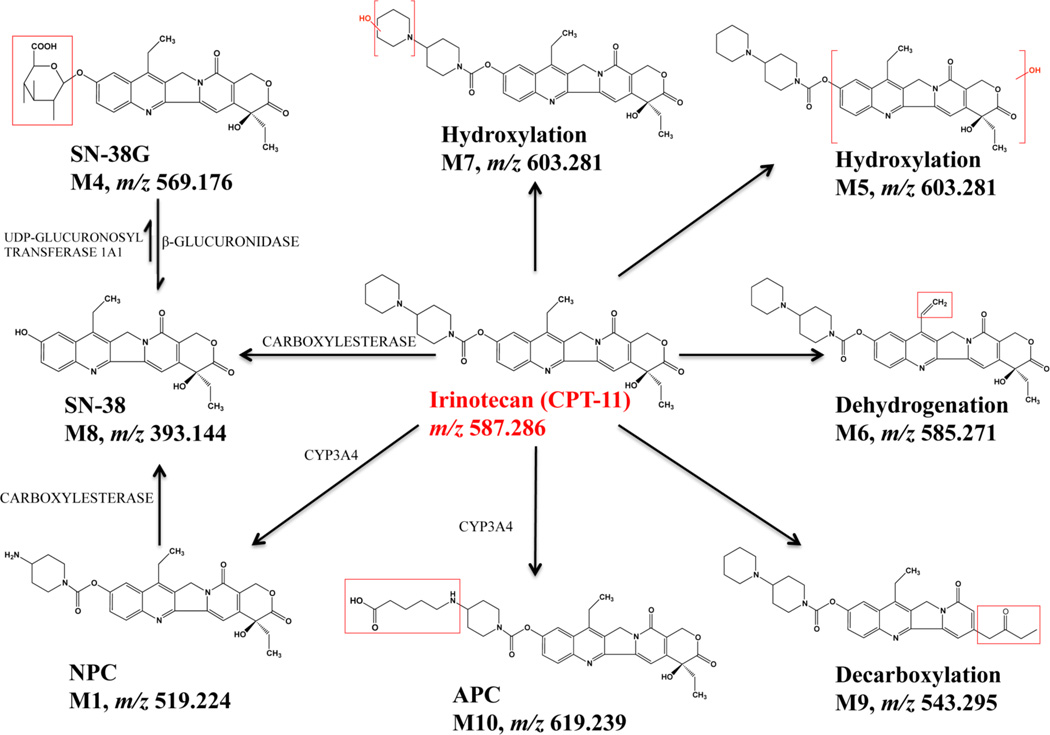
The identities of the irinotecan metabolites were examined by nLC-MS/MS. Ion chromatograms and HCD MS/MS spectra were extracted for the small molecules isolated from the drug-treated spheroids (Supporting Information Figure 4). Ten metabolites in total were identified (Table 1).
Table 1.
Identification of Irinotecan Metabolites from Irinotecan Treated Spheroids (20.6 µM, 72 h) by LC-MSa
| Metabolite number |
Retention Time (min) |
Metabolite identity |
Formula change |
Theoretical MH+m/z |
Measured MH+m/z |
MH+ mass spectrum fragment ions |
|---|---|---|---|---|---|---|
| Ml | 17.63 | NPC (loss of terminal piperidine) |
-C5H8 | 519.224 | 519.223 |
m/z 393.144 (SN-38+H)+ m/z 349.154 (393-CO2) |
| M2 | 17.66 | Unknown | N.A. | N.A. | 559.254 |
m/z 515.265 (-CO2) m/z 474.165 m/z 195.149 |
| M3 | 18.00 | Unknown | N.A. | N.A. | 573.270 |
m/z 529.280 (-CO2) m/z 488.181 m/z 195.149 |
| M4 | 18.03 | SN-38 Glucuronide |
SN-38 + C6H8O6 |
569.176 | 569.174 | m/z 393.143 (SN-38+H)+ |
| M5 | 18.11 | Hydroxylation | + 0 | 603.281 | 603.280 |
m/z 518.191 m/z 195.149 |
| M6 | 18.32 | Dehydrogenation | -H2 | 585.271 | 585.270 |
m/z 541.281 m/z 124.112 |
| P | 18.41 | Irinotecan | N.A. | 587.286 | 587.285 |
m/z 543.295 (-CO2) m/z 502.196 m/z 331.143 (375-CO2) m/z 195.149 |
| M7 | 18.78 | Hydroxylation (oxidation of terminal piperidine) |
+ 0 | 603.281 | 603.281 |
m/z 559.291 (-CO2) m/z 502.196 [-(85+16)amu] m/z 331.144 (375-CO2)) m/z 183.113 |
| M8 | 18.97 | SN-38 | -C11H18N2O | 393.144 | 393.143 | m/z 349.154 (-CO2) |
| M9 | 19.78 | Decarboxylation | -CO2 | 543.296 | 543.295 |
m/z 458.206 m/z 195.149, 124.112 |
| M10 | 19.84 | APC (double oxidation of terminal piperidine) |
+ O2 | 619.276 | 619.239 |
m/z 502.195 [-(85+32)amu] m/z 393.144 (SN-38+H)+ m/z 349.154 (393-CO2) m/z 227.102 |
Those highlighted in different colors were the metabolites also detected by MALDI IMS on spheroid sections. N.A. = not available.
Except for the parent drug, the decarboxylation metabolite 9 (m/z 543.295) has the most intense peak compared to the other metabolites. The active metabolite SN-38 (m/z 393.143) and its inactive form, SN-38G (m/z 569.174), have also been detected at a relatively high abundance.
Three metabolites that correspond to the oxidation of irinotecan were detected. Metabolite 7 (m/z 603.281) results from the oxidation of the terminal piperidine,52 whereas the oxidation of the camptothecin moiety results in metabolite 5 (m/z 603.280).52 APC (m/z 619.239) is caused by a double oxidation of the terminal piperidine.35 Finally, the loss of this distal piperidine ring structure results in the metabolite NPC (m/z 519.223).34,35 The metabolite 6 (m/z 585.270) is the dehydrogenation metabolite of Irinotecan, which has previously been reported.34,35,52 Among these metabolites, only APC and NPC have been evaluated for their cytotoxic capacity and illustrated a weaker inhibition of cell growth in culture than SN-38 by binding to Topoisomerase I.52 The biological function of other metabolites remains unknown.35,52
Two putative metabolites, M2 and M3, were detected. M2 corresponds to a loss of 28 mass units from irinotecan, and its MS/MS spectra indicate that modification of the metabolite most likely occurred on the lactone ring. Also, spectra from M3 show a similar pattern, demonstrating a possible modification on the camptothecin skeleton. Other technology, like NMR spectroscopy, can be used to further determine the structures of the metabolites. The results of the MS/MS analyses are summarized in Figure 4.
Figure 4.
Metabolism scheme for irinotecan (unknown M2 and M3 not included). All of the species depicted were detected by LC-MS/MS.
Distribution of Irinotecan and Its Metabolites in 3D Spheroids
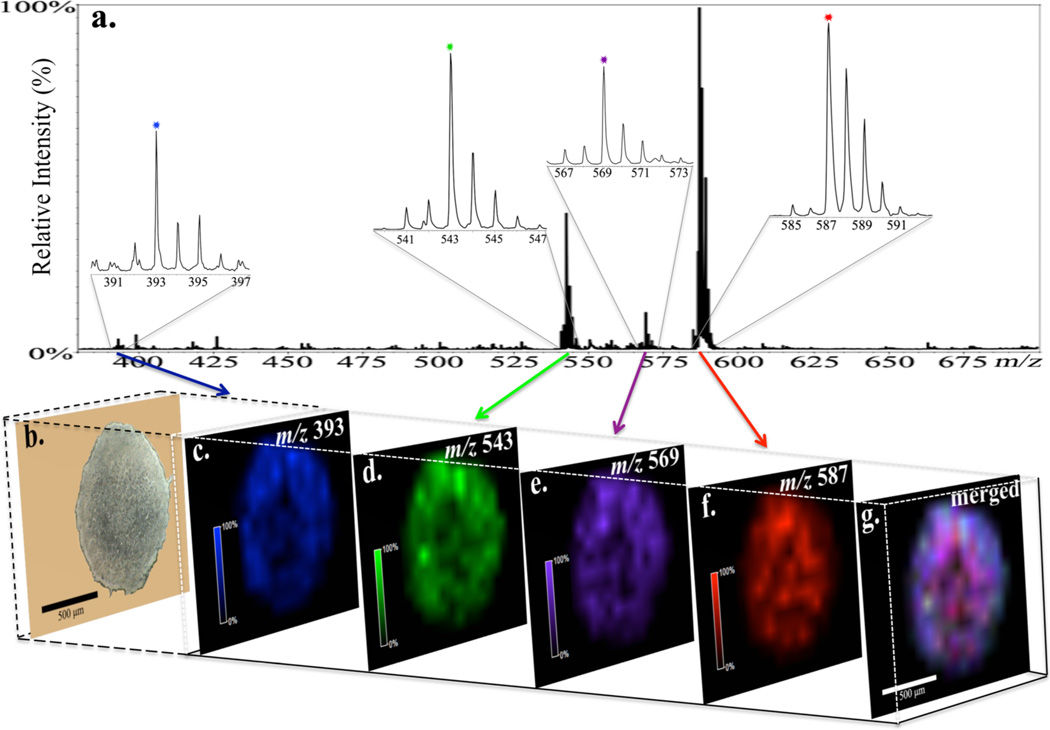
MALDI IMS provides sensitive image analysis of not only the parent drug, but also the metabolites simultaneously. Once the metabolites of irinotecan were identified by nLC-MS/MS analysis, we went back to study their distribution pattern in treated spheroids. Three metabolites SN-38 (m/z 393, Figure 5c), SN-38 glucuronide (m/z 569, Figure 5e) and a decarboxylation metabolite (m/z 543, Figure 5d) as well as the parent drug (m/z 587, Figure 5f) were detected in treated spheroids after 72 h of drug incubation. The merged image (Figure 5g) illustrates a great abundance of irinotecan (red) distributed across the spheroid section. Other metabolites appear to be more concentrated in the outer rim of the structure, which suggests a higher metabolism of the drug in viable cells at proliferative and quiescent zones of the 3D spheroids. The spectra (Figure 5a) demonstrate the most intense peak from irinotecan with the metabolites at a lower relative abundance, which is in accordance with the images from ion density maps. Also, the decarboxylation metabolite (m/z 543) shows a relative high intensity compared to the other two metabolites detected, which is in consistent with the nLC-MS/MS results. None of these peaks from the drug or metabolites were detected in the untreated spheroid sections (Supporting Information Figure 5).
Figure 5.
Distributions of irinotecan and three metabolites within a 12 µm section of an irinotecan-treated (20.6 µM, 72h) HCT 116 spheroid obtained by MALDI-imaging. (a, b) Mass-to-charge plot and optical image of the spheroid section. Spatial localizations of (c) SN-38 (m/z 393, blue), (d) decarboxylation metabolite (m/z 543, green), (e) SN-38G (m/z 569, purple), and (f) irinotecan (m/z 587, red). (g) Merged image shows high relative abundance of irinotecan.
CONCLUSIONS
As a proof of principle study, we have applied MALDI IMS in 3D cell culture systems to map the distribution of the clinically used therapeutic, irinotecan. The penetration of the drug into colon spheroids increases as a function of time. Three metabolites of irinotecan were also mapped. Identification of these and other metabolites was confirmed with an nLC-MS/MS study. This combination of 3D tumor models analyzed by MALDI IMS technology and nLC-MS/MS analysis could assist the use of the high throughput, uniform, and heterogeneous spheroids for becoming a mainstream in vitro approach to screen and select drugs in a format that more closely recapitulates conditions in patients. It is also applicable to mapping drugs and metabolites in various diseases. This system will help to reduce animal testing, yield more predictive data, and reduce cost and time to efficiently evaluate new drug candidates, as well as identifying their known and potential metabolites. All of these advantages would boost the speed of therapeutic development from lab to market.
Supplementary Material
ACKNOWLEDGMENTS
The authors wish to thank Dr. Richard Keithley for extensive discussions on statistical analyses. We also wish to thank Dr. William C. Boggess and Dr. Michelle V. Joyce of the Notre Dame Mass Spectrometry and Proteomics Facility and Sarah Chapman of the Notre Dame Integrated Imaging Facility. Financial support was provided by the 2011 Starter Grant from the Society for Analytical Chemists of Pittsburgh and the University of Notre Dame.
Footnotes
ASSOCIATED CONTENT
Supporting Information
Additional material as describe in the text. This material is available free of charge via the Internet at http://pubs.acs.org.
The authors declare no competing financial interest.
REFERENCES
- 1.Jain RK. Sci. Am. 1994;271(1):58–65. doi: 10.1038/scientificamerican0794-58. [DOI] [PubMed] [Google Scholar]
- 2.Minchinton AI, Tannock IF. Nat. Rev. Cancer. 2006;6:583–592. doi: 10.1038/nrc1893. [DOI] [PubMed] [Google Scholar]
- 3.Grantab R, Sivananthan S, Tannock IF. Cancer Res. 2006;66(2):1033–1039. doi: 10.1158/0008-5472.CAN-05-3077. [DOI] [PubMed] [Google Scholar]
- 4.Kyle AH, Huxham LA, Yeoman DM, Minchinton AI. Clin. Cancer Res. 2007;13(9):2804–2810. doi: 10.1158/1078-0432.CCR-06-1941. [DOI] [PubMed] [Google Scholar]
- 5.Primeau AJ, Rendon A, Hedley D, Lilge L, Tannock IF. Clin. Cancer Res. 2005;11:8782–8788. doi: 10.1158/1078-0432.CCR-05-1664. [DOI] [PubMed] [Google Scholar]
- 6.Kyle AH, Huxham LA, Chiam AS, Sim DH, Minchinton AI. Cancer Res. 2004;64(17):6304–6309. doi: 10.1158/0008-5472.CAN-04-1099. [DOI] [PubMed] [Google Scholar]
- 7.Castellino S. Bioanalysis. 2012;4(21):2549–51. doi: 10.4155/bio.12.251. [DOI] [PubMed] [Google Scholar]
- 8.Tannock IF, Lee CM, Tunggal JK, Cowan DS, Egorin MJ. Clin. Cancer Res. 2002;8:878–84. [PubMed] [Google Scholar]
- 9.Fennema E, Rivron N, Rouwkema J, van Blitterswijk C, de Boer J. Trends Biotechnol. 2013;31(2):108–15. doi: 10.1016/j.tibtech.2012.12.003. [DOI] [PubMed] [Google Scholar]
- 10.Lange N, Ballini JP, Wagnieres G, van den Bergh H. Invest. Ophthalmol. Vis. Sci. 2001;42(1):38–46. [PubMed] [Google Scholar]
- 11.Fox JT, Myung K. Oncotarget. 2012;3(5):581–5. doi: 10.18632/oncotarget.513. [DOI] [PMC free article] [PubMed] [Google Scholar]
- 12.Vinci M, Gowan S, Boxall F, Patterson L, Zimmermann M, Court W, Lomas C, Mendiola M, Hardisson D, Eccles SA. BMC Biol. 2012;10:29. doi: 10.1186/1741-7007-10-29. [DOI] [PMC free article] [PubMed] [Google Scholar]
- 13.Anada T, Fukuda J, Sai Y, Suzuki O. Biomaterials. 2012;33(33):8430–41. doi: 10.1016/j.biomaterials.2012.08.040. [DOI] [PubMed] [Google Scholar]
- 14.Li H, Hummon AB. Anal. Chem. 2011;83(22):8794–801. doi: 10.1021/ac202356g. [DOI] [PubMed] [Google Scholar]
- 15.Godugu C, Patel AR, Desai U, Andey T, Sams A, Singh M. PLoS One. 2013;8(1):e53708. doi: 10.1371/journal.pone.0053708. [DOI] [PMC free article] [PubMed] [Google Scholar]
- 16.Ma HL, Jiang Q, Han S, Wu Y, Cui Tomshine J, Wang D, Gan Y, Zou G, Liang XJ. Mol. Imaging. 2012;11(6):487–98. [PubMed] [Google Scholar]
- 17.Namur J, Citron SJ, Sellers MT, Dupuis MH, Wassef M, Manfait M, Laurent AJ. Hepatol. 2011;55(6):1332–8. doi: 10.1016/j.jhep.2011.03.024. [DOI] [PubMed] [Google Scholar]
- 18.Mehta G, Hsiao AY, Ingram M, Luker GD, Takayama SJ. Controlled Release. 2012;164(2):192–204. doi: 10.1016/j.jconrel.2012.04.045. [DOI] [PMC free article] [PubMed] [Google Scholar]
- 19.Schwartz SA, Caprioli RM. Methods Mol. Biol. 2010;656:3–19. doi: 10.1007/978-1-60761-746-4_1. [DOI] [PubMed] [Google Scholar]
- 20.Saito Y, Waki M, Hameed S, Hayasaka T, Setou M. Biol. Pharm. Bull. 2012;35(9):1417–24. doi: 10.1248/bpb.b212007. [DOI] [PubMed] [Google Scholar]
- 21.Weaver EM, Hummon AB. Adv. Drug Delivery Rev. 2013 doi: 10.1016/j.addr.2013.03.006. [DOI] [PubMed] [Google Scholar]
- 22.Zaima N, Hayasaka T, Goto-Inoue N, Setou MJ. Oleo. Sci. 2009;58(8):415–9. doi: 10.5650/jos.58.415. [DOI] [PubMed] [Google Scholar]
- 23.Walch A, Rauser S, Deininger SO, Hofler H. Histochem. Cell Biol. 2008;130(3):421–34. doi: 10.1007/s00418-008-0469-9. [DOI] [PMC free article] [PubMed] [Google Scholar]
- 24.Drexler DM, Garrett TJ, Cantone JL, Diters RW, Mitroka JG, Prieto Conaway MC, Adams SP, Yost RA, Sanders MJ. Pharmacol. Toxicol. Methods. 2007;55(3):279–88. doi: 10.1016/j.vascn.2006.11.004. [DOI] [PubMed] [Google Scholar]
- 25.Khatib-Shahidi S, Andersson M, Herman JL, Gillespie TA, Caprioli RM. Anal. Chem. 2006;78(18):6448–56. doi: 10.1021/ac060788p. [DOI] [PubMed] [Google Scholar]
- 26.Tata A, Fernandes AM, Santos VG, Alberici RM, Araldi D, Parada CA, Braguini W, Veronez L, Silva Bisson G, Reis FH, Alberici LC, Eberlin MN. Anal. Chem. 2012;84(15):6341–5. doi: 10.1021/ac301202q. [DOI] [PubMed] [Google Scholar]
- 27.Meesters RJ, van Kampen JJ, Scheuer RD, van der Ende ME, Gruters RA, Luider TMJ. Mass Spectrom. 2011;46(3):282–9. doi: 10.1002/jms.1897. [DOI] [PubMed] [Google Scholar]
- 28.Chaurand P, Schwartz SA, Reyzer ML, Caprioli RM. Toxicol. Pathol. 2005;33(1):92–101. doi: 10.1080/01926230590881862. [DOI] [PubMed] [Google Scholar]
- 29.Vegvari A, Dome B. Bioanalysis. 2011;3(23):2665–77. doi: 10.4155/bio.11.271. [DOI] [PubMed] [Google Scholar]
- 30.Haddrell AE, van Eeden S, Agnes GRJ. Proteome Res. 2008;7(6):2539–45. doi: 10.1021/pr700602q. [DOI] [PubMed] [Google Scholar]
- 31.Pirman DA, Reich RF, Kiss A, Heeren RM, Yost RA. Anal. Chem. 2013;85(2):1081–9. doi: 10.1021/ac302960j. [DOI] [PubMed] [Google Scholar]
- 32.Reyzer ML, Hsieh Y, Ng K, Korfmacher WA, Caprioli RMJ. Mass Spectrom. 2003;38(10):1081–92. doi: 10.1002/jms.525. [DOI] [PubMed] [Google Scholar]
- 33.Li F, Hsieh Y, Kang L, Sondey C, Lachowicz J, Korfmacher WA. Bioanalysis. 2009;1(2):299–307. doi: 10.4155/bio.09.27. [DOI] [PubMed] [Google Scholar]
- 34.Sai K, Kaniwa N, Ozawa S, Sawada JI. Drug Metab. Dispos. 2001;29(11):1505–13. [PubMed] [Google Scholar]
- 35.Slatter JG, Schaaf LJ, Sams JP, Feenstra KL, Johnson MG, Bombardt PA, Cathcart KS, Verburg MT, Pearson LK, Compton LD, Miller LL, Baker DS, Pesheck CV. Drug Metab. Dispos. 2000;28(4):423–33. [PubMed] [Google Scholar]
- 36.Kumar N, Sangeetha D, Reddy SPJ. Chromatogr. Sci. 2012;50(9):810–9. doi: 10.1093/chromsci/bms075. [DOI] [PubMed] [Google Scholar]
- 37.Baylatry MT, Joly AC, Pelage JP, Bengrine-Lefevre L, Prugnaud JL, Laurent A, Fernandez CJ. Chromatogr. B Analyt. Technol. Biomed. Life Sci. 2010;878(9–10):738–42. doi: 10.1016/j.jchromb.2010.01.017. [DOI] [PubMed] [Google Scholar]
- 38.D’Esposito F, Tattam BN, Ramzan I, Murray M. J. Chromatogr. B Analyt. Technol. Biomed. Life Sci. 2008;875(2):522–30. doi: 10.1016/j.jchromb.2008.10.011. [DOI] [PubMed] [Google Scholar]
- 39.Saito Y, Yasunaga M, Kuroda J, Koga Y, Matsumura Y. Cancer Sci. 2008;99(6):1258–64. doi: 10.1111/j.1349-7006.2008.00806.x. [DOI] [PMC free article] [PubMed] [Google Scholar]
- 40.Luthi G, Blangy V, Eap CB, Ansermot NJ. Pharm. Biomed. Anal. 2012;77C:1–8. doi: 10.1016/j.jpba.2012.12.023. [DOI] [PubMed] [Google Scholar]
- 41.Lankelma J, Dekker H, Luque FR, Luykx S, Hoekman K, van der Valk P, van Diest PJ, Pinedo HM. Clin. Cancer Res. 1999;5:1703–1707. [PubMed] [Google Scholar]
- 42.Vail DM, Amantea MA, Colbern GT, Martin FJ, Hilger RA, Working PK. Semin. Oncol. 2004;31:16–35. doi: 10.1053/j.seminoncol.2004.08.002. [DOI] [PubMed] [Google Scholar]
- 43.Erlanson M, Daniel-Szolgay E, Carlsson J. Cancer Chemother. Pharmacol. 1992;29:343–353. doi: 10.1007/BF00686002. [DOI] [PubMed] [Google Scholar]
- 44.Erlichman C, Vidgen D. Cancer Res. 1984;44:5369–5375. [PubMed] [Google Scholar]
- 45.Durand RE. J. Natl. Cancer Inst. 1986;77:247–252. [PubMed] [Google Scholar]
- 46.Durand RE. Cancer Res. 1981;41:3495–3498. [PubMed] [Google Scholar]
- 47.Cowan DS, Tannock IF. Int. J. Cancer. 2001;91:120–125. doi: 10.1002/1097-0215(20010101)91:1<120::aid-ijc1021>3.0.co;2-y. [DOI] [PubMed] [Google Scholar]
- 48.West GW, Weichselbaum R, Little JB. Cancer Res. 1980;40:3665–3668. [PubMed] [Google Scholar]
- 49.Wibe EJ. Cancer. 1980;42:937–941. doi: 10.1038/bjc.1980.344. [DOI] [PMC free article] [PubMed] [Google Scholar]
- 50.Sutherland R, Buchegger F, Schreyer M, Vacca A, Mach JP. Cancer Res. 1987;47:1627–1633. [PubMed] [Google Scholar]
- 51.Shah MA, Kortmansky J, Motwani M, Drobnjak M, Gonen M, Yi S, Weyerbacher A, Cordon-Cardo C, Lefkowitz R, Brenner B, O’Reilly E, Saltz L, Tong W, Kelsen DP, Schwartz GK. Clin. Cancer Res. 2005;11(10):3836–45. doi: 10.1158/1078-0432.CCR-04-2651. [DOI] [PubMed] [Google Scholar]
- 52.Santos A, Zanetta S, Cresteil T, Deroussent A, Pein F, Raymond E, Vernillet L, Risse ML, Boige V, Gouyette A, Vassal G. Clin. Cancer Res. 2000;6:2012–2020. [PubMed] [Google Scholar]
Associated Data
This section collects any data citations, data availability statements, or supplementary materials included in this article.


