

Abstract
Individual elements that constitute the immune system have been characterized over the past decades, largely through reductionist approaches. More recently the introduction of large-scale profiling platforms has enabled the assessment of these elements on a global scale. However, the analysis and interpretation of such large-scale data remains a challenge and a barrier for the wider adoption of systems approaches in immunological and clinical studies. Here, we describe an analytic strategy relying on the a priori determination of co-dependent gene sets for a given biological system. Such modular transcriptional repertoires can in turn be used to simplify the analysis and interpretation of large-scale datasets and to design targeted immune fingerprinting assays and web applications that will further facilitate the dissemination of systems approaches in immunology.
The use of large-scale profiling assays in the field of immunology has increased rapidly over the past few years. These so called ‘systems approaches’ provide investigators with a global perspective of the complex molecular and cellular events that unfold during the development of immune responses. Systems scale studies have measured changes associated with hematopoiesis, innate and adaptive immune responses in disease pathogenesis and, more recently, responses to vaccines in vivo, leading to major advances in immunological knowledge 1,2,3,4,5. The technological breakthroughs that have revolutionized genomics, proteomics and multi-parameter flow cytometry have also provided systems immunologists with a brand new tool kit with which to investigate immunological responses. These advances along with the studies that have resulted from them have already been discussed elsewhere6.
In this Innovation article, we will focus on the data analysis hurdles encountered by investigators that have adopted systems approaches. Indeed, mining and interpreting large-scale data remains the major bottleneck, especially now that profiling technologies have become both robust and relatively inexpensive. Systems-scale data provide detailed phenotypic information and constitute a vast pool of primary data from which critical insight can be obtained. However, importantly, such data also provide us with the information necessary to map relationships between the individual elements of the immune system and to gain a holistic understanding of the molecular and cellular events that lead to an immune response.
We provide an introduction to network analysis [Box 1], an approach that is particularly well suited for the study of interactions between the constituents of a system, and briefly review the use of this approach for the identification of regulatory networks in immunology studies. We then describe the use of network analysis as a means for teasing out relationships that define a biological system, such as blood, from collections of transcriptome datasets. The resulting repertoire of co-clustering gene sets, also called modules, serves as a basis for streamlining data analysis and forging new bioinformatics tools and assays that can contribute towards making systems approaches more widely accessible to the immunology research community.
BOX 1. A primer on network analysis.
The availability of large-scale profiling technologies provides a unique opportunity to study relationships among the elements of a given system. These relationships can be visualized as a network or graph, in which nodes represent elements of the system (for example, genes, transcripts, proteins, metabolites) and edges represent relationships between any two elements (for example, functional, physical, regulatory)49. Edges may be undirected to indicate a symmetric relationship (that is, the relationships from A to B and from B to A are equivalent) as occurs in co-expression and physical interaction networks, or they may be directed (that is, a relationship from A to B implies nothing about a relationship from B to A) as often occurs in regulatory and enzymatic networks. Edges can also be weighted either quantitatively or qualitatively to indicate relationship type and/or strength (Box 1 Figure).
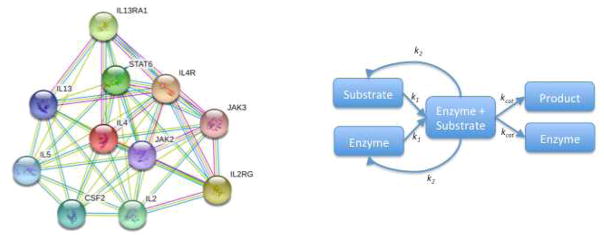
A. An undirected and unweighted graph generated by String (http://string-db.org/), showing potential interactions among IL-4 and proteins found to interact with IL-4. Nodes represent proteins. Edges represent evidence of interaction between proteins. Edge color indicates the type of evidence for the interaction.
B. A directed and weighted graph of a single substrate enzyme catalyzed reaction. Nodes represent components components of the reaction. Edges represent the kinetics of the reaction and are weighted by the appropriate rate constants (k1: rate of enzyme-substrate association; k2: rate of enzyme-substrate disassociation; kcat: rate of enzyme catalysis)
Analyzing networks of the scale dictated by systems biology approaches is challenging. Unfortunately, using the majority of available layout algorithms, large networks have a tendency to form the infamous ‘hairball’, which can be impressive visually, but is of limited value for data interpretation. Not only are such visualizations too cluttered for the human eye to easily distinguish structural features, particularly given our propensity for finding meaningful patterns in meaningless or random data, but also most layout algorithms are stochastic and produce multiple layouts for a single network. Additionally, such layouts are typically not robust and can change drastically with minor alterations in the underlying data. For these reasons and others, it is difficult to visually compare and contrast networks even when the visualization is generated by the same layout algorithm. Recent work in graph visualization addresses problems of reproducibility and comparability (Hive Plots [http://egweb.bcgsc.ca/]50 and Circos [http://circos.ca/]51), but the fact remains that systematic analysis of large scale network data is still better accomplished through objective computational approaches.
Network analyses in immunology
Network analyses have been used in immunology to identify the key transcriptional regulators that govern the development of immune cells and their response to immunomodulatory factors (for a primer on network analyses, see BOX 1). Most studies have relied on co-expression networks constructed from whole genome transcript profiling to identify candidate regulators that can be subsequently tested in downstream functional screens. The benefit of this approach over more conventional reductionist methods lies in its ability to accelerate the discovery of ‘master regulators’ and the assembly of comprehensive regulatory circuits7.
Network analyses have been employed most extensively to unravel transcriptional networks controlling innate immune signaling. These studies are important to elucidate transcriptional networks governing downstream signaling of the numerous pattern-recognition receptors adorning innate immune cells. Recent work has made use of systems-scale and targeted profiling approaches together with RNA interference (RNAi) screens to identify a large number of regulators involved in Toll-like receptor signaling8. In another study, network analyses of systems-scale data and downstream target validation in knockout-mouse models identified regulatory nodes controlling interferon responses subsequent to viral infection9. Such work has been well covered by recent reviews and will not be discussed further here7,10,11.
Network analyses have also been employed in studies investigating the development of the immune system. The differentiation of hematopoietic stem cell progenitors into various cell populations that are able to carry out a wide array of specialized functions is complex. This process is dictated by anatomical location, the presence of growth and other immunomodulatory factors and, ultimately, transcriptional regulation. Investigators studying hematopoiesis have relied on genome-wide transcript profiling technologies for in depth phenotyping of immune cell populations and marker identification12. But such data have also been used for the construction of large co-expression networks13,14,15,16. One of the most comprehensive networks built to date was constructed using transcriptional profiles from 38 purified cell populations, including hematopoietic stem cells, progenitor cells, and cell populations at multiple stages of maturation15. This study identified modules of tightly co-expressed genes, inferred regulatory circuits controlling hematopoiesis, and then screened candidate master regulators in downstream binding and functional assays. More recently a similar endeavor led to the identification of factors regulating hematopoiesis in mice16. In another study, a regulatory network incorporating microRNA (miRNA) and transcript profiling data obtained in nine blood leukocyte populations identified a small number of cell-specific miRNAs likely to play a role in hematopoietic cell development and functional specialization17.
The intricate cellular and molecular events taking place during the development of immune responses have also been investigated using systems-scale profiling approaches. Immune responses involve terminal differentiation of cells of the adaptive immune system into highly specialized effector cells. The differentiation of B cells into antibody-secreting cells (ASCs) and memory B cells is governed by several key regulators18. Transcription factors promoting the B cell gene-expression programme are essential for B cell development and maturation (for example, PAX5, BACH2), for the formation of germinal centers (for example, BCL6, OCT and OBF1) and to modulate the differentiation process. Another set of regulators promote the ASCs gene-expression programme (for example, IRF4, BLIMP1). Transcriptome profiles of B cell populations at different stages of their development have been generated1,19,20, but no study to date has undertaken an extensive analysis of the transcriptional networks that regulate B cell differentiation. T cells also undergo cellular changes as they develop from antigen-inexperienced naïve cells to specialized effectors that have acquired, for example, regulatory, memory or exhausted phenotypes. These multiple differentiation paths are regulated at the transcriptional level and a number of master regulators of T cell fate have been identified through reductionist candidate-based approaches. Examples of these master regulators include transcription factors such as T-bet, GATA2, RORγt and FOXP3, which are implicated in the development of CD4+ T-cells into various T helper or regulatory cell subsets. More recent efforts have used large-scale profiling platforms in order to obtain in depth molecular phenotypes of various T cell subsets and have identified a plethora of new candidates to be tested21,22,23,24,25. Such a systems approach has, for instance, led to the characterization of the transcriptional programme that is upregulated by PD-1 in exhausted CD8+ T cells and uncovered the role of the transcription factor BATF in this process26. In another recent study, investigators identified 39 candidate regulators of mouse TH17 cell differentiation through the investigation of dynamic regulatory networks derived from temporal transcriptome profiling data27.
Remarkable progress in our understanding of molecular mechanisms regulating immunity have been achieved through systems-scale network analyses. However, it is evident that more work is needed, especially to uncover transcription factors involved in orchestrating lymphocyte differentiation and, to complete the overall picture by identifying the transcriptional circuits that these factors regulate28.
Modular repertoire analysis
Network analyses have been pioneered and expertly applied to the mining of systems data by several groups with the main goal of unraveling the key elements regulating transcriptional programmes (as illustrated above and in29,30,31,32). However, network analyses have not been adopted as a ‘mainstream’ approach for the analysis of large-scale data. Instead, most investigators have favored other strategies often involving feature selection (group comparison), or dimension reduction (for example, hierarchical and k-means clustering, principal component analysis) (see BOX 2). These latter approaches are easier to implement and are effective dimension reduction methods because they group genes or samples based on similarities in patterns of gene expression, an essential step for the interpretation of large-scale data. They also allow visualization through clustering on a heatmap or through PCA plots, which can be valuable sources of insight. Network analyses on the other hand are more computationally intensive approaches and limited information is conveyed through the visualization of large networks. It should be noted that functional networks, which are ubiquitously employed to assist with the interpretation of analysis results, are not built based on large-scale data but are derived from curated knowledge bases.
BOX 2. Mainstream analytic approaches in systems studies.
This box provides a high level overview of analytic approaches that are commonly used in systems studies. Here they are grouped in three main categories.
Feature selection: these approaches aim to identify for a given dataset a subset of features (e.g. transcripts) that are “meaningful” or “informative”. Those are for instance signature (subsets of analytes detected by a given assay) differentiating study groups, or correlating with other analytes or study parameters of interest. Feature selection rely on arbitrary cutoffs, that may be statistical (p-values) or otherwise (e.g. fold change). An alternative to the use of cutoffs is the rank ordering of analytes (based for instance on fold change, r values, p values etc…). The large number of measurements derived from systems approaches requires the analyst to pay particular attention to false positives that result from multiple testing. Statistical testing plays an important role in identifying subsets of feature but one should also take biological significance or meaning into account when performing such analyses. The investigator may rely on his/her knowledge of the biomedical literature to infer biological significance or may rely on annotations, or in the case of module repertoire analyses, on co-clustering information obtained at the systems level.
Dimension reduction: dimension reduction is another cornerstone of systems-scale analyses that is used for scaling down the data to a manageable number of variables. When using a data-driven approach it generally consists in the identification of co-variates that are collapsed into new composite variables (e.g. principal component analysis) or grouped together as a set or signature (e.g. hierarchical clustering or k-means clustering). When using a knowledge-driven approach variables can also be grouped based on similarity in function, or participation in a molecular pathway. However, a known functional association does not necessarily result in correlated measurements and it is therefore usually not possible to derive summarized data from such functional gene sets or modules.
Functional interpretation: functional interpretation can be guided by the use of bioinformatics tools but in fine should rely on the investigator’s own judgment and insight. Bioinformatic tools can bring context or provide the analyst with an initial direction and rely on testing for enrichment of a given set of analytes across “canonical” functional sets corresponding to pathways or ontologies. When basing interpretations on the results of such analyses one should be aware of the fact that it tends to reinforce well established knowledge and therefore present some degree of circularity.
In our work, we have employed network analyses to identify variable dependency and have leveraged this information to simplify mainstream analysis and interpretation of large-scale data. This approach is statistically valuable. When performing t-tests on tens of thousands of variables, which require stringent multiple testing corrections in order to control false positive rates, one assumes that all variables are independent from one another. However, this is not the case in biological systems. For instance, when analyzing tissues such as the blood, scores of transcripts will change in a coordinated fashion as a result of the induction of anti-viral or inflammatory pathways, or the appearance or disappearance of leukocyte populations. Network analyses can be employed to a priori determine inter-dependence between variables of a biological system of interest – for instance the blood transcriptome. In this case, we have used as input a collection of blood transcriptome datasets obtained from patients with a wide range of immunological conditions to identify the repertoire of possible coordinated transcriptional perturbations that can be measured in this tissue. This led to the identification of sets of inter-dependent transcripts, called modules, which can be employed as a framework for the subsequent analysis and interpretation of blood transcriptome datasets.
Modular repertoire identification
Human whole blood is used here to illustrate how modular repertoires can be established for a given biological system. Blood is an accessible tissue and a valuable source of information in human immunology studies. Blood transcript profiling has been employed for over 10 years to identify perturbations associated with disease pathogenesis, leading to the identification of novel therapeutic targets and development of biomarker signatures33,34. More recently this systems approach has been employed to investigate immune responses in vivo following administration of vaccines35,36,37,38,39. A primer on modular repertoire identification is provided here to provide an understanding of the basic principles underpinning this approach with a complete description of the method available in an earlier publication40.
Construction of the co-clustering network
The first step consists in assembling a collection of transcriptome datasets (Figure 1). Since our specific interest is in surveying changes in transcript abundance in blood associated with disease pathogenesis, we used blood profiles generated from patients with a wide range of diseases. Each disease-associated dataset corresponds to a given disease, includes cases and appropriate controls, and is generated as a single batch using the same microarray platform. So far we have used between 8 and 15 carefully curated datasets for repertoire identification, including a wide range of autoimmune, infectious and other immune-mediated diseases and encompassing nearly a thousand whole transcriptome profiles. Transcripts in each dataset are clustered according to similarity in pattern of expression across all samples in that particular dataset. The results are used as input to build a co-clustering network. In this network, edges are drawn when two transcripts (nodes) cluster together (‘co-cluster’) in at least one dataset. Edges are weighted according to the number of times a pair of transcripts co-cluster (for instance, they may co-cluster in all input datasets, or co-cluster in all but one input datasets, and so on). This can be compared to a social network connecting genes that tend to ‘hang out’ together as determined by their clustering behaviors in different situations. Some genes may always be found together and co-cluster 100% of the time, while others may never end up in the same clusters in any of the datasets.
Figure 1. Modular repertoire identification.

Modular repertoires are determined for a given biological system, such as whole blood, through an entirely data-driven process. A collection of relevant transcriptome datasets is assembled and carefully curated using quality control criteria. Each dataset is clustered independently and co-clustering events recorded. This information is used to build a large co-clustering network. Each edge connecting two genes indicates a co-clustering event. Edges carry different weights depending on the number of datasets in which two genes co-cluster. Highly connected subnetworks (i.e. modules) are mined using graph theory. The first round of selection (M1 modules) selects sub-networks for which connections carry the maximum weight (genes co-cluster in all datasets). Subsequent rounds of selection (M2, M3, M4…) allow for the selection of modules for which gene co-cluster in all but 1, 2, 3 or more datasets. Finally the resulting collection of modules is subjected to functional interpretation.
Identification of the modular repertoire
The next step consists of identifying and extracting sub-networks (modules) from this large and intricate co-clustering network. Identification of groups of highly interconnected gene sets is done by approaching the network as a mathematical structure or graph, using methods developed by a field of mathematics and computer science called graph theory (see BOX 3). Our algorithm starts out by identifying the sub-network with the most genes connected that co-cluster in all input datasets. It then ‘pulls in’ additional genes that connect with this core network but less frequently (all but one, two, three datasets). In the next round of selection the level of stringency used to identify core networks is progressively relaxed to identify modules formed by genes that co-cluster in all but one, two, three or more datasets. In the last round of selection modules are constituted by sets of transcripts that co-cluster in only one dataset.
BOX 3. Mining networks with graph theory.
When analyzing networks, there are questions that are common to most fields of research. How does network A compare/contrast with network B? How robust is the network? Which nodes are ‘critical’ to the network? Which nodes affect (or are connected to) the largest number of other nodes? The field of graph theory, a subfield of discrete mathematics, concerns the study of such graphs and is used to answer questions such as these. Once a problem has been abstracted to a corresponding graph, much can be learned about the underlying characteristics and structure using graph theoretic methods. Often this can help explain real-world observations.
As an example, biological data tends to produce scale-free, small-world networks52. Scale-free networks are characterized by nodes whose degree distribution asymptotically follows a power law distribution. Put simply, these networks have relatively few, very highly connected nodes (referred to as hubs). Small-world networks are those where most pairs of nodes are not connected to one another, yet most nodes can be reached from every other node through a small number of connections. One of the properties of this type of network is a high tolerance for random node failure53. Information flowing through the connections of the graph is not interrupted until a relatively large number of random nodes are deleted because an individual node is rarely necessary to preserve connections between other pairs of nodes. This characteristic is clearly exemplified in the robustness of biological organisms to genetic knockouts. Here a node (a gene and its products) has been removed from the network (interactome), and other nodes functionally compensate for the deletion. This feature has obvious implications when attempting to identify ‘critical’ nodes, whether as potential drug targets, genetic knockouts, or as vaccination targets to inhibit the spread of disease. The random approach is unlikely to yield effective results.
Thus, this step-wise approach effectively captures relationships that exist among constitutive elements of a given biological system (for example, blood) and a given range of perturbations (for example, diseases). Transcripts that co-cluster in most diseases will constitute modules selected early on in the process. Transcripts that co-cluster more specifically will constitute modules selected in later rounds of selection. In our example, 9 input datasets were used from diverse disease states including infection, autoimmunity, immune deficiency, and transplantation. As a result 260 modules were identified, which are constituted by more than 14,000 transcripts36,41.
Functional interpretation of the modular repertoire
The next step consists of functionally characterizing this modular transcriptional repertoire. The premise is that the co-clustering that is observed is driven by biological factors. As in any other tissue, changes in transcript abundance in blood can be attributed to transcriptional regulation as well as to relative changes in cellular composition, which will be reflected in the modular transcriptional repertoire of whole blood. This fact is especially important to keep in mind when analyzing such data and strategies may be used to attempt to tease apart changes that can be the consequence of these factors. Transcriptional profiles obtained for isolated cell populations may be employed to aid with data interpretation37. Statistical deconvolution strategies that have been devised for differential gene expression analysis in individual cell type in a biological sample 42 could also be implemented using summarized module-level data as input.
One of the premises of module repertoire analyses is that co-clustering among gene sets is driven by biological phenomena. Thus a great deal of time and effort can be dedicated to the interpretation of modular frameworks that are employed in the analysis of datasets over a span of several years. A wide range of approaches can be employed to derive functional annotation for gene sets. We used several commercial and publically available tools that rely on term enrichment to give indication about functional annotations that may be associated with each module gene list. However, in fine contextualization should rely more on the knowledge and intuition of the investigators assisted by such bioinformatics tools. Because a degree of subjectivity is inherent to functional interpretation we have created a wiki site that can gather input from a large user community and serves as reference: http://www.biir.net/public_wikis/module_annotation/G2_Trial_8_Modules
Dataset analyses
Modular repertoires are identified using transcriptome profiles derived from a large number of samples and a wide range of conditions. Modifying the type of samples (for example, peripheral blood mononuclear cells (PBMCs) in place of whole blood), input datasets, or microarray platform has a limited impact on repertoire identification, especially with regard to the modules identified early on in the selection process when transcripts co-clustering in all or the majority of input datasets are selected. We have demonstrated that the use of coordinately expressed gene sets (that is, modules) improved robustness when comparing results across platforms and across studies43,44. Hence the modular repertoire identified in the example provided is well suited for use as a generic framework for the analysis and interpretation of blood transcriptome datasets. To date, the work published by our laboratory has used only two modular repertoire frameworks for blood transcriptome analysis, the first generation being based on PBMC samples run on the Affymetrix platform40 and the subsequent one on whole blood samples run on Illumina36.
A key difference with gene sets derived from knowledge-driven approaches or differential-expression analyses stems from the fact that modular repertoires consist of sets of coordinately expressed genes. Also, as these transcripts follow similar patterns of expression in the system of interest (for example, whole blood) values can be summarized at the module level. This summary can be simply calculated by averaging normalized expression values of all the genes constituting a module. It is also possible to determine the proportion of transcripts passing a statistical filter for a given module, and the categories ‘increased’, ‘decreased’ or ‘unchanged’ are used to assign activity scores for each module based on the percent of increased versus decreased transcripts. Alternatively, one can simply calculate the proportion of transcripts that are increased compared with decreased without applying any statistical filter. In this case, in the absence of changes, the proportion of genes showing increases compared with decreases will be close to 50:50. When changes occur, a skewing of this ratio will be observed. The latter approach can pick up small but coordinated changes in transcript abundance that would not be considered statistically significant when treating genes as independent variables.
Working at the module level using summarized expression values also presents a distinct advantage when it comes to visualizing results (Figure 2). Changes in transcript abundance can be represented as easily interpretable ‘fingerprints’ using a grid against which modules from different rounds of selection are aligned. The position on the grid denotes the order of module selection. One row is used for each round of selection, with the first row corresponding to modules constituted by transcripts co-clustering in all input datasets (first round: M1), the second row to modules constituted by transcripts co-clustering in all but one dataset (second round: M2), and so on. Columns indicate the sequence of selection within each round. For instance module M3.4 was the fourth module identified (fourth column) within the third round of selection (third row).
Figure 2. Mapping perturbations of the modular repertoire.

Modular repertoires can be used as frameworks for the analysis of individual datasets. The proportion of transcripts in a given module passing a set cutoff and expressed as a percentage is represented as a spot on a grid. Red spots indicate an increase in transcript abundance relative to a given state. Blue spots indicate a decrease in abundance. The first row on this grid includes modules identified in the first round of selection (M1; sub-network constituted by genes co-clustering in all datasets); modules identified in subsequent rounds of selection make up the next rows (M2, M3, M4 etc…). Only modules from the first 6 rounds of selection are shown on this map. Functional interpretations are indicated by a color code on a similar grid.
Those transcripts which show significantly increased abundance relative to a baseline value (calculated, for example, from healthy controls) are represented by a red spot. A significant decrease in transcript abundance is indicated with a blue spot. A color-coded key indicates pre-determined functional annotations for each module represented on the grid. With a little practice, a trained eye can functionally interpret transcriptional results from taking a rapid glance at transcriptional perturbations represented in a fingerprint format. We have developed web applications that can be used to explore modular fingerprints, providing users with the opportunity to change cutoff values and access gene level data and interpretations. For this Review, we provide an interactive version of Figure 2 that was generated for a whole blood transcriptional profiles derived from a cohort of children with Staphylococcus aureus infection41. http://www.interactivefigures.com:80/nri/miniURL/view/Iv (See Box 2, iFigure 2 for description)
Cross-sample analyses
As illustrated in the previous section, group comparisons carried out at the gene or module-level select genes with differences in transcript abundance that are consistent between study groups (for example, case studies versus controls). But this approach tends to mask potentially informative signatures that show variability across a study population. It can be important to identify and characterize the molecular heterogeneity found in a given dataset. A modular framework can be employed to assess changes in transcript abundance in individual study subjects using a control group (for example, healthy individuals) as a baseline. First, the proportion of transcripts that deviate from the healthy group is recorded (using a cutoff value based on fold change and/or standard deviation). Next, as detailed above when carrying out group comparisons, the resulting values are the percentage of genes for which transcript abundance increases, decreases or does not change, this time determined for each individual subject. Thus it is possible to map changes in transcript abundance on a fingerprint grid (Figure 2), but this time for an individual subject, rather than a group of subjects. In order to investigate patterns of transcript abundance among individuals a heatmap format can be used where samples (columns) and modules (rows) are ordered based on similarities via hierarchical clustering (Figure 3). This analytic strategy was employed for the molecular stratification of the pediatric patient cohort used in our example and an interactive version of this plot is available online: http://www.interactivefigures.com:80/nri/miniURL/view/Ix (see Box 2 iFigure 3 for description)41. Disease classification that largely relies on observation of clinical symptoms may not reflect the underlying molecular and immunological events that lead to pathogenesis. Hence there is often a need for complementary molecular approaches to disease classification, which may lead to improved choice of treatment modalities. Thus, investigating perturbations of transcriptome repertoires in individual subjects provides a means to assess immunological changes associated with pathogenesis, disease progression or response to treatment.
Figure 3. Mapping perturbations of the modular repertoire across individual samples.

Mapping perturbations of the modular repertoire for a group of subjects does not account for the heterogeneity observed at the individual level. Modular fingerprints can be derived for individual subjects using a reference set of samples (for example,. healthy baseline). This allows for the exploration of inter-individual variability and classification of subjects according to modular patterns of activity.
Cross-study analyses
The interpretation of results of systems-scale investigations can be taken further when context is provided by public domain data. Vast amounts of data are available in public repositories such as NCBI’s Gene Expression Omnibus (http://www.ncbi.nlm.nih.gov/geo/). However, carrying out analyses across studies presents with challenges due to variations in sample collection and processing methodologies and use of different microarray or sequencing platforms. We have demonstrated that changes in transcripts abundance when summarized at the module level showed high level of concordance across platforms43. Indeed, as in the biological system of interest the genes constituting each module are co-dependent the impact of differences in probe design or mapping across platforms on overall module activity is minimized. In addition, control groups can be used as common denominators and normalizing factors for the comparison of results of modular repertoire analyses from several independent studies. Thus, pre-existing ‘reference’ data can be used for interpretation and external validation of results obtained analyzing a new dataset. Furthermore, collections of public datasets can also be subjected to ‘large-scale’ meta-analyses for de novo discovery (Figure 4).
Figure 4. Mapping perturbations of the modular repertoire across studies.

Modular repertoires can be used as frameworks for the combined meta-analysis of disparate collections of datasets. Modular fingerprints are derived independently from each study using their respective control group as baseline. Patterns of module activity are compared across studies using hierarchical clustering where studies and modules are arranged according to similarity. In the example provided results from five independent studies are compared.
As an illustration the modular transcriptional signature of patients infected with S. aureus infection used in the examples provided above is compared to signatures generated from 8 reference datasets, including a validation cohort, as well as datasets generated in the context of other studies encompassing signatures of acute viral infection (HRV, Influenza, RSV), tuberculosis and septicemic melioidosis (Figure 4; 45,46,33,47).
An interactive version of this figure is available online:http://www.interactivefigures.com/nri/analysis/metaCompare/2 (see Box 2 iFigure 4 for description).
Thus, the development of approaches enabling extraction of knowledge from the vast body of data accumulating in public repositories at increasing rates has become crucially important and the use of modular repertoires frameworks may help with this daunting task.
Forging new tools for immunological studies
Immunologists have been increasingly relying on systems approaches to gain a global perspective on the intricate molecular and cellular events involved in the orchestration of an immune response. However, the technology and bioinformatics overhead necessary to implement systems immunology studies is prohibitive for widespread use. As illustrated in the examples provided above, modular repertoires can be employed as a simplified analytic framework that is accessible to a wide range of users. Modular repertoires can also serve as a basis for the development of streamlined and cost-effective assays that can be substituted to genome-wide screens for biomarker discovery and immune phenotyping or monitoring (Figure 5). Given that each module consists of a set of co-clustered genes we can select from each module a subset that best represents the changes in transcript abundance observed for the overall set. The assay can be scaled by adjusting the number of modules covered and number of surrogate targets selected per module. For instance a 160-gene assay would cover 40 modules with 4 surrogate genes per module. The construction of a modular repertoire and subsequent selection of surrogate genes within each module is entirely data driven and unsupervised (that is, not informed by knowledge of group labels). Also the resulting ‘Transcriptome Fingerprinting’ assays can measure transcript abundance of hundreds rather than tens of thousands of genes while still reflecting changes occurring at the global level. Indeed, the full complement of genes the selected surrogate transcripts are representing remains available for functional interpretations of changes observed using a fingerprinting assay.
Figure 5. Transcriptome fingerprinting assays.

Modular repertoires can be used as a basis for the development of targeted assays. Transcripts within a module that best represent the overall pattern of transcriptional activity are used as surrogates for the entire gene set. This allows for the profiling of transcriptome repertoires with a combined set of representative targets using a cost-effective and sensitive ‘meso-scale’ profiling assay (interrogating tens or hundreds of transcripts).
Performing assays using a targeted set of genes presents several advantages. Notably it can be carried out using so called ‘meso-scale’ profiling technologies such as high throughput PCR, direct RNA capture and counting, or targeted RNA sequencing. These technologies are highly sensitive and have a wide dynamic range. The reagent cost per-sample is also reduced (~$25 to $50 per sample for a custom 200 gene panel), as is personnel time required for sample processing and data analysis. Such an assay can be implemented in a given study with little technology or bioinformatics overhead and with a rapid turnaround. It can serve as an exploratory platform for biomarker discovery or immune profiling. The repertoire these assays are built upon is based on a predetermined collection of input datasets. While a wide array of changes in transcript abundance associated with pathogenesis and immunity will be captured by this assay, it cannot replace a truly unbiased systems-scale screen and some signatures may be missed as a result. That said, the limited number of pre-selected variables that is used in a targeted assay can also increase chances of picking up significant differences as p-value corrections for multiple testing will be less penalizing when measurements are made for hundreds rather than tens of thousands of variables. Transcriptome Fingerprinting may also be a suitable first step for screening large collections of samples to inform the design of subsequent whole transcriptome studies (go/no go decision, determine sample size, select time points).
Conclusions
The establishment of stable modular repertoires could constitute a new paradigm for the analysis systems scale data. The first step consists in mining large collections of relevant datasets using powerful, yet relatively complex, network analysis. But once this repertoire has been determined investigators can leverage it as a simplified framework for the analysis and interpretation of their own data. Using sets of coordinately expressed transcripts also introduces some degree of redundancy, adding robustness to analysis results and enabling analyses across datasets or platforms. Limitations include the choice of input datasets for construction of the modules, which may not be optimal for all subsequent datasets analyzed. However, using diverse dataset inputs is likely to generate both modules that are relevant across most diseases in early rounds of module selection, as well as modules that reflect more disease specific pathways in later rounds of selection. The constitution of modular repertoire libraries should contribute to the more widespread adoption of this analytic approach. Since the initial publication in 2008 our modular repertoire framework was updated only twice, with the third generation of modules to be released soon (manuscript in preparation), but others have started to contribute additional repertoires and we anticipate that more will be released in the future48. The emergence of new technology platforms, methodological improvements and an ever growing pool of available data are the main factors driving the generation of new modular repertoires. Early testing indicates that the current framework built using array data perform well when analyzing RNA-seq data but future work will require building modular repertoires from large collections of RNA-seq data. It is also important to keep in mind that modular repertoires are ‘system-specific’, and while the approach may be generalizable it has so far only been successfully applied to blood profiling. Importantly, the development of custom web applications and targeted fingerprinting assays should help with the dissemination of systems or systems-based approaches to the wider immunology research community36.
Supplementary Material
iFigure 2 Mapping perturbations of the modular blood transcriptional repertoire associated with acute Staphylococcus aureus infection.
This is an interactive version of Figure 2. The proportion of transcripts in a given module passing a set cutoff and expressed as a percentage is represented as a spot on a grid. Red spots indicate an increase in transcript abundance relative to a given state. Interactive features include: a) the display of a pop up menu on hover of the mouse cursor over a spot, where the number and proportion of significant transcripts per module is indicated and links provided to access gene-level data and functional annotations for the module. b) under “Display Options” the user can toggle the view between “All Modules” (260 modules) and “Top Modules” (62 modules); and between “Spot chart” and “Pie chart”; a p-value slider gives user the ability to adjust the stringency of the analysis. c) under “Annotation Key” the user can toggle the view between full overlay of the color coded functional annotation key, partial view (show); or hiding the annotation key.
http://mat.benaroyaresearch.org:80/dm3/miniURL/view/IY
iFigure 3 Mapping perturbations of the modular blood transcriptional repertoire across individual subjects with acute Staphylococcus aureus infection. The proportion of transcripts in a given module passing a set cutoff is represented as a spot on a heatmap where each column represents a patient and each row a module. Red spots indicate an increase in transcript abundance relative to a given state. Interactive features include: a) the display of a pop up menu on hover of the mouse cursor over a spot, where the number and proportion of significant transcripts per module is indicated; b) the ability to toggle clustering of samples and modules on or off; c) under “Display Options” the ability to show all modules, top 62 or only annotated; to display results as a spot or as a pie chart; d) to filter modules based on a threshold activity value; d) to overlay associated clinical information on the heatmap, in the example provided disease severity is shown (information displayed on hover of the mouse cursor); more clinical variables are available and can be selected for display on the heatmap from the drop down menu).
http://www.interactivefigures.com:80/nri/miniURL/view/Ix
iFigure 4 Mapping perturbations of the modular blood transcriptional repertoire across independent studies. The proportion of transcripts in a given module passing a set cutoff is represented as a spot on a heatmap where each column represents a study and each row a module. Red spots indicate an increase in transcript abundance relative to a given state. Results from a total of 509 blood transcriptome profiles from 9 study groups derived from 5 independent studies are summarized. Interactive features of this plot include: a) the display of a pop up menu on hover of the mouse cursor over a spot, where the number and proportion of significant transcripts per module is indicated; b) the ability to toggle clustering of studies and modules on or off; c) under “Display Options” the ability to show all modules, top 62 or only annotated; to display results as a spot or as a pie chart; d) to filter modules based on a threshold activity value; d) under “legend” to display information associated with each study when clicking on the “I” information button).
http://www.interactivefigures.com/nri/analysis/metaCompare/2
Acknowledgments
We would like to thank Scott Presnell, Matthew C Altman and Elizabeth Whalen for input and comments. Brenda Norris for editorial help. Charlie Quinn, Scott Presnell, Kelly Domico, Elizabeth Whalen, Anna Bjork and Brad Zeitner for the development of web tools. NB and DC are supported by NIH grants U01AI082110, U19-AI089987, U19-AI08998 and U19-AI057234. We apologize to those in the field whose important work was not cited here due to space limitation.
References
- 1.Schuh W, Meister S, Herrmann K, Bradl H, Jack HM. Transcriptome analysis in primary B lymphoid precursors following induction of the pre-B cell receptor. Molecular immunology. 2008;45:362–375. doi: 10.1016/j.molimm.2007.06.154. [DOI] [PubMed] [Google Scholar]
- 2.Chaussabel D, Pascual V, Banchereau J. Assessing the human immune system through blood transcriptomics. BMC biology. 2010;8:84. doi: 10.1186/1741-7007-8-84. [DOI] [PMC free article] [PubMed] [Google Scholar]
- 3.Pascual V, Chaussabel D, Banchereau J. A genomic approach to human autoimmune diseases. Annual review of immunology. 2010;28:535–571. doi: 10.1146/annurev-immunol-030409-101221. [DOI] [PMC free article] [PubMed] [Google Scholar]
- 4.Li S, Nakaya HI, Kazmin DA, Oh JZ, Pulendran B. Systems biological approaches to measure and understand vaccine immunity in humans. Seminars in immunology. 2013 doi: 10.1016/j.smim.2013.05.003. [DOI] [PMC free article] [PubMed] [Google Scholar]
- 5.Ravindran R, et al. Vaccine activation of the nutrient sensor GCN2 in dendritic cells enhances antigen presentation. Science. 2014;343:313–317. doi: 10.1126/science.1246829. [DOI] [PMC free article] [PubMed] [Google Scholar]
- 6.Germain RN, Meier-Schellersheim M, Nita-Lazar A, Fraser ID. Systems biology in immunology: a computational modeling perspective. Annual review of immunology. 2011;29:527–585. doi: 10.1146/annurev-immunol-030409-101317. [DOI] [PMC free article] [PubMed] [Google Scholar]
- 7.Amit I, Regev A, Hacohen N. Strategies to discover regulatory circuits of the mammalian immune system. Nature reviews Immunology. 2011;11:873–880. doi: 10.1038/nri3109. [DOI] [PMC free article] [PubMed] [Google Scholar]
- 8.Chevrier N, et al. Systematic discovery of TLR signaling components delineates viral-sensing circuits. Cell. 2011;147:853–867. doi: 10.1016/j.cell.2011.10.022. [DOI] [PMC free article] [PubMed] [Google Scholar]
- 9.Litvak V, et al. A FOXO3-IRF7 gene regulatory circuit limits inflammatory sequelae of antiviral responses. Nature. 2012;490:421–425. doi: 10.1038/nature11428. [DOI] [PMC free article] [PubMed] [Google Scholar]
- 10.Shapira SD, Hacohen N. Systems biology approaches to dissect mammalian innate immunity. Current opinion in immunology. 2011;23:71–77. doi: 10.1016/j.coi.2010.10.022. [DOI] [PMC free article] [PubMed] [Google Scholar]
- 11.Diercks A, Aderem A. Systems approaches to dissecting immunity. Current topics in microbiology and immunology. 2013;363:1–19. doi: 10.1007/82_2012_246. [DOI] [PubMed] [Google Scholar]
- 12.Ergun A, et al. Differential splicing across immune system lineages. Proceedings of the National Academy of Sciences of the United States of America. 2013;110:14324–14329. doi: 10.1073/pnas.1311839110. [DOI] [PMC free article] [PubMed] [Google Scholar]
- 13.Schutte J, Moignard V, Gottgens B. Establishing the stem cell state: insights from regulatory network analysis of blood stem cell development. Wiley interdisciplinary reviews Systems biology and medicine. 2012;4:285–295. doi: 10.1002/wsbm.1163. [DOI] [PubMed] [Google Scholar]
- 14.Keller MA, et al. Transcriptional regulatory network analysis of developing human erythroid progenitors reveals patterns of coregulation and potential transcriptional regulators. Physiological genomics. 2006;28:114–128. doi: 10.1152/physiolgenomics.00055.2006. [DOI] [PubMed] [Google Scholar]
- 15.Novershtern N, et al. Densely interconnected transcriptional circuits control cell states in human hematopoiesis. Cell. 2011;144:296–309. doi: 10.1016/j.cell.2011.01.004. [DOI] [PMC free article] [PubMed] [Google Scholar]
- 16.Jojic V, et al. Identification of transcriptional regulators in the mouse immune system. Nature immunology. 2013;14:633–643. doi: 10.1038/ni.2587. [DOI] [PMC free article] [PubMed] [Google Scholar]
- 17.Allantaz F, et al. Expression profiling of human immune cell subsets identifies miRNA-mRNA regulatory relationships correlated with cell type specific expression. PloS one. 2012;7:e29979. doi: 10.1371/journal.pone.0029979. [DOI] [PMC free article] [PubMed] [Google Scholar]
- 18.Nutt SL, Taubenheim N, Hasbold J, Corcoran LM, Hodgkin PD. The genetic network controlling plasma cell differentiation. Seminars in immunology. 2011;23:341–349. doi: 10.1016/j.smim.2011.08.010. [DOI] [PubMed] [Google Scholar]
- 19.Murn J, et al. A Myc-regulated transcriptional network controls B-cell fate in response to BCR triggering. BMC genomics. 2009;10:323. doi: 10.1186/1471-2164-10-323. [DOI] [PMC free article] [PubMed] [Google Scholar]
- 20.Holmes ML, Pridans C, Nutt SL. The regulation of the B-cell gene expression programme by Pax5. Immunology and cell biology. 2008;86:47–53. doi: 10.1038/sj.icb.7100134. [DOI] [PubMed] [Google Scholar]
- 21.Sarkar S, et al. Functional and genomic profiling of effector CD8 T cell subsets with distinct memory fates. The Journal of experimental medicine. 2008;205:625–640. doi: 10.1084/jem.20071641. [DOI] [PMC free article] [PubMed] [Google Scholar]
- 22.Haining WN, et al. Identification of an evolutionarily conserved transcriptional signature of CD8 memory differentiation that is shared by T and B cells. Journal of immunology. 2008;181:1859–1868. doi: 10.4049/jimmunol.181.3.1859. [DOI] [PMC free article] [PubMed] [Google Scholar]
- 23.Luckey CJ, et al. Memory T and memory B cells share a transcriptional program of self-renewal with long-term hematopoietic stem cells. Proceedings of the National Academy of Sciences of the United States of America. 2006;103:3304–3309. doi: 10.1073/pnas.0511137103. [DOI] [PMC free article] [PubMed] [Google Scholar]
- 24.He F, et al. PLAU inferred from a correlation network is critical for suppressor function of regulatory T cells. Molecular systems biology. 2012;8:624. doi: 10.1038/msb.2012.56. [DOI] [PMC free article] [PubMed] [Google Scholar]
- 25.Doering TA, et al. Network analysis reveals centrally connected genes and pathways involved in CD8+ T cell exhaustion versus memory. Immunity. 2012;37:1130–1144. doi: 10.1016/j.immuni.2012.08.021. [DOI] [PMC free article] [PubMed] [Google Scholar]
- 26.Quigley M, et al. Transcriptional analysis of HIV-specific CD8+ T cells shows that PD-1 inhibits T cell function by upregulating BATF. Nature medicine. 2010;16:1147–1151. doi: 10.1038/nm.2232. [DOI] [PMC free article] [PubMed] [Google Scholar]
- 27.Yosef N, et al. Dynamic regulatory network controlling TH17 cell differentiation. Nature. 2013;496:461–468. doi: 10.1038/nature11981. [DOI] [PMC free article] [PubMed] [Google Scholar]
- 28.Angelosanto JM, Wherry EJ. Transcription factor regulation of CD8+ T-cell memory and exhaustion. Immunological reviews. 2010;236:167–175. doi: 10.1111/j.1600-065X.2010.00927.x. [DOI] [PubMed] [Google Scholar]
- 29.Zhang B, Horvath S. A general framework for weighted gene co-expression network analysis. Statistical applications in genetics and molecular biology. 2005;4:Article17. doi: 10.2202/1544-6115.1128. [DOI] [PubMed] [Google Scholar]
- 30.Stuart JM, Segal E, Koller D, Kim SK. A gene-coexpression network for global discovery of conserved genetic modules. Science. 2003;302:249–255. doi: 10.1126/science.1087447. [DOI] [PubMed] [Google Scholar]
- 31.Novershtern N, Regev A, Friedman N. Physical Module Networks: an integrative approach for reconstructing transcription regulation. Bioinformatics. 2011;27:i177–185. doi: 10.1093/bioinformatics/btr222. [DOI] [PMC free article] [PubMed] [Google Scholar]
- 32.Shmulevich I, Dougherty ER, Kim S, Zhang W. Probabilistic Boolean Networks: a rule-based uncertainty model for gene regulatory networks. Bioinformatics. 2002;18:261–274. doi: 10.1093/bioinformatics/18.2.261. [DOI] [PubMed] [Google Scholar]
- 33.Berry MP, et al. An interferon-inducible neutrophil-driven blood transcriptional signature in human tuberculosis. Nature. 2010;466:973–977. doi: 10.1038/nature09247. [DOI] [PMC free article] [PubMed] [Google Scholar]
- 34.Pascual V, et al. How the study of children with rheumatic diseases identified interferon-alpha and interleukin-1 as novel therapeutic targets. Immunological reviews. 2008;223:39–59. doi: 10.1111/j.1600-065X.2008.00643.x. [DOI] [PMC free article] [PubMed] [Google Scholar]
- 35.Gaucher D, et al. Yellow fever vaccine induces integrated multilineage and polyfunctional immune responses. The Journal of experimental medicine. 2008;205:3119–3131. doi: 10.1084/jem.20082292. [DOI] [PMC free article] [PubMed] [Google Scholar]
- 36.Obermoser G, et al. Systems scale interactive exploration reveals quantitative and qualitative differences in response to influenza and pneumococcal vaccines. Immunity. 2013;38:831–844. doi: 10.1016/j.immuni.2012.12.008. [DOI] [PMC free article] [PubMed] [Google Scholar]
- 37.Nakaya HI, et al. Systems biology of vaccination for seasonal influenza in humans. Nature immunology. 2011;12:786–795. doi: 10.1038/ni.2067. [DOI] [PMC free article] [PubMed] [Google Scholar]
- 38.Franco LM, et al. Integrative genomic analysis of the human immune response to influenza vaccination. eLife. 2013;2:e00299. doi: 10.7554/eLife.00299. [DOI] [PMC free article] [PubMed] [Google Scholar]
- 39.Querec TD, et al. Systems biology approach predicts immunogenicity of the yellow fever vaccine in humans. Nature immunology. 2009;10:116–125. doi: 10.1038/ni.1688. [DOI] [PMC free article] [PubMed] [Google Scholar]
- 40.Klechevsky E, et al. Functional specializations of human epidermal Langerhans cells and CD14+ dermal dendritic cells. Immunity. 2008;29:497–510. doi: 10.1016/j.immuni.2008.07.013. [DOI] [PMC free article] [PubMed] [Google Scholar]
- 41.Banchereau R, et al. Host immune transcriptional profiles reflect the variability in clinical disease manifestations in patients with Staphylococcus aureus infections. PloS one. 2012;7:e34390. doi: 10.1371/journal.pone.0034390. [DOI] [PMC free article] [PubMed] [Google Scholar]
- 42.Shen-Orr SS, et al. Cell type-specific gene expression differences in complex tissues. Nature methods. 2010;7:287–289. doi: 10.1038/nmeth.1439. [DOI] [PMC free article] [PubMed] [Google Scholar]
- 43.Chaussabel D, et al. A modular analysis framework for blood genomics studies: application to systemic lupus erythematosus. Immunity. 2008;29:150–164. doi: 10.1016/j.immuni.2008.05.012. [DOI] [PMC free article] [PubMed] [Google Scholar]
- 44.Ardura MI, et al. Enhanced monocyte response and decreased central memory T cells in children with invasive Staphylococcus aureus infections. PloS one. 2009;4:e5446. doi: 10.1371/journal.pone.0005446. [DOI] [PMC free article] [PubMed] [Google Scholar]
- 45.Mejias A, et al. Whole blood gene expression profiles to assess pathogenesis and disease severity in infants with respiratory syncytial virus infection. PLoS medicine. 2013;10:e1001549. doi: 10.1371/journal.pmed.1001549. [DOI] [PMC free article] [PubMed] [Google Scholar]
- 46.Pankla R, et al. Genomic transcriptional profiling identifies a candidate blood biomarker signature for the diagnosis of septicemic melioidosis. Genome biology. 2009;10:R127. doi: 10.1186/gb-2009-10-11-r127. [DOI] [PMC free article] [PubMed] [Google Scholar]
- 47.Caskey M, et al. Synthetic double-stranded RNA induces innate immune responses similar to a live viral vaccine in humans. The Journal of experimental medicine. 2011;208:2357–2366. doi: 10.1084/jem.20111171. [DOI] [PMC free article] [PubMed] [Google Scholar]
- 48.Li S, et al. Molecular signatures of antibody responses derived from a systems biology study of five human vaccines. Nature immunology. 2013 doi: 10.1038/ni.2789. [DOI] [PMC free article] [PubMed] [Google Scholar]
- 49.Schadt EE. Molecular networks as sensors and drivers of common human diseases. Nature. 2009;461:218–223. doi: 10.1038/nature08454. [DOI] [PubMed] [Google Scholar]
- 50.Krzywinski M, Birol I, Jones SJ, Marra MA. Hive plots--rational approach to visualizing networks. Briefings in bioinformatics. 2012;13:627–644. doi: 10.1093/bib/bbr069. [DOI] [PubMed] [Google Scholar]
- 51.Krzywinski M, et al. Circos: an information aesthetic for comparative genomics. Genome research. 2009;19:1639–1645. doi: 10.1101/gr.092759.109. [DOI] [PMC free article] [PubMed] [Google Scholar]
- 52.Aloy P, Russell RB. Taking the mystery out of biological networks. EMBO reports. 2004;5:349–350. doi: 10.1038/sj.embor.7400129. [DOI] [PMC free article] [PubMed] [Google Scholar]
- 53.Albert R, Jeong H, Barabasi AL. Error and attack tolerance of complex networks. Nature. 2000;406:378–382. doi: 10.1038/35019019. [DOI] [PubMed] [Google Scholar]
Associated Data
This section collects any data citations, data availability statements, or supplementary materials included in this article.
Supplementary Materials
iFigure 2 Mapping perturbations of the modular blood transcriptional repertoire associated with acute Staphylococcus aureus infection.
This is an interactive version of Figure 2. The proportion of transcripts in a given module passing a set cutoff and expressed as a percentage is represented as a spot on a grid. Red spots indicate an increase in transcript abundance relative to a given state. Interactive features include: a) the display of a pop up menu on hover of the mouse cursor over a spot, where the number and proportion of significant transcripts per module is indicated and links provided to access gene-level data and functional annotations for the module. b) under “Display Options” the user can toggle the view between “All Modules” (260 modules) and “Top Modules” (62 modules); and between “Spot chart” and “Pie chart”; a p-value slider gives user the ability to adjust the stringency of the analysis. c) under “Annotation Key” the user can toggle the view between full overlay of the color coded functional annotation key, partial view (show); or hiding the annotation key.
http://mat.benaroyaresearch.org:80/dm3/miniURL/view/IY
iFigure 3 Mapping perturbations of the modular blood transcriptional repertoire across individual subjects with acute Staphylococcus aureus infection. The proportion of transcripts in a given module passing a set cutoff is represented as a spot on a heatmap where each column represents a patient and each row a module. Red spots indicate an increase in transcript abundance relative to a given state. Interactive features include: a) the display of a pop up menu on hover of the mouse cursor over a spot, where the number and proportion of significant transcripts per module is indicated; b) the ability to toggle clustering of samples and modules on or off; c) under “Display Options” the ability to show all modules, top 62 or only annotated; to display results as a spot or as a pie chart; d) to filter modules based on a threshold activity value; d) to overlay associated clinical information on the heatmap, in the example provided disease severity is shown (information displayed on hover of the mouse cursor); more clinical variables are available and can be selected for display on the heatmap from the drop down menu).
http://www.interactivefigures.com:80/nri/miniURL/view/Ix
iFigure 4 Mapping perturbations of the modular blood transcriptional repertoire across independent studies. The proportion of transcripts in a given module passing a set cutoff is represented as a spot on a heatmap where each column represents a study and each row a module. Red spots indicate an increase in transcript abundance relative to a given state. Results from a total of 509 blood transcriptome profiles from 9 study groups derived from 5 independent studies are summarized. Interactive features of this plot include: a) the display of a pop up menu on hover of the mouse cursor over a spot, where the number and proportion of significant transcripts per module is indicated; b) the ability to toggle clustering of studies and modules on or off; c) under “Display Options” the ability to show all modules, top 62 or only annotated; to display results as a spot or as a pie chart; d) to filter modules based on a threshold activity value; d) under “legend” to display information associated with each study when clicking on the “I” information button).
http://www.interactivefigures.com/nri/analysis/metaCompare/2