Abstract
The objective of the current study is to develop a new cryomacroscope prototype for the study of vitrification in large-size specimens. The unique contribution in the current study is in developing a cryomacroscope setup as an add-on device to a commercial controlled-rate cooler and in demonstration of physical events in cryoprotective cocktails containing synthetic ice modulators (SIM)—compounds which hinder ice crystal growth. Cryopreservation by vitrification is a highly complex application, where the likelihood of crystallization, fracture formation, degradation of the biomaterial quality, and other physical events are dependent not only upon the instantaneous cryogenic conditions, but more significantly upon the evolution of conditions along the cryogenic protocol. Nevertheless, cryopreservation success is most frequently assessed by evaluating the cryopreserved product at its end states—either at the cryogenic storage temperature or room temperature. The cryomacroscope is the only available device for visualization of large-size specimens along the thermal protocol, in an effort to correlate the quality of the cryopreserved product with physical events. Compared with earlier cryomacroscope prototypes, the new Cryomacroscope-III evaluated here benefits from a higher resolution color camera, improved illumination, digital recording capabilities, and high repeatability in tested thermal conditions via a commercial controlled-rate cooler. A specialized software package was developed in the current study, having two modes of operation: (a) experimentation mode to control the operation of the camera, record camera frames sequentially, log thermal data from sensors, and save case-specific information; and (b) post-processing mode to generate a compact file integrating images, elapsed time, and thermal data for each experiment. The benefits of the Cryomacroscope-III are demonstrated using various tested mixtures of SIMs with the cryoprotective cocktail DP6, which were found effective in preventing ice growth, even at significantly subcritical cooling rates with reference to the pure DP6.
Keywords: Cryomacroscopy, Synthetic Ice Modulators, Vitrification, Crystallization, Thermal Stress, DP6
INTRODUCTION
Cryopreservation success is not merely dependent upon the instantaneous state of the material, but primarily on the evolution of events along the cryopreservation protocol. In engineering terminology, such a process is said to be path dependent. It is well established that the coupled phenomena during cryopreservation display a quite complex picture, with effects typically classified as resulting from the kinetics of ice crystallization, the harmful effect of ice-controlling agents (commonly refer to as cryoprotective agents or CPAs), the formation of thermo-mechanical stress, and the degradation of biological functionality in a suspended state.
The rate and mode of ice formation is not only dependent upon the temperature and cooling rate, but also upon the presence of nucleation sources and the extent of previously formed ice in the medium [14,33], making the kinetics of ice formation path dependent. In the unstable process of cryopreservation by vitrification (i.e., glass formation), the potential for crystal formation is time-dependent at any given temperature [35]. Even when the specimen is cooled fast enough to avoid crystallization, devitrification (rewarming-phase ice nucleation) or recrystallization (ice growth from ice crystals formed during cooling) may occur when the specimen is rewarmed from cryogenic storage [10,11].
In classical cryopreservation (i.e., preservation using low CPA concentrations), pure water ice crystals form first, elevating the concentration of the remaining solution, which couple toxicity effects with ice formation [5,12]. In vitrification, the concentration of CPA cocktails necessary to suppress crystallization is typically high, which elevates the toxicity potential. The toxicity potential decreases with decreasing temperature, which led to the development of several strategies of gradually introducing CPA during cooling, and gradually washing out CPA during rewarming [3,20,30]. These strategies couple heat transfer, kinetics of CPA permeation, and toxicity.
The formation of thermo-mechanical stress in crystallization processes is dictated by the temperature gradient, phase-transition effects at the freezing front, and the nature of the problem [25]; for example, inward [22] versus outward [23] freezing. The evolution of thermo-mechanical stress history during cooling often leads to a mechanically stressed specimen at the cryogenic storage temperature—commonly referred to as a residual stress [19,37]. In a glass forming material, additional thermo-mechanical stress may be associated with effects of glass transition and structural relaxation, both dependent upon the specific thermal history [9,16,19].
Investigation of the above path-dependent effects has been performed by microcopy means since the dawn of modern cryobiology. For example, Luyet and Rapatz proposed a cooling stage for cryomicroscopy studies [18] and an apparatus to rapidly photograph physical events during freezing [27]. As another example, Diller and Cravalho [7] proposed a cryomicroscope capable of effecting controlled freezing and thawing in biological cell suspensions, which also integrated a high-speed camera. While the use of cryomicroscopy means is invaluable, many of the physical phenomena listed above do not scale well from the thin-film specimens in microscopy to larger- size specimens synonymous with practical scale bio-specimens. The latter characterized by small surface-to-volume ratio, inhomogeneity, and distributed parameters such as temperature, cooling and rewarming rates, stress, and concentration. Despite the state of knowledge in cryopreservation and in the absence of better investigation tools, the outcome of cryopreservation of large specimens is frequently correlated with either end-state conditions, or with global cooling parameters, such as the average cooling rate, the average rewarming rate, and storage time.
Consistent with the global needs to develop cryopreservation means for large specimens, the current research team has developed a visualization device, known as the Cryomacroscope [24]. The first generation of this device, which is referred to as Type I for brevity of description, was designed to mimic a standard cooling protocol in a vial inserted into a control-rate cooler [24]. This device used a video camera, a borescope to observe the specimen in situ, a liquid nitrogen container and a set of thermal sleeves for passive cooling-rate control, and a hot water bath for passive rewarming-rate control. The Type I cryomacroscope has been used extensively to study effects of crystallization and thermo-mechanical stress [28], to correlate functional recovery of blood vessels with physical events [2], and to explore marginal cooling rates that facilitate cryopreservation via vitrification [3].
A Type II cryomacroscope was later developed to investigate effects of thermo-mechanical stress in thin films [26]. Temperature control in Type II has been achieved with a tailored liquid-nitrogen cooling stage. In conjunction with parallel efforts to measure mechanical properties in vitrified materials [17,21], results obtained by Type II were used to infer the strength of selected vitrified CPAs and their yield strain.
A new cryomacroscope device (Cryomacroscope-III) is proposed in the current study, with the objectives of improved thermal control and events-recording capabilities. The new cryomacroscope is designed as an add-on device, compatible with commercially available controlled-rate coolers. The new cryomacroscope is demonstrated by use of the cryoprotective cocktail DP6 when combined with selected synthetic ice modulators (SIMs) [8,9]. The general classification of SIMs includes molecules that modulate ice nucleation and growth, or possess properties of stabilizing the amorphous state, by virtue of their chemical structure and at concentrations that are not explained on a purely colligative basis.
EXPERIMENTAL APPARTUS
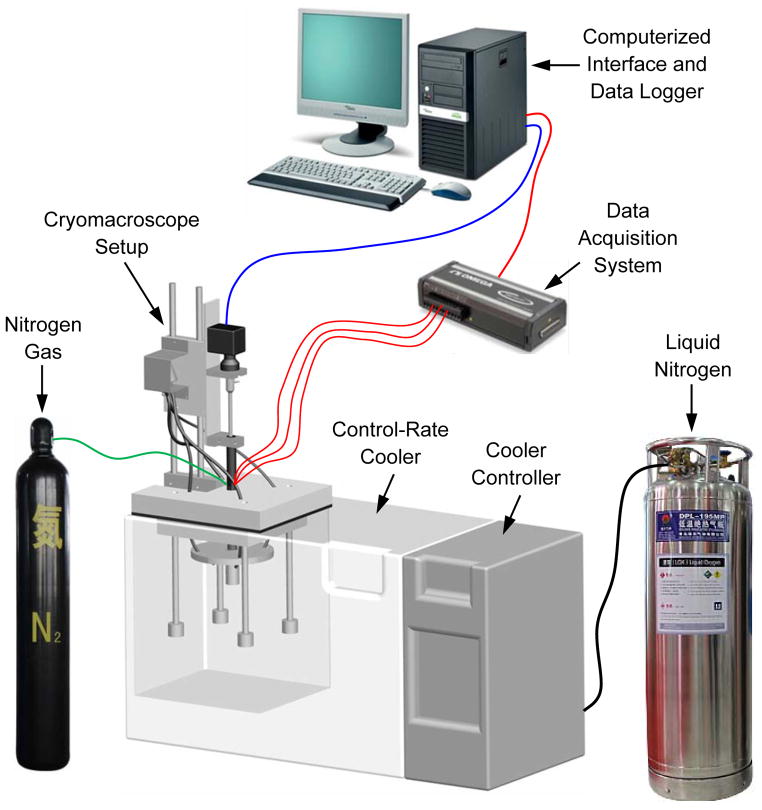
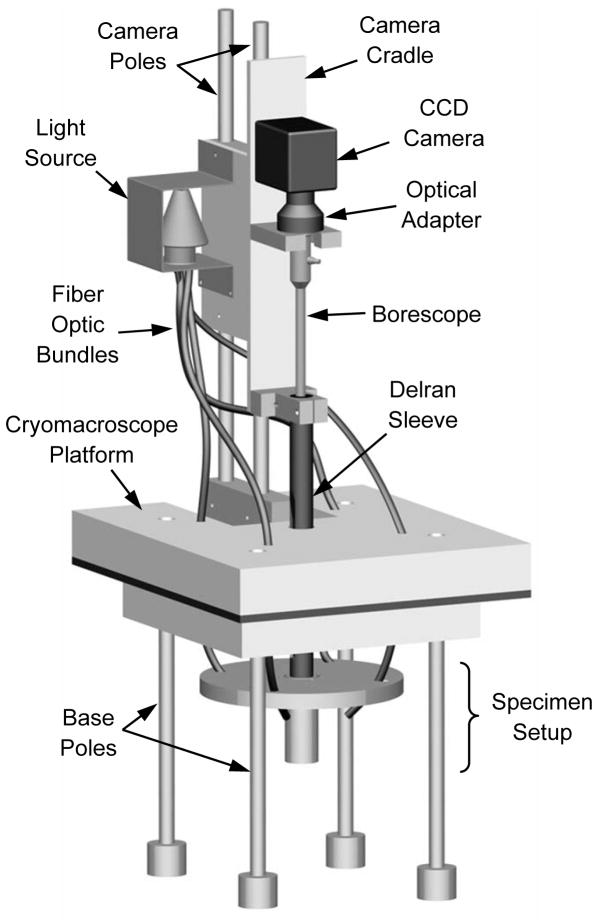
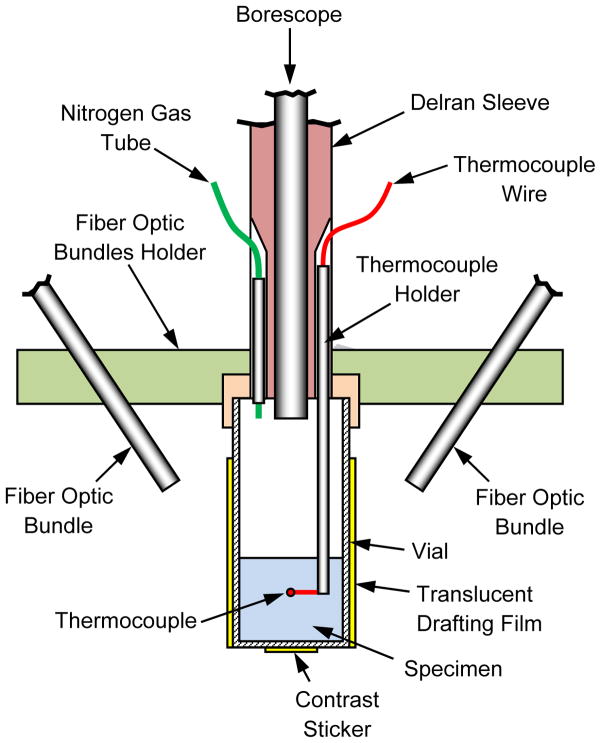
Figure 1 displays a schematic illustration of the Cryomacroscope-III setup and peripheral equipment, Fig. 2 displays the components of the cryomacroscope setup, and Fig. 3 displays a cross section of the specimen setup. The main functions of the Cryomacroscope-III system are: imaging, illumination, and temperature sensing, while the specimen is exposed to the cryopreservation protocol in the cooling chamber. For this application, a special computer code has been developed to control the cryomacroscope functionality, and to create an integrated electronic documentation of the experiment.
Figure 1.
Schematic illustration of the cryomacroscope setup replacing the standard lid of a controlled-rate cooler (Planer, Kryo 16-10).
Figure 2.
Schematic illustration of the cryomacroscope setup
Figure 3.
Schematic illustration of the specimen setup
Temperature control
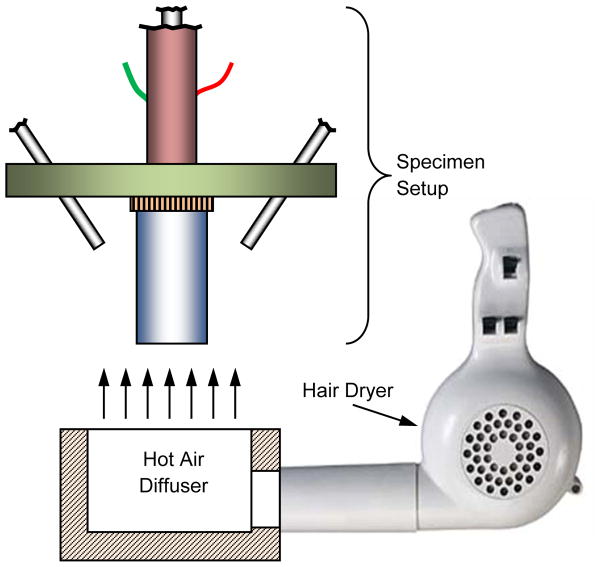
The Cryomacroscope-III platform (Fig. 2) is designed as a replacement to the commercially available lid of the control-rate cooler Kryo 10–16, controlled with Kryo 10–20 (Planer PLC, UK). While this particular set of cooling chamber and controller were selected as a choice of practice, the newly developed cryomacroscope can be fitted with very little modifications to any commercially available, top-loaded cooling chamber. Kryo 10–16 is a liquid nitrogen-based cooler, circulating nitrogen vapors at high flow rates across the cooling chamber. Kryo 10–20 enables multiple temperature ramps with a maximum cooling rate of 50°C/min, minimum temperature of −180°C, and maximum rewarming rate of 10°C/min. Unfortunately, the achievable warming rate with the Kryo10–16 may not be sufficient to prevent rewarming-phase crystallization in many vitrification protocols. Figure 4 displays an alternative and a more powerful rewarming setup that has been used in some experiments, based on blown hot air from a hair dryer (Revlon 1875; model RV473, 1875 watts), directed with a tailored air diffuser. In such an application, the entire macroscope setup was removed (lifted) from the cooling chamber and positioned above while being supported by the adjustable base poles (Fig. 2) the air diffuser at the onset of rapid rewarming.
Figure 4.
Schematic illustration of the convective heating setup
Image display and recording
Imaging was achieved with a three-link system, comprising an external EXView HAD CCD camera (Grasshopper, Point Grey Research, Inc., BC, Canada), an optical coupler (Luxxor 35 mm FL, Gradient Lens Corporation, Inc., NY, USA), and a borescope (Hawkeye HH2992, Gradient Lens Corporation, Inc., NY, USA). The borescope enables visualization of the specimen in situ, while maintaining the camera at room temperature. The camera is controlled by the 3rd party CMU 1394 Digital Camera Driver in MATLAB. The imaging data is streamlined to a computer via a FireWire connection (800 Mbs IEEE1394B) for real-time processing and recording. The functionality of the camera and data streamlining are controlled via a cryomacroscope control code—an in-house written software package.
Cryomacroscope Control Code (C3)
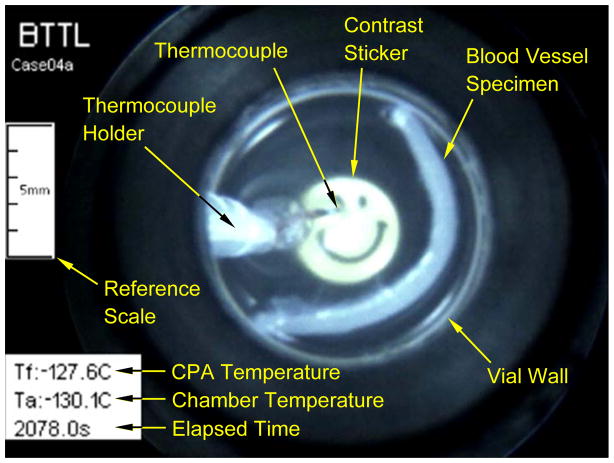
With reference to Fig. 5, two alternative graphic-user interfaces (GUIs) control C3 for experimental control and post processing. The experimentation GUI is used to initialize the CCD camera parameters, streamline captured images to the computer screen, record the sequence of captured images on the computer hard drive, initialize the data acquisition system, display measured temperatures in real time, record temperature data on the hard drive, and create a data log of the experiment. C3 does not control the cooling chamber operation, which is achieved via the integrated control panel of the Kryo 10–20 system. Hence, cooling chamber control and cryomacroscope control are two parallel and independent processes. The post-processing GUI displayed in Fig. 5 is used to create a unified electronic log of an experiment, with a representative frame of the overlaid movie displayed in Fig. 6 as an example.
Figure 5.
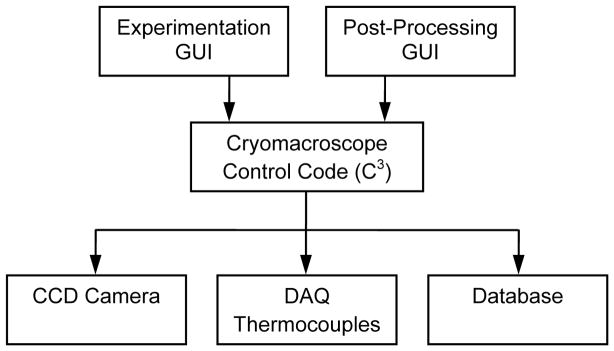
Schematic illustration of the cryomacroscope control code
Figure 6.
A representative frame from a post-processed movie: a vitrified blood vessel in a cocktail of DP6 and 6% 2,3 Butanediol in Euro Collins (DP6+2,3BD/EC, Table 1). The contrast sticker is affixed to the bottom of the vial. CPA temperature refers to the volumetric center of the sample.
Illumination
Since the illumination intensity of any light bulb decays exponentially with the decreasing temperature, light is directed via four fiber-optic bundles (50 individual 0.75 mm in diameter; Endglow Fiber Cables, Fiber Optic Products, Inc., CA, USA), from a single external LED source (12V, 5W, 6000K; Photon-Lite, Fiber Optic Products, Inc., CA, USA). A special fiber optic bundle holder in the shape of a disk is displayed in Figs. 2–3, which directs the light in 45° angle onto the specimen. This setup distributes the light adequately, while preventing reflections back to the camera. In some experiments, the vial was wrapped with a thin sheet of translucent drafting film, further diffusing the light delivered by the fiber-optic bundles.
Temperature sensing
Temperature measurements are obtained by type T thermocouples (copper-constantan wires): one immersed into the sample and the other placed at the free stream inside the cooling chamber. For the immersed thermocouple, a special plastic-holding tube was designed, with the thermocouple junction extending into the specimen (Fig. 3 and 6). The thermocouple junction can be elevated as needed, according to the volume of CPA and specific experimental investigation. This is not the control parameter for the cooling chamber controller, which has a dedicated temperature sensor measuring the stream of air and nitrogen vapor forced through the chamber. Thermocouple measurements are displayed and recorded using a data acquisition system (OMB-DAQ-56, Omega Engineering, Inc., controlled by DaqView™). The data acquisition system is activated by C3, displays temperature reading in real time, and its recorded data file is used by C3 during post processing.
MATERIALS AMD METHODS
The objective of the current study is three-fold: to demonstrate the Cryomacroscope-III as a new visualization tool, to explore its capabilities, and to perform an initial investigation to the application of SIMs—a largely unexplored application in cryopreservation.
CPA and SIM cocktails
In line with parallel studies to further characterize the physical effects, notably thermophysical parameters such as thermal expansion and stress associated with cryopreservation by vitrification, this study focused on the CPA cocktail DP6 with and without selected SIMs. Specifically, 1,3 cyclohexanediol (1,3CHD), 1,4 cyclohexanediol (1,4-CHD), 2,3 butanediol (2,3 BD) and polyethyleneglycol-400 (PEG400) were selected as SIM additives to DP6 in accordance with the rationale outlined previously [8,9]. In this way, the present study was designed to use the newly developed Cryomacroscope-III to visualize thermophysical events in the same CPA-SIM cocktails used recently to measure thermal expansion in vitrified blood vessels [8,9]. Table 1 catalogues the test solutions used for Cryomacroscope-III evaluation in the current study.
Table 1.
Summary of experimental runs on DP6 solutions
| Designation | CPA | Concentration Ratio of DP6 | SIM | Vehicle Solution | Test | |
|---|---|---|---|---|---|---|
| 1 ml | 10 ml | |||||
| DP6+13CHD/EC | DP6 | 1.0 | 6% 1,3 CHD | EC | 3 | 1 |
| DP6+14CHD/EC | DP6 | 1.0 | 6% 1,4 CHD | EC | 3 | - |
| DP6+23BD/EC | DP6 | 1.0 | 6% 2,3 BD | EC | 3 | - |
| DP6+PEG400/EC | DP6 | 1.0 | 12% PEG-400 | EC | 4 | 1 |
| DP6/UHK-CV | DP6 | 1.0 | - | Unisol-CV | - | 1 |
| DP6/H2O | DP6 | 1.0 | - | H2O | 2 | - |
| 1.25×DP6/EC | DP7.5 | 1.25 | - | EC | 2 | 3 |
| 1.25×DP6/ H2O+HEPES | DP7.5 | 1.25 | - | H2O+HEPES | - | 2 |
| 1.25×DP6/ H2O | DP7.5 | 1.25 | - | H2O | - | 1 |
| 1.25×DP6/PBS | DP7.5 | 1.25 | - | PBS | - | 1 |
| 1.25×DP6/UHK-CV | DP7.5 | 1.25 | - | Unisol-CV | - | 2 |
| DP6+13CHD/ H2O | DP6 | 1.0 | 6% 1,3 CHD | H2O | 2 | - |
| DP6+14CHD/ H2O | DP6 | 1.0 | 6% 1,4 CHD | H2O | 2 | - |
| DP6+23BD/ H2O | DP6 | 1.0 | 6% 2,3 BD | H2O | 2 | - |
| DP6+PEG400/ H2O | DP6 | 1.0 | 12% PEG-400 | H2O | 2 | - |
Cryomacroscopy protocol
Samples (1 or 10ml) of the solutions listed in Table 1 were placed in a glass scintillation vial (Fisher-Wheaton-180 borosilicate, 20 ml), which was screwed onto the specimen holder of the Cryomacroscope-III, as illustrated in Fig 3. A sleeve, fabricated from translucent drafting film, was placed snuggly over the glass vial to help diffuse the fiber-optic light source and prevent high-glare spots. In addition, the paper sleeve incorporated a black paper disc on the inside base with a central adhesive foil contrast sticker that was clearly visible through the base of the vial. The contrast sticker (“smiley face” in Fig. 6) provided an important reference point for judging the clarity, transparency, and other events in the sample throughout the cooling and rewarming protocol.
Prior to commencement of the cooling protocol, the space above the sample in the specimen vial was purged with gaseous nitrogen via the supply tube depicted in Fig 3. This was an important step to minimize or eliminate artifacts due to moisture condensation on the lens of the borescope and/or the surface of the sample. At this stage, the position of the thermocouple was adjusted by sliding the thermocouple holder in the Delran support sleeve until the thermocouple tip was positioned at the desired temperature reference point in the sample. Before installing the Cryomacroscope-III device into the cooling chamber of the programmed-cooler (Kryo 16-10), the controlled-rate cooler was activated and primed for a start temperature of 4°C to match the pre-cooled temperature of the test samples.
The Kryo 16-10 cooler was programmed to provide two different thermal histories: (a) a cooling ramp of 5°C/min from 4°C to −130°C, a 10 min hold time at −130°C to allow sample equilibration with the chamber, a rewarming rate of 5°C/min to −100°C, and final rapid rewarming with heated air to room temperature; and, (b) a cooling ramp of 50°C/min from 4°C to −100°C, a cooling ramp of 3°C to −150°C, a 10 min hold time at −150°C, a rewarming rate of 3°C/min to −100°C, and final rapid rewarming with heated air to room temperature. The first protocol was selected with marginal rates to investigate vitrification using SIMs in DP6 based on previous studies [3,8]. The second protocol was selected to demonstrate effects brought about by the size of the sample—temperature gradients and fracture formation. In order to effect fast warming from −100°C, the Cryomacroscope-III was removed from the Kryo 16-10 chamber and placed on the bench above the convective heating setup illustrated in Fig 4. This provided a heating rate of about 60°C/min (see Fig. 7), which is much higher than the maximum heating rate attainable using the programmed Kryo 16-10 machine. For maximum heating, the turbo setting on the max air blow setting of the hair dryer was used until the sample temperature reached +15°C, whereupon the cooling/warming protocol was terminated. During cooling, nitrogen gas purging of the sample was terminated between −20°C and −40°C to avoid the heating effect of the N2-gas supply at lower temperatures, as illustrated in Fig 7.
Figure 7.
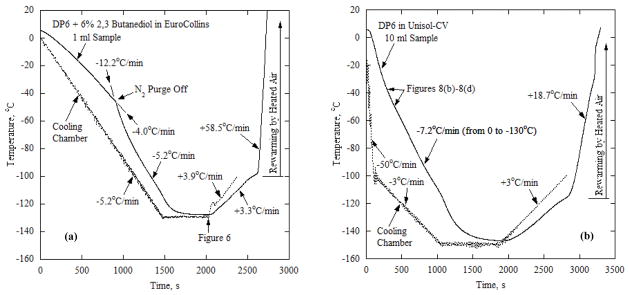
Typical thermal histories: (a) in a 1 ml DP6+23BD/EC containing a blood vessel segment, where the post-processed image in Fig. 6 is taken at the point of minimum specimen temperature (2078 s); and (b) in a 10 ml DP6/UHK-CV, where representative post-processed images are displayed in Fig. 8. The thermal history is virtually independent of the presence of SIM, where the gradual crystallization effect displayed in Fig. 8 left no measureable mark on the recorded thermal history.
RESULTS AND DISCUSSION
The objective of the current study is to present a new cryomacroscope (Type III), explore its capabilities, and potentially identify physical effects associated with vitrification and SIM. For these purposes, an exploratory experimental investigation has been conducted, including a variety of case studies based upon variants of the baseline CPA mixture, DP6, with added SIM to promote amorphous solidification and stability, as listed in Table 1. In addition, various vehicle solutions were investigated for their effects on visualization. In general, Table 1 summarizes experiments on two volume sizes—1 ml and 10 ml, where the 1 ml sample is consistent with previous studies focusing on heat transfer, solid mechanics, crystallization, fracture formation, and functional recovery of cryopreserved blood vessels [2,3,24,28]. The 10 ml samples represent the first step in scaling up our cryomacroscopy investigation.
Figure 7 displays the thermal history for representative experiments on 1 ml and 10 ml samples. Regardless of the specific combination of DP6 with SIMs, the thermal history is primarily a function of the sample volume. Figure 7(a) displays the thermal history for DP6+2,3BD/EC (Table 1) for example, where the recorded image of the sample at the minimum temperature is displayed in Fig. 6. The heating effect of the purged nitrogen gas can be clearly seen from Fig. 7(a) (indicated by a labeled arrow). In the absence of nitrogen gas purging, the cooling rate of the 1 ml sample closely follows the chamber cooling rate for cooling rates slower than 15°C/min. While this cooling rate may be considered low (subcritical) for DP6 vitrification, it is well within the applicable range for DP6-SIM combinations as demonstrated below, as well as within the applicable range for higher concentration CPAs, such as VS55 [2,3,24]. The convective heating effect during the rewarming phase of the protocol can further be seen in Fig. 7(a), leading to the high rates needed to prevent rewarming-phase crystallization [24].
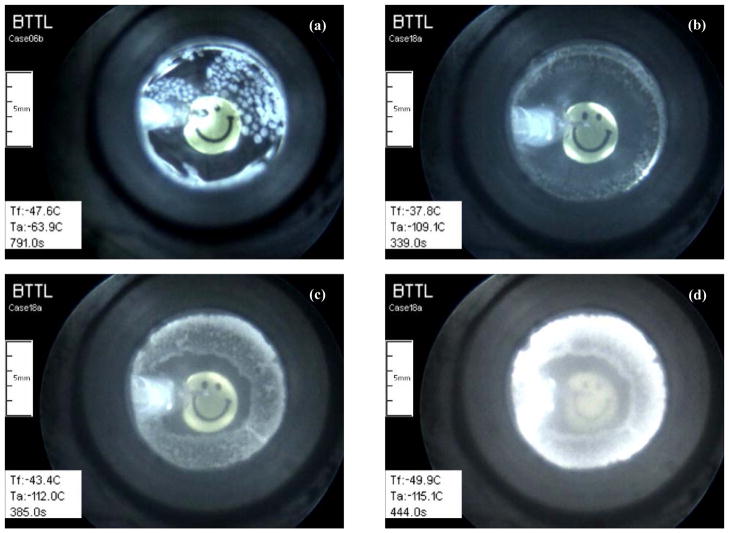
Figure 7(b) displays the thermal history in DP6 in the absence of SIM. A much higher initial cooling rate was applied in that experiment, with an initial value of 50°C/min (maximum achievable with the cooling chamber) down to −100°C, followed by 3°C/min down to a storage temperature of −150°C. The slower cooling rate below −100°C is common practice in effort to avoid fracturing [2,3,20]. Nevertheless, temperature readings from the center of the 10 ml sample (Fig. 7(b)) indicate an average cooling rate of 7.2°C/min along most of the cooling process, which is the result of the thermal mass of the sample (i.e., the product of volumetric specific heat and volume of the sample). Such a low cooling rate is insufficient to prevent crystallization in DP6 as displayed in the corresponding images in Fig. 8, which signifies the need for SIM in larger samples. By comparison with other experiments on 10 ml samples, the crystallization effect left no noticeable signature on the recorded thermal history, which may be attributed to the gradual crystallization effect and/or unquantified partial crystallization. Note that the observation of crystallization and its accompanying opacity effect are not indications of the extent of crystallization (i.e., the volume fraction of crystals in a partly vitrified material), but only that enough crystals significantly refracted light.
Figure 8.
Snapshots of a crystallization process during cooling in (a) a 1 ml sample of DP6/H2O, and (b)– (d) a 10 ml sample of DP6/UHK-CV, where the sample becomes completely opaque at a center temperature of −63.3°C.
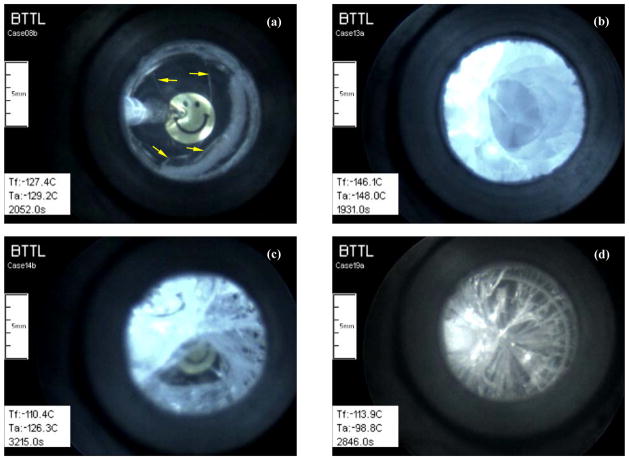
Crystallization is not the only potentially devastating effects in large-size vitrification, where steep temperature gradient may give rise to mechanical stress, potentially leading to the fractures displayed in Fig. 9. In a small-volume specimen, the fracturing effect may be the result of thermal expansion mismatch between the CPA cocktail and the vial wall [26,28]. While the wall effect may diminish in large specimens, the temperature gradients within the specimen may now play a key role in mechanically loading the specimen [29]. In Fig. 7(b) for example, a temperature difference of more than 60°C is evident between the center of the specimen and the vial wall at 500 s. Such a temperature difference along a vial radius of about 10 mm, represents a dramatic gradient greater than 6°C/mm.
Figure 9.
Examples of various fracturing patterns: (a) isolated fractures (pointed by yellow arrows) in a 1 ml DP6+1,4CHD/ H2O sample containing a blood vessel segment at a storage temperature of −129°C (10°C below Tg of −119°C); (b) circumferential fractures in a 10 ml 1.25×DP6/ H2O sample at a storage temperature of −148.0°C; (c) fracturing in a 10 ml 1.25×DP6/ H2O+HEPES sample during cooling when the center of the sample is about 9°C above Tg while the surface is below Tg; and (d) radial fractures in a 10 ml 1.25×DP6/UHK-CV sample at −113.9°C, at a rewarming phase from a storage temperature of −146°C. Tf is the temperature at the volumetric center of the sample.
Figure 9 displays three different fracturing patterns in the sample: isolated fractures in a thin sample (Fig. 9(a)), which may or may not affect the structural integrity of the cryopreserved specimen, and intense fracturing in larger sample volumes (Figs. 9(b)– (d)), either circumferential or radial in nature, which are likely to devastate any specimen immersed in the vitrified material. It is possible to tailor a cooling protocol to prevent fracture formation by slowing down the cooling rate in the vicinity of glass transition, with the objective of facilitating structural relaxation [9]. However, the objective of the current study is not to prevent fracture formation but to demonstrate the capability of identifying physical events—such as fracture formation—with the new experimental setup.
While thermal expansion drives thermo-mechanical stress, potentially leading to fracture, in combination with surface tension it may also deform the free surface of the glass-forming material [13]. This deformed surface—the surface through which visualization is achieved—may result in a “magnifying glass” effect in larger samples, where the accumulated effect of contraction becomes significant. While this effect has been observed in the current study, distorting the image of the contrast sticker, methods to account for this effect are still at the developmental stage.
Solute precipitation is also a possibility that must be considered if the solubility products of the solutes comprising the CPA vehicle solution are exceeded during cooling. Formation of gas emboli by loss of solubility during cooling has long been known to produce white opacity in ice cubes [38]. In sharp contrast at the microscopic level, both ice crystallization and gas emboli have been proposed as the root cause of “blackening” or “darkening” of the intracellular compartment of individual cells observed by cryomicroscopy during cooling. This so-called “flashing” has conventionally been adopted as the definitive sign of intracellular freezing [1,15,34] and is clearly associated with a change of refractive index in the cytosol due to a physical change of state. These well documented phenomena are associated with events at the microscopic (sub-cellular) level and do not necessarily translate to the physical events now observed at the macroscopic level using the Cryomacroscope-III device.
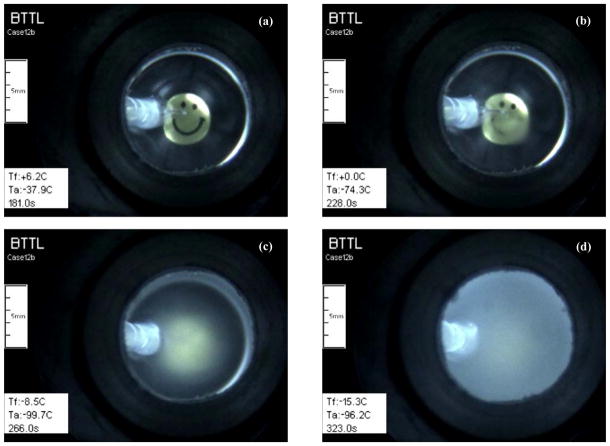
The new device reveals phenomena that needed further characterization to determine whether they are sample- or device-related events. For example, clouding and opacity in some samples (Fig. 10) required further investigation to determine their sources. Conceivable sources of cloudiness include ice crystallization, solute precipitation and gas emboli in the sample, or possibly moisture condensation on the borescope lens. Ice crystallization is clearly discernible from the latter two events because ice nuclei are variable in size and shape at the macroscopic level and they grow and coalesce as temperature changes, as illustrated in Fig. 8.
Figure 10.
Examples of precipitation effect during cooling in a 10 ml 1.25×DP6/EC sample: (a) the sample is clear when its center is at 6.2°C; (b) a “cloudy” region extends from the thermocouple downwards when it displays 0°C; (c) the sample becomes more hazy as the temperature decreases to −8.5°C at its center; and, (d) becomes completely opaque at lower temperatures. Note that the plastic holder of the thermocouple (left side of the image) is observed with good contrast, indicating that the displayed artifact is within the sample and not in the gas phase above it.
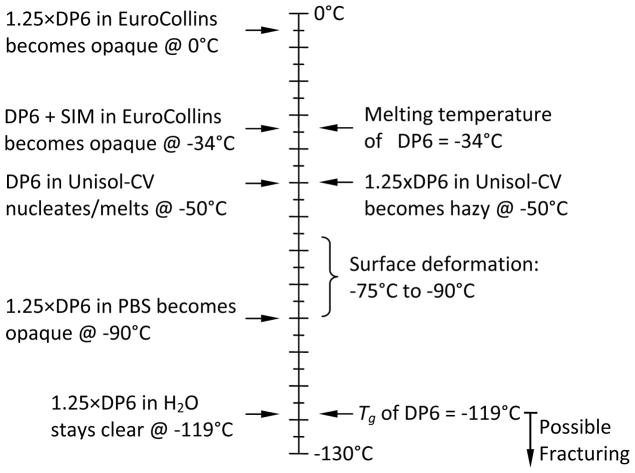
The alternative milky clouding of samples, even in wholly vitrified samples without apparent ice nucleation, can be attributed to solute precipitation due to the solubility product of the component salts being exceeded during cooling in the organic CPA mixtures. This possibility was investigated empirically by testing the effect of different solute combinations in the CPA vehicle solution, as listed in Table 1. The rationale for the design of these solutions was based upon adjustments to the baseline composition by eliminating components that were considered to be possible candidates for solute precipitation during cooling. Initially, it was considered that the SIM additives might precipitate and this was tested using 1 and 10ml samples of media without SIMs. To compensate for the reduced crystallization-suppression components due to omission of the SIMs, the total CPA concentration was increased from 6 Molar to 7.5M (designated 1.25×DP6). With Fig. 10 as an example, it was observed that the modified solution 1.25×DP6/EC became opaque around the thermocouple junction at 0°C. Since omitting the SIM did not prevent the opacity, the next step was to examine the effect of the vehicle solution solutes. To this end, Table 1 shows that samples of DP6+SIM or 1.25×DP6 without SIMs were prepared in EC, Unisol-CV, phosphate-buffered saline (PBS), or water (no additional solutes). EC and Unisol-CV are complex hypertonic CPA-vehicle solutions established for vitrification and cryopreservation [4,31,32], and PBS is a simple isotonic salt solution. As displayed in Fig. 10, opacity ascribed to solute precipitation was observed in both EC and Unisol-CV solutions, but occurred at different temperatures, presumably reflecting the different chemical composition of the vehicle solutions [31]. Using the simple salt PBS solution, opacity was suppressed until the temperature was reduced to −90°C. Avoiding solutes altogether by cooling 1.25×DP6 in water provided clear samples down to −119°C—glass transition of DP6, below which the sample may fracture.
In summary, visual cloudiness observed during the cooling of DP6 vitrification solutions was exacerbated during scale-up from 1 to 10 ml samples but could be avoided by removing crystalloid solutes from the system. The opacity was distinct from ice nucleation and growth and appeared to be fully reversible upon rewarming. The presence of salts and their apparent precipitation during cooling impacts the cryomacroscope image but not the observation of other important physical events such as ice nucleation, fracturing, melting and surface deformation during cooling. Finally, it is concluded on the basis of these preliminary empirical observations that reversible solute precipitation during cooling of cryopreservation samples, particularly high concentration vitrification samples, may be a common phenomenon that goes unnoticed under conventional circumstances when samples are only examined visually at the beginning and end of the cooling/rewarming protocol.
Figure 11 summarizes the key physical events identified using the Cryomacroscope-III including, nucleation, vitrification, surface deformation from thermal contraction, fracturing and melting. It is generally assumed that a vitrified glassy specimen will remain clear and transparent throughout the cooling and warming protocol unless the transparency is disturbed by a physical event such as ice crystal nucleation, formation of gas emboli [6,36], or solute precipitation. For example, Fig. 8 displays the white opaque regions that define ice formation and growth, while Fig. 9(b) displays the opacity associated with fracture formation in the vitrified samples. In contrast, the vitrified domains remain clear and transparent permitting clear image of the contrast sticker affixed to the exterior of the base of the glass specimen vial.
Figure 11.
Summary of physical effects observed with the Cryomacroscope-III in the current study
Finally, the current study represents a collaborated effort, where all experiments were performed in our lab in North Charleston, South Carolina, post processing was performed in our lab in Pittsburgh, Pennsylvania, and experimental analyses developed as an integrated effort. Experimental data and post-processed movies were transferred via commercial data sharing services online. While the generated data from each experiment may reach an overall volume of up to 8 Gb, the post-processed movie of the entire experiment typically ranges from 10 Mb (low quality, web applications) to 150 Mb (highest quality), which makes data sharing and dissemination of information efficient.
CONCLUSIONS
The objective of the current study is to present a new cryomacroscope (Type III), to explore its capabilities, and demonstrate physical effects associated with vitrification of the CPA cocktail DP6 combined with SIMs. Compared with earlier cryomacroscope prototypes, Cryomacroscope-III benefits from a higher resolution color camera, improved illumination, digital recording capabilities, high repeatability in tested thermal conditions via a commercial controlled-rate cooler, and a tailored software package to control the operation of the cryomacroscope, log experimental data, and generate a single, post-processed, compact electronic file for every individual experiment.
This study includes vitrification experiments on two volume sizes: 1 ml—consistent with previous studies focusing on heat transfer, solid mechanics, crystallization, fracture formation, and functional recovery of cryopreserved blood vessels, and 10 ml—representing the first step in scaling up our cryomacroscopy investigation. While the thermal history in the 1 ml sample can follow the imposed thermal protocol in the cooling chamber of the commercial cooling system, the thermal history at the center of a 10 ml sample may deviate significantly, which defines the 10 ml sample as a “large” size from thermal considerations. Nevertheless, the various tested mixtures of SIMs with DP6 were found effective in preventing ice growth, even at significantly subcritical cooling rates with reference to the pure DP6.
Visualization effects in this study include crystallization, fracturing, and precipitation of solutes, all of which may affect the quality of visual inspection of the cryopreserved product. While blood vessel segments were used in selected experiments to test visualization qualities with the new prototype device, viability or functionality experiments were not included in the current study and are the subject matter of an ongoing parallel effort.
Acknowledgments
This project has been supported by Award Number R21EB011751 from the National Institute of Biomedical Imaging and Bioengineering (NIBIB), Award Number R21RR026210 from the National Center for Research Resources (NCRR), and Award Number R21GM103407 from the National Institute of General Medical Sciences (NIGMS). The content is solely the responsibility of the authors and does not necessarily represent the official views of the National Institutes of Health.
Footnotes
Publisher's Disclaimer: This is a PDF file of an unedited manuscript that has been accepted for publication. As a service to our customers we are providing this early version of the manuscript. The manuscript will undergo copyediting, typesetting, and review of the resulting proof before it is published in its final citable form. Please note that during the production process errors may be discovered which could affect the content, and all legal disclaimers that apply to the journal pertain.
References
- 1.Acharya T, Devreddy RV. Cryomicroscopic investigations of freezing processes in cell suspensions. The Open Biotechnology Journal. 2010;4:26–35. [Google Scholar]
- 2.Baicu S, Taylor MJ, Chen Z, Rabin Y. Vitrification of carotid artery segments: An integrated study of thermophysical events and functional recovery towards scale-up for clinical applications. Cell Preservation Technology. 2006;4(4):236–244. doi: 10.1089/cpt.2006.9994. [DOI] [PMC free article] [PubMed] [Google Scholar]
- 3.Baicu S, Taylor MJ, Chen Z, Rabin Y. Cryopreservation of carotid artery segments via vitrification subject to marginal thermal conditions: Correlation of freezing visualization with functional recovery. Cryobiology. 2008;58:1–8. doi: 10.1016/j.cryobiol.2008.03.002. [DOI] [PMC free article] [PubMed] [Google Scholar]
- 4.Brockbank KG, Taylor MJ. Tissue preservation. In: Baust JG, Baust JM, editors. Advances in Biopreservation. Boca Raton: CRC Press; 2007. pp. 157–196. [Google Scholar]
- 5.Campbell LH, Rutledge RN, Taylor MJ, Brockbank KGM. Evaluation of the relative cytotoxicity of the components of a vitrification solution in a variety of cardiovascular cells. Cryobiology. 1999;39(4):362. [Google Scholar]
- 6.Chan KS, Yang W. Survey of literature related to the problems of gas embolism in human body. J Biomech. 1969;2:299–312. doi: 10.1016/0021-9290(69)90086-4. [DOI] [PubMed] [Google Scholar]
- 7.Diller KR, Cravalho EG. A cryomicroscope for the study of freezing and thawing processes in biological cells. Cryobiology. 1971;7(4–6):191–199. doi: 10.1016/0011-2240(70)90021-0. [DOI] [PubMed] [Google Scholar]
- 8.Eisenberg DP, Taylor MJ, Rabin Y. Thermal expansion of DP6 combined with synthetic ice modulators in presence and absence of biological tissues. Cryobiology. 2012;65(2):117–125. doi: 10.1016/j.cryobiol.2012.04.011. [DOI] [PMC free article] [PubMed] [Google Scholar]
- 9.Eisenberg DP, Taylor MJ, Jimenez-Rios JL, Rabin Y. Thermal expansion of vitrified blood vessels permeated with DP6 and synthetic ice modulators. Cryobiology. 2014;68(3):318–326. doi: 10.1016/j.cryobiol.2014.04.010. [DOI] [PMC free article] [PubMed] [Google Scholar]
- 10.Fahy GM. Biological effects of vitrification and devitrification. In: Pegg DE, Karow AM Jr, editors. Biophysics of Organ Cryopreservation. Plenum; New York: 1987. pp. 265–297. [Google Scholar]
- 11.Fahy GM, Levy D, Ali SE. Some emerging principles underlying the physical properties, biological actions, and utility of vitrification solutions. Cryobiology. 1987;24:196–213. doi: 10.1016/0011-2240(87)90023-x. [DOI] [PubMed] [Google Scholar]
- 12.Fahy GM, da Mouta C, Tsonev L, Khirabadi BS, Mehl P, Meryman HT. Cellular injury associated with organ cryopreservation: Chemical toxicity and cooling injury. In: Lemasters JJ, Constance O, editors. Cell Biology of Trauma. CRC Press; 1995. [Google Scholar]
- 13.Feig JSG, Williams AC, Lin CC, Rabin Y. Developing the cryomacroscope for cryopreservation applications. 38th Annual Northeast Bioengineering Conference; Philadelphia, PA. March 16–18, 2012. [Google Scholar]
- 14.Fletcher NH. The Chemical Physics of Ice. New York: Cambridge University Press; 1970. [Google Scholar]
- 15.Grout BWW. The effects of ice formation during cryopreservation of clinical systems. In: Fuller BJ, Grout BWW, editors. Clinical Applications of Cryobiology. Boca Raton: CRC Press; 1991. pp. 81–93. [Google Scholar]
- 16.Jimenez-Rios JL, Rabin Y. Thermal expansion of blood vessels in low cryogenic temperatures. Part II: Measurements of blood vessels vitrified with VS55, DP6, and 7.05M DMSO. Cryobiology. 2006;52(2):284–294. doi: 10.1016/j.cryobiol.2005.12.006. [DOI] [PMC free article] [PubMed] [Google Scholar]
- 17.Jimenez-Rios JL, Steif PS, Rabin Y. Stress-strain measurements and viscoelastic response of blood vessels cryopreserved by vitrification. Annals of Biomedical Engineering. 2007;35(12):2077–2086. doi: 10.1007/s10439-007-9372-0. [DOI] [PMC free article] [PubMed] [Google Scholar]
- 18.Luyet B, Rapatz G. An automatically regulated refrigeration system for small laboratory equipment and a microscope cooling stage. Biodynamica. 1957;7(154):337–345. [PubMed] [Google Scholar]
- 19.Narayanaswamy OS. A model of structural relaxation in glass. J Amer Ceram Soc. 1971;54(10):491–498. [Google Scholar]
- 20.Pegg DE, Wang L, Vaughan D. Cryopreservation of articular cartilage, Part 3: the liquidus-tracking method. Cryobiology. 2006;52:360–368. doi: 10.1016/j.cryobiol.2006.01.004. [DOI] [PubMed] [Google Scholar]
- 21.Plitz J, Rabin Y, Walsh J. The effect of thermal expansion of ingredients on the cocktails VS55 and DP6. Cell Preservation Technology. 2004;2(3):215–226. [Google Scholar]
- 22.Rabin Y, Steif PS. Thermal stresses in a freezing sphere and its application to cryobiology. ASME Journal of Applied Mechanics. 1998;65(2):328–333. [Google Scholar]
- 23.Rabin Y, Steif PS. Thermal stress modeling in cryosurgery. International Journal of Solids and Structures. 2000;37:2363–2375. [Google Scholar]
- 24.Rabin Y, Taylor MJ, Walsh JR, Baicu S, Steif PS. Cryomacroscopy of vitrification, Part I: A prototype and experimental observations on the cocktails VS55 and DP6. Cell Preservation Technology. 2005;3(3):169–183. doi: 10.1089/cpt.2005.3.169. [DOI] [PMC free article] [PubMed] [Google Scholar]
- 25.Rabin Y, Steif PS. Solid mechanics aspect of cryobiology. In: Baust JG, Baust JM, editors. Advances in Biopresevation. CRC Press; Boca Raton: 2006. pp. 359–382. [Google Scholar]
- 26.Rabin Y, Steif PS, Hess KC, Jimenez-Rios JL, Palastro MC. Fracture formation in vitrified thin films of cryoprotectants. Cryobiology. 2006;53:75–95. doi: 10.1016/j.cryobiol.2006.03.013. [DOI] [PMC free article] [PubMed] [Google Scholar]
- 27.Rapatz G, Luyet B. Apparatus for cinemicrography during rapid freezing. Biodynamica. 1957;7(155):347–355. [PubMed] [Google Scholar]
- 28.Steif PS, Palastro M, Wen CR, Baicu S, Taylor MJ, Rabin Y. Cryomacroscopy of vitrification, Part II: Experimental observations and analysis of fracture formation in vitrified VS55 and DP6. Cell Preservation Technology. 2005;3(3):184–200. doi: 10.1089/cpt.2005.3.184. [DOI] [PMC free article] [PubMed] [Google Scholar]
- 29.Steif PS, Palastro M, Rabin Y. The effect of temperature gradients on stress development during cryopreservation via vitrification. Cell Preservation Technology. 2007;5(2):104–11. doi: 10.1089/cpt.2007.9994. [DOI] [PMC free article] [PubMed] [Google Scholar]
- 30.Taylor MJ, Song YC, Brockbank KGM. Vitrification in tissue preservation: new developments. In: Fuller BJ, Lane N, Benson E, editors. Life in the Frozen State. Taylor and Francis Books; London: 2004. pp. 603–642. [Google Scholar]
- 31.Taylor MJ, Campbell LH, Rutledge RN, Brockbank KGM. Comparison of Unisol with EuroCollins solution as a vehicle solution for cryoprotectants. Transpl Proc. 2001;33:677–679. doi: 10.1016/s0041-1345(00)02198-9. [DOI] [PubMed] [Google Scholar]
- 32.Taylor MJ. Biology of cell survival in the cold: the basis for biopreservation of tissues and organs. In: Baust JG, Baust JM, editors. Advances in Biopreservation. Boca Raton: CRC Press; 2007. pp. 15–62. [Google Scholar]
- 33.Toner M, Cravalho EG, Karel M. Thermodynamics and kinetics of intracellular ice formation during freezing of biological cells. Journal of Applied Physics. 1990;67(3):1582–1593. [Google Scholar]
- 34.Trad FS, Toner M, Biggers JD. Effects of cryoprotectants and ice-seeding temperature on intracellular freezing and survival of human oocytes. Hum Reprod. 1999;14:1569–1577. doi: 10.1093/humrep/14.6.1569. [DOI] [PubMed] [Google Scholar]
- 35.Scholtze H. Glass: Nature, Structure, and Properties. New York: Springer-Verlag; 1991. [Google Scholar]
- 36.Sevanto S, Holbrook NM, Ball MC. Freeze/thaw-induced embolism: probability of critical bubble formation depends on speed of ice formation. Front Plant Sci. 2012;3:107. doi: 10.3389/fpls.2012.00107. [DOI] [PMC free article] [PubMed] [Google Scholar]
- 37.Weiner JH, Boley BA. Elasto-plastic thermal stresses in a solidifying body. J Mech Phys Solids. 1963;11:145–154. [Google Scholar]
- 38.http://www.britannica.com/EBchecked/topic/281026/ice/65762/Optical-properties Retrieved 4/19/2013


