Abstract
1. X-ray microcomputed tomography can be used to produce rapid, fully analysable, three-dimensional images of biological and other materials without the need for complex or tedious sample preparation and sectioning. We describe the use of this technique to visualise and analyse the microstructure of fragments of shell taken from three regions of chicken eggs (sharp pole, blunt pole and equatorial region).
2. Two- and three-dimensional images and data were obtained at a resolution of 1.5 microns. The images were analysed to provide measurements of shell thickness, the spacial density of mammillary bodies, the frequency, shape, volume and effective diameter of individual pore spaces, and the intrinsic sponginess (proportion of non-X-ray dense material formed by vesicles) of the shell matrix. Measurements of these parameters were comparable with those derived by traditional methods and reported in the literature.
3. The advantages of using this technology for the quantification of eggshell microstructural parameters and its potential application for commercial, research and other purposes are discussed.
INTRODUCTION
The microanalysis of eggshell structure allows an understanding of the shell parameters which determine egg quality (Panheleux et al., 1999; Ahmed et al., 2005; Dunn et al., 2005; Rodriguez-Navarro, 2007, 2011). Shell microstructure determines crucial production, reproductive and health characteristics of eggs (Rossi et al., 2013). Breakages account for between 8–11% of economic losses in total egg production annually (Hamilton et al., 1979; Tsang, 1992). The shell needs to withstand impact during processing and packaging, whereas its total strength needs to be limited to maintain hatchability for breeding purposes. Other structural features of the shell, such as the frequency and volume of pores and the presence of the cuticle, affect the susceptibility of the egg to microbiological invasion and determine water and gas exchange.
Eggshell comprises a number of layers formed during the passage of the egg through the oviduct. The shell gland produces a bioceramic compound consisting of an aggregate of calcite (a polymorphic form of calcium carbonate, CaCO3; approximately 95%) infused with an organic protein matrix (approximately 1%–3.5%; Solomon, 1991; Arias et al., 1993; Hunton, 1995; Rossi et al., 2013). During shell formation, the mineral structure grows from discrete nucleation sites, characterised by the formation of mammillary knobs (Arias et al., 1993). Calcite crystals laid at these sites initiate the formation of columns which fuse into the palisade layer of the shell matrix (Nys et al., 1999, 2004). The mammillary layer therefore influences shell breaking strength, but it must also conform to a pattern which enables the shell to operate as an embryonic chamber (Panheleux et al., 1999). The quantity and consistency of the mammillary bodies, along with the shell membrane on which they rest also influence the amount of calcium absorbed by the developing chick embryo (Chien et al., 2009). The mammillary nucleation sites contain proteoglycans with much lower calcium affinity than those found within the main body of the shell (Aggarwal et al., 1993).
Several variables influence the microstructural parameters of eggshell by altering the mineralisation process (Rodriguez-Navarro, 2007). The size and orientation of the calcite crystals vary in relation to their depth within the palisade layer and affect the mechanical properties of the shell and therefore its strength (Hamilton, 1982; Rodriguez-Navarro et al., 2002; Ahmed et al., 2005; Lammie et al., 2006, 2007). Smaller, less-regularly orientated crystals provide far greater shell strength than their larger, highly orientated counterparts. Crystal arrangement is influenced by factors including hen age, diet, sequence in the laying cycle and time after moult. It is also genetically influenced and associated with matrix protein markers incorporated within the shell (Rodriguez-Navarro et al., 2002; Ahmed et al., 2005; Dunn et al., 2012; Tumova and Gous, 2012). Measurements made on mammillary bodies and pores can be easily analysed against known breeding and production traits (Dunn et al., 2012).
Traditional techniques for shell analysis such as optical microscopy, scanning electron microscopy and conventional X-ray diffraction can be time consuming and may involve complex or tedious sample preparation. Two-dimensional (2D) X-ray diffraction makes data collection more rapid and reliable but may still provide limited information and require a focus on individual microstructural parameters (Rodriguez-Navarro, 2007). Quantification of mammillary body parameters has been achieved by these methods (Panheleux et al., 1999; Ahmed et al., 2005; Rodriguez-Navarro, 2007), whereas pore size and density have been measured using scanning electron microscopy or mercury porosimetry (Williams et al., 1984; La Scala Jnr. et al., 2000; Donaire and López-Martínez, 2009).
Microscopical study usually requires several hours of sample preparation and delivers only a narrow, topological view of the mammillary surface (Rodriguez-Navarro, 2007). Two-dimensional X-ray diffraction is a much faster process, requiring little sample preparation, and gives more detailed information on crystal size and structure (Ahmed et al., 2005; Rodriguez-Navarro et al., 2006; Rodriguez-Navarro, 2007), yet this technique is still limited to a 2-D view, focusing on the calcite crystals. Visualisation of mammillary bodies and crystal growth planes of the palisade matrix can be achieved by viewing polished shell fragments under polarised light (Simons, 1985), but this method does not facilitate quantification. Scanning electron microscopy can be used to view pore size and density, but sample preparation is lengthened by the need to polish sections into a flat plane and sputter with gold prior to scanning (Williams et al., 1984; Donaire and López-Martínez, 2009); this destroys the sample and makes the estimate of pore size subject to the depth viewed within shell. It is also limited to observation in 2-D unless many successive serial sections are collected. Mercury porosimetry provides a more accurate description of pore size distribution and pore volumes but gives no information on pore shape (La Scala Jnr. et al., 2000).
This paper describes the use of X-ray microcomputed tomography (X-ray mCT) to analyse eggshell and considers the potential of the technique in a range of production, breeding and biological applications. X-ray mCT is a rapidly advancing field for material science research and its development for medical applications has increased both speed and accuracy. Coupled with high performance image analysis software, X-ray mCT can now be used routinely, in research and commercial situations, to visualise the structures of a variety of different materials based on differences in their X-ray attenuation in 3-D at micro as well as macro scales (Mooney et al., 2012).
In the present study, X-ray mCT has been used to produce analysable 2-D and 3-D images of avian eggshells. Sample preparation was minimal and the scanning process itself was rapid. The parameters analysed include shell thickness, mammillary body frequency, and the frequency, shape and volume of pores. The investigation has also generated several alternative, heuristically advantageous visualisations of key features within the shell structure.
MATERIALS AND METHODS
Sample preparation
Chicken eggs were obtained from Sunrise Poultry Farms Ltd., Leicestershire, UK. Ten recently laid eggs from Lohmann brown hens of approximately 30 weeks of age were used. Hens had been housed free-range in flocks of approximately 14 500 birds and fed on a cereal diet consisting of 55% wheat and 18% soya with limestone and amino acids.
Dimensional properties of the eggshell were measured for reference according to Ahmed et al. (2005) prior to breaking. Length and width (mm) were measured using callipers and the egg shape index (width/length × 100) was calculated. Whole egg weight and dry eggshell weight (g) were used to estimate the percentage shell (shell weight/egg weight × 100) of each egg. Surface areas (cm2) were calculated as 4.68 × egg weight2/3 and shell density (g/cm2) was calculated as shell weight/surface area × 100.
Egg contents were emptied and shells were gently washed in water and dried for 24 h. Shells were sampled from three regions: the blunt pole containing the air sac, the equatorial region equidistant between the poles and the sharp pole opposite the blunt pole. Three fragments, each approximately 0.25 cm2, were broken off from each region and affixed using Araldite Instant epoxy adhesive to the tip of a glass rod (100 mm height × 3 mm diameter). This enabled the sample to be positioned very close to the X-ray source, increasing the achievable resolution. The fragments were aligned in parallel in an upright orientation such that their surfaces were close but not touching (outer surface of one shell next to the inner surface of another). The adhesive was allowed to harden for 24 h.
Eggshell scanning and image reconstruction
Samples were scanned using a Phoenix Nanotom (GE Sensing and Inspection Technologies GmbH, Wunstorf, Germany) X-ray micro CT system. The scanner was set at 85 kV electron acceleration energy and 70 µA current with the detector set at a distance of 200 mm and the eggshell stacks 6 mm from the X-ray source with no filter. The settings were held constant for each scan. A total of 1080 projection images were collected using a detector exposure of 750 ms integrated over three averaged images resulting in a scan time of 27 min. A total of 30 scans was performed, resulting in 90 eggshell samples being scanned (three scans on each of the three regions of 10 eggshells).
Volumetric data was reconstructed using DatosX|Rec (GE Sensing and Inspection Technologies GmbH, Wunstorf, Germany) software based on cone-beam filtered back projection algorithms. The volumetric data consists of individual voxels (3D pixels) mapped to a 16 bit grey value scale. Low electron density materials attenuate X-rays less than high X-ray density materials which correspond to low and high grey scale values, respectively (e.g. 0 [black]–65 535 [white]). Individual shell fragments were virtually separated (segmented) from the original reconstructed volumes using the region-growing tool in VG StudioMAX v2.0 (Volume Graphics, GmbH, Heidelberg, Germany) by selecting a seed point within the high-density shell material. This tool propagates through the volume in 3-D connecting voxels within a specified grey value tolerance range to create a region of interest defining a material with a specific density. An opening and closing operation was subsequently used to remove noise from the region. Each shell fragment was carefully aligned in the 3-D viewer so the mammillary surface (outer shell membrane) was at the front with the external shell surface at the back. An XY (top) image stack was saved in TIFF (.tif) image format (Figure 1).
Figure 1.
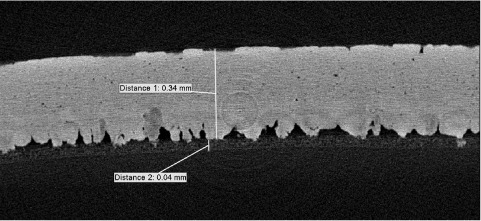
Two-dimensional cross section through the X–Z axis of an eggshell sample at a resolution of 1.5 µm, generated by X-ray mCT. Labels show the thickness of the palisade matrix (distance 1) and the thickness of the outer shell membrane (distance 2) below the mammillary nucleation sites.
Measurements and statistical analyses
Measurements of shell thickness were made using the calliper tool in VG StudioMAX v 2.0. The thickness of each regional sample was measured at 10 mammillary body locations and averaged.
The number of pores was counted manually by working through the fragment images at 1.5 µm intervals across a known area (XY plane; Figure 2) of shell surface, counting only those which spanned (Z-axis) the entire matrix of the shell. Functional pore size was measured using ImageJ and defined as the minimum pore cross sectional area encountered during progressive slicing at 1.5 µm intervals along the length of the pore. Images were reduced to binary form to provide a threshold between greyscale areas and distinguish between occupied and empty pixels.
Figure 2.
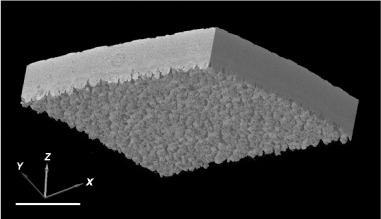
Reconstruction showing orientation of 3D axis used. Scale bar = 400 µm.
To obtain an alternative view of shell porosity, including the distribution, shape and completeness of pores, 3-D visualisations were created by loading unsigned 8 bit .tif image stacks of the shell into VG StudioMAX, creating a region of interest including the surrounding area and using the “swap inner/outer surfaces” tool to remove the solid shell and highlight the surrounding edges (Figure 3).
Figure 3.
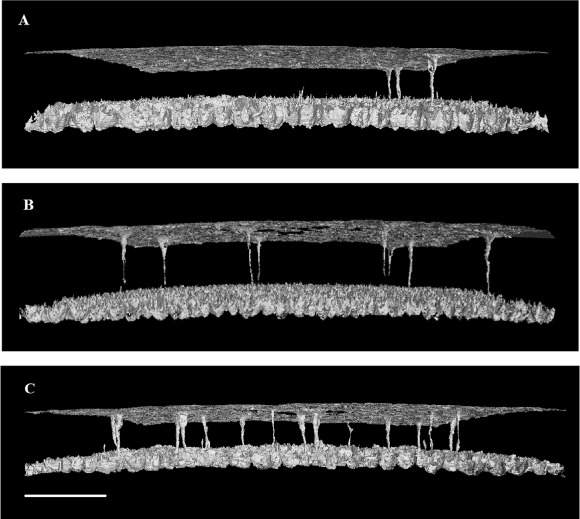
Negative three-dimensional images showing the quantity, shape and arrangement of pores in the (A) sharp, (B) equator and (C) blunt regions of chicken eggshell. The images are foreshortened, with the horizontal focal point of each image placed midway between the outside of the shell (top) and the mammillary nucleation surface (bottom) but with the horizontal curvature of the shell left intact. Note that pores vary in the size, shape and the completeness with which they traverse the whole shell. Scale bar = 400 µm.
To estimate mammillary body density, three positions on the inner fragment surface were chosen and the average number of mammillary projections horizontal to the image plane recorded using ImageJ. The maximum count of discrete objects of high-density material encountered while progressing along the Z-axis from the inner uncalcified space into the shell matrix was recorded as the number of mammillary bodies. This procedure accommodated the curvature of the shell sample which, with vertically progressing horizontal planes, initially produces a high edge density and zero centre density (object count = 0), and ends with uniform high density (object count = 1) of the fully merged calcite columns (Figures 4 and 5).
Figure 4.
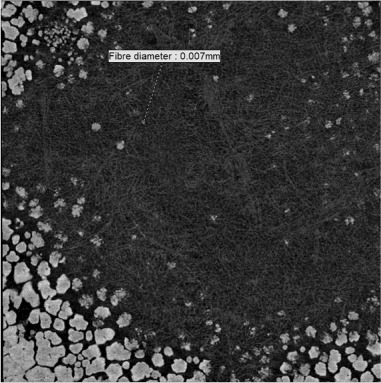
Two-dimensional image (1.5 µm resolution) in the X–Y plane of the junction between the outer shell membrane and the mammillary layer of a chicken eggshell fragment. Because of the curvature of the shell, the centre of the image shows only the collagen fibres of the outer shell membrane and the mammillary knobs (mammillary body nucleation sites) become visible towards the periphery (appearing to increase in frequency and size but then coalescing).
Figure 5.
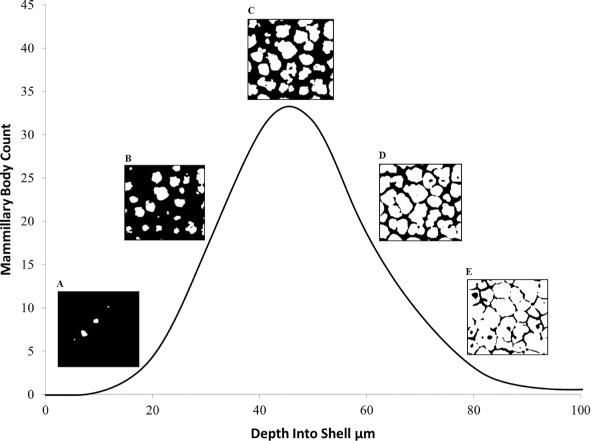
Representative mammillary body profile showing the count of individual mammillary bodies viewed in a flat sampling plane (X–Y) as the curved shell is traversed vertically (Z-axis) from the nucleation sites, through the main palisade matrix to the external surface. The contrast is set such that X-ray dense material (calcite) appears white while other material or empty space appears black. Images A–E represent the visual appearance of the scan, showing the increase from few dense bodies in A and B, to the maximum number in C, before the calcite columns fuse in D and E. The mammillary body density was estimated as the maximum count divided by the unit area.
We used the term “sponginess” to describe the proportion of low-density space within the shell matrix, presumably created by the presence of uncalcified vesicles. This was estimated using duplicate volume samples within the matrix of the shell, using ImageJ to count the empty pixels. Figures 6 (A) and (B) illustrate the spongy nature of the shell using false colour to identify the low-density material.
Figure 6.
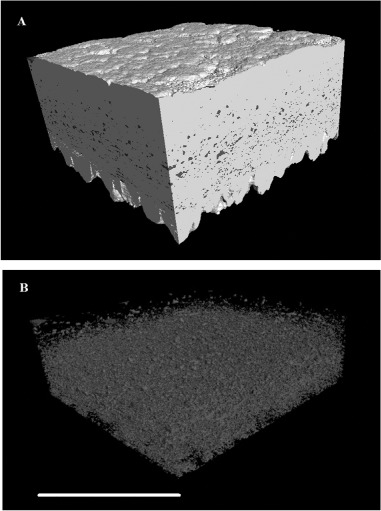
(A) Three-dimensional reconstruction of an equatorial region of eggshell between the outer surface and the mammillary layer, showing the high-density material of the palisade matrix (calcite) as white and the intrinsic porosity (vesicles) in blue (colour version available online at http://dx.doi.org/10.1080/00071668.2014.924093). (B) The same reconstructed image with the dense material removed to reveal the negative space of the vesicles. Scale bar = 400 µm, resolution = 1.5 µm.
Data were analysed using a general one-way analysis of variance (ANOVA) using SPSS v 16.0 (IBM). Each parameter was tested for variance across regions and significant results were analysed using Fisher's least significant difference (LSD) post hoc test to identify significant differences between regional means.
RESULTS
Shell thickness
Figure 1 shows an example of a 2-D cross section through the equatorial region of the eggshell. There was a tendency for the sharp pole to be thicker than the blunt pole, with the equatorial region intermediate, but these differences were not significant over the 10 eggs analysed (Table). The average shell thickness was 366 μm.
Table.
Eggshell microstructural parameters determined using three-dimensional X-ray mCT, showing mean values ± SEM in three regions of the eggshell (n = 10). P-value indicates significance level using one-way analysis of variance (ANOVA); where a significant effect of shell region was observed, values in the row without a common superscript are significantly different (P < 0.05) using Fisher's least significant difference post hoc test. Definitions of variables are given in the text
| Variable | Sharp end | Blunt end | Equator | Significance P |
|---|---|---|---|---|
| Shell thickness, µm | 371 ± 8 | 367 ± 8 | 361 ± 10 | NS |
| Mammillary density, N/mm2 | 310.5 ± 17.1a | 252.6 ± 8.76b | 286.6 ± 18.9a,b | <0.05 |
| Pore frequency, N/mm2 | 0.82 ± 0.08 | 1.38 ± 0.11b | 1.64 ± 0.06c | <0.001 |
| Average pore size, µm | 94.95 ± 8.69 | 129.43 ± 7.25b | 131.18 ± 6.73b | <0.01 |
| Sponginess, % | 0.29 ± 0.05 | 0.37 ± 0.08 | 0.33 ± 0.04 | NS |
Mammillary body density
The density of mammillary bodies varied significantly between regions (P < 0.05; Table). Mammillary body density was significantly lower in the equator than at the poles (P < 0.05). The average mammillary body density across all regions was 283 per mm2.
Pore frequency
Figure 7 shows the 2-D appearance of a pore while traversing through the X–Y axis. Figure 8 (A) shows the 3-D-structure of a pore, and Figure 8 (B) shows the pore false coloured against a negative image of the spongy matrix. The frequency of pores was significantly different between the regions of the eggshell (P < 0.001; Table). It was significantly different between any two regions and was approximately twice as high in the blunt pole as in the sharp pole (as indicated by Figure 3).
Figure 7.
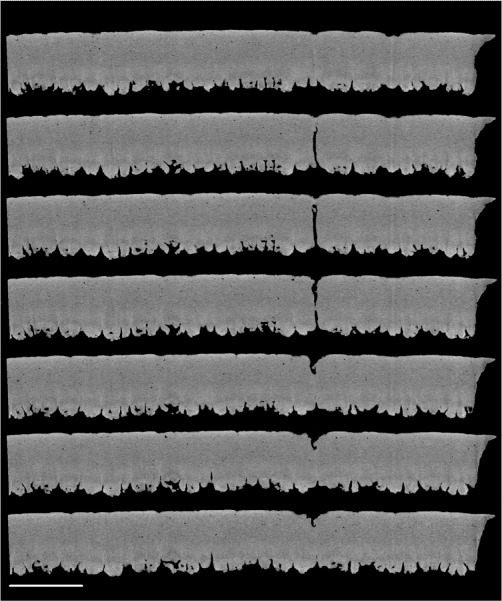
Two-dimensional slice-by-slice (traversing the X–Z axis) images of an equatorial region of shell, showing a pore which traverses the palisade matrix. Images are at 6 µm intervals and are at a resolution of 1.5 µm. Scale bar = 400 µm.
Figure 8.
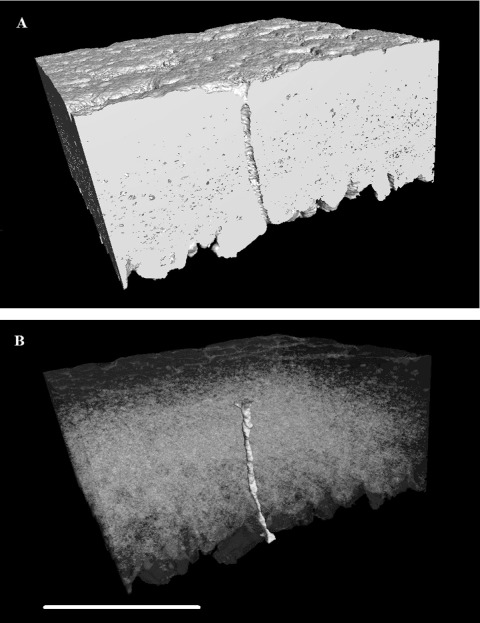
Three-dimensional reconstruction of an equatorial region of eggshell between the outer surface and the mammillary layer, generated using X-ray mCT. The reconstruction is positioned (A) to cut through vertically a pore along one face of the image with high-density material (calcite) shown as white and other material/space in grey. In (B), the dense material is shown transparent with the pore false coloured in shaded yellow to show its full shape and orientation through the shell matrix (colour version available online at http://dx.doi.org/10.1080/00071668.2014.924093). Scale bar = 400 µm, resolution = 1.5 µm.
Functional pore size
A significant difference was found between the average functional pore size (minimum pore area) between the different regions of the shell (P < 0.001; Table). The pores in the sharp pole were significantly narrower than the pores found in the equatorial and blunt regions (P < 0.01; Table). The average pore size across all regions was 355.6 μm. Figure 3 also shows the presence of some incomplete pores which do not span the depth of the shell.
Shell sponginess
Approximately one-third of the shell matrix was occupied by non-X-ray-dense material. There was a tendency for the sharp pole of the shell to have a lower sponginess than the other two regions, but overall the variation between regions was not significant (P > 0.05; Table). The sharp pole of the shell appeared to have a lower sponginess than the other two regions, but the amount of variance was large and there was no significant difference.
Correlations between mammillary body density, pore frequency and pore size
Pore frequency decreased as the density of mammillary bodies increased (r2 = 0.146, P < 0.05; Figure 9). Functional pore size increased as pore frequency increased (r2 = 0.208, P < 0.05; Figure 10). There was no significant correlation between functional pore size and mammillary density.
Figure 9.
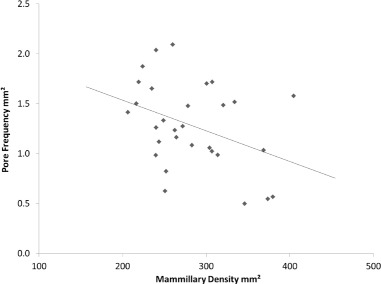
Relationship between mammillary body density and pore frequency across the entire eggshell (r2 = 0.1464, P = 0.037). N = 30.
Figure 10.
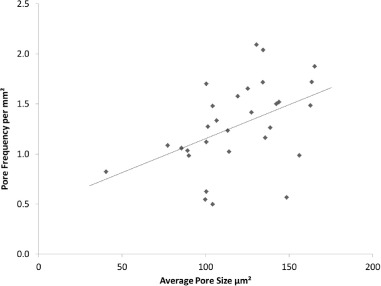
Relationship between pore frequency and average pore size across the entire eggshell (r2 = 0.2076, P = 0.011). N = 30.
DISCUSSION
Three-dimensional X-ray mCT coupled with image manipulation is an entirely new approach to the study of eggshell microstructure. It offers a number of advantages and a range of new possibilities, including the simultaneous visualisation and measurement of key microstructural parameters. The primary purpose of this study was to demonstrate its potential and to compare the data obtained with published data derived by other methods. 3-D images, such as those generated in this study, also permit a more informative visualisation of microstructural features within eggshell than has previously been possible.
The scanning procedures described in this study required no sample preparation, other than washing and adhesive mounting. Scan times were short (27 min) and multiple samples could be scanned simultaneously (three samples per scan, reducing the effective scan time to nine min per sample). There was no necessity to slice, polish or otherwise dress the samples, and no need for time consuming and expensive procedures such as gold film sputtering or the use of polarised light. The duration of the image analysis was variable (up to a few hours), depending on the information being determined, but it was relatively easy to automate many of the procedures and achieve rapid generation of data.
The wide field of view allowed a much larger sample area to be studied than is possible with optical or scanning electron microscopy. We used a high resolution of 1.5 microns, but this can be adjusted according to the features of interest by altering the distance between the sample and the detector. We concentrated on the mineral structure of the shell, but some analysis of the shell membranes may also be feasible by this method.
The data shows clear regional variation in the density of mammillary bodies and also pore frequency and volume in the different regions of the shell. A significant difference in mammillary body frequency was observed between the sharp pole and the equatorial region. There was also a highly significant difference in pore frequency between the regions, increasing from the sharp to the blunt pole. Such variations have been described previously (Solomon et al., 1994) and our numerical values are similar to those of previous estimates (Tyler, 1953; Simkiss, 1968; estimated using equations from Deeming (2006) and Panheleux et al. (1999)).
The shape and orientation of the pores match those described by Tullett (1978). The pores in each region displayed significant differences in functional size, with those at the sharp pole being significantly narrower than those in the other two regions. This variation may imply regional differences in the gas and water permeability of the shell and would be consistent with the blunt end, surrounding the intermembranal air sac, being the principal site of gas exchange for the developing chick embryo. The facilitation of water loss in this region may also be of significance because approximately 12% (typically 15% at altitude) of total egg weight needs to be lost during incubation to allow optimum hatchability (Rahn et al., 1977; Fink et al., 1992; Nys et al., 1999).
We found a negative linear correlation between mammillary body density and pore frequency (r2 = 0.147) which contrasts with the highly positive correlation (r2 = 0.843) found by Tullett (1975). Given the limited data available in the literature, the significance of this discrepancy is unclear. However, it may indicate that there is no simple relationship between the frequency of sites of initial calcite deposition on the outer shell membrane and the interruption of their regular spacing to form pores.
The positive correlation between pore frequency and functional pore size suggests that chicken eggs have evolved to adjust the gas and water exchange necessary for embryonic development and hatching by a combination of these variables (Tullett and Board, 1976). Presumably the risk of microbiological invasion sets an upper biological limit on the functional diameter of pores (Solomon et al., 1994). There was no significant correlation found between functional pore size and mammillary density.
Pore analysis has been significantly enhanced by using this technique. The ability to remove the calcified areas of the shell image leaving only the pores, allows greater visual interpretation of these structures and facilitates a better appreciation of the regionalised differences in pore frequency and functional pore size than was previously possible. Shape, continuity, frequency and distribution of pores can be visualised and analysed through complete regions of shell. The influence of sampling position is obviated and there is no need for repeated physical sectioning or surface polishing.
Although it was not possible to obtain information about calcite crystal size and orientation using this approach, a number of inferences can be made without this information. Weaker eggshells have a higher density of mammillary bodies (Van Toledo et al., 1982) and the density of these nucleation sites is negatively correlated to crystal size and shell thickness because of the special competition between crystal growth stacks (Solomon, 1991; Rodriguez-Navarro and Garcia-Ruiz, 2000; Dunn et al., 2012). It may therefore be possible to derive information on crystal size, shell thickness and breaking strength based on the density of nucleation sites obtained by X-ray mCT. If more direct information is required, it may be feasible to combine this technique with 2-D X-ray diffraction and the automated analysis developed by Rodriguez-Navarro (2007).
This approach to eggshell analysis presents a range of potential commercial and biological applications. Its simplicity and speed should facilitate large-scale experimental investigations of the effects of bird age, cycle stage, nutrition, management practices and environmental variables on eggshell microstructure and calcification, as well as the identification of genetic determinants. It could potentially be used as a routine method for monitoring eggshell quality during commercial egg production. In fertilised eggs, it could be used to monitor mineral reabsorption from the mammillary surface at various stages through the incubation process and may offer the possibility of correlating this with skeletal analysis in the developing embryo. It should facilitate a more extensive comparison of shell structures between bird species, where there is currently limited information based on scanning electron microscopy (Panheleux et al., 1999; Tullett, 1975), and should simplify the investigation of rare, historic or fossilised shell fragments (Donaire and López-Martínez, 2009).
In conclusion, the use of three-dimensional X-ray mCT to visualise and quantify the microstructural parameters should significantly hasten progress in genetic and managerial improvement of commercial avian stocks and facilitate further research in this field. Image manipulation and quantification in three dimensions is a new concept in eggshell research, offering better visualisation and more complete data than previously possible. The simplicity of sample preparation, speed of scanning, repeatability and speed of analysis should make this a valuable tool in future research. X-ray mCT has revolutionised research in many other areas of the biosciences (e.g. plant growth, soil analysis, bone development) and it has potential to do the same in this field.
REFERENCES
- Aggarwal M., Xiao S.Q., Heuer A.H. Decalcification studies on avian eggshell. Material Research Science. 1993;292:219–224. [Google Scholar]
- Ahmed A.M.H., Rodriguez-Navarro A.B., Vidal M.L., Gautron J., García-Ruiz J.M., Nys Y. Changes in eggshell mechanical properties, crystallographic texture and in matrix proteins induced by moult in hens. British Poultry Science. 2005;46:268–279. doi: 10.1080/00071660500065425. [DOI] [PubMed] [Google Scholar]
- Arias J.L., Fink D.J., Xiao S., Heuer A.H., Caplan A.I. Biomineralization and eggshells: cell-mediated acellular compartments of mineralized extracellular matrix. International Review of Cytology. 1993;145:217–250. doi: 10.1016/S0074-7696(08)60428-3. [DOI] [PubMed] [Google Scholar]
- Chien Y.C., Hincke M.T., McKee M.D. Ultrastructure of avian eggshell during resorption following egg fertilization. Journal of Structural Biology. 2009;168:527–538. doi: 10.1016/j.jsb.2009.07.005. [DOI] [PubMed] [Google Scholar]
- Deeming D.C. Ultrastructural and functional morphology of eggshells supports the idea that dinosaur eggs were incubated buried in a substrate. Palaeontology. 2006;49:171–185. doi: 10.1111/j.1475-4983.2005.00536.x. [DOI] [Google Scholar]
- Donaire M., López-Martínez N. Porosity of late paleocene ornitholithus eggshells (Tremp Fm, south-central Pyrenees, Spain): palaeoclimatic implications. Palaeogeography, Palaeoclimatology, Palaeoecology. 2009;279:147–159. doi: 10.1016/j.palaeo.2009.05.011. [DOI] [Google Scholar]
- Dunn I.C., Bain M., Edmond A., Wilson P.W., Joseph N., Solomon S., De Ketelaere B., De Baerdemaeker J., Schmutz M., Preisinger R., Waddington D. Heritability and genetic correlation of measurements derived from acoustic resonance frequency analysis; a novel method of determining eggshell quality in domestic hens. British Poultry Science. 2005;46:280–286. doi: 10.1080/00071660500098574. [DOI] [PubMed] [Google Scholar]
- Dunn I.C., Rodríguez-Navarro A.B., McDade K., Schmutz M., Preisinger R., Waddington D., Wilson P.W., Bain M.M. Genetic variation in eggshell crystal size and orientation is large and these traits are correlated with shell thickness and are associated with eggshell matrix protein markers. Animal Genetics. 2012;43:410–418. doi: 10.1111/j.1365-2052.2011.02280.x. [DOI] [PubMed] [Google Scholar]
- Fink D.J., Caplan A.I., Heuer A.H. Eggshell mineralization: a case study of a bioprocessing strategy. MRS Bulletin. 1992;20:27–31. [Google Scholar]
- Hamilton R.M.G. Methods and factors that affect the measurement of eggshell quality. Poultry Science. 1982;61:2022–2039. doi: 10.3382/ps.0612022. [DOI] [Google Scholar]
- Hamilton R.M.G., Hollands K.G., Voisey P.W., Grunder A. A. Relationship between eggshell quality and shell breakage and factors that affect shell breakage in the field – a review. World's Poultry Science Journal. 1979;35:177–190. doi: 10.1079/WPS19790014. [DOI] [Google Scholar]
- Hunton P. Understanding the architecture of the eggshell. World's Poultry Science Journal. 1995;51:141–147. doi: 10.1079/WPS19950009. [DOI] [Google Scholar]
- La Scala N., Jnr., Boleli I.C., Ribeiro L.T., Freitas D., Macari M. Pore size distribution in chicken eggs as determined by mercury porosimetry. Revista Brasileira De Ciencia Avicola. 2000;2:177–181. [Google Scholar]
- Lammie D., Bain M.M., Solomon S.E., Wess T.J. Scanning microfocus small angle X-ray scattering study of the avian eggshell. Journal of Bionic Engineering. 2006;3:11–18. doi: 10.1016/S1672-6529(06)60002-4. [DOI] [Google Scholar]
- Mooney S.J., Pridmore T.P., Helliwell J., Bennett M.J. Developing X-ray computed tomography to non-invasively image 3-D root systems architecture in soil. Plant Soil. 2012;352:1–22. doi: 10.1007/s11104-011-1039-9. [DOI] [Google Scholar]
- Nys Y., Hincke M.T., Arias J.L., Garcia-Ruiz J.M., Solomon S. Avian eggshell mineralization. Poultry Science Avian Biology Review. 1999;10:143–166. [Google Scholar]
- Nys Y., Gautron J., Garcia-Ruiz J.M., Hincke M.T. Avian eggshell mineralization: biochemical and functional characterization of matrix proteins. General Palaeontology. 2004;3:549–562. [Google Scholar]
- Panheleux M., Bain M., Fernandez M.S., Morales I., Gautron J., Arias J.L., Solomon S.E., Hincke M., Nys Y. Organic matrix composition and ultrastructure of eggshell: a comparative study. British Poultry Science. 1999;40:240–252. doi: 10.1080/00071669987665. [DOI] [PubMed] [Google Scholar]
- Rahn H., Carey C., Balmas K., Bhatia B., Paganelli C. Reduction of pore area of the avian eggshell as an adaptation to altitude. Proceedings of the National Academy of Sciences. 1977;74:3095–3098. doi: 10.1073/pnas.74.7.3095. [DOI] [PMC free article] [PubMed] [Google Scholar]
- Rodriguez-Navarro A., Garcia-Ruiz J.M. Model of textural development of layered crystal aggregates. European Journal of Mineralogy. 2000;12:609–614. [Google Scholar]
- Rodriguez-Navarro A., Kalin O., Nys Y., Garcia-Ruiz J.M. Influence of the microstructure on the shell strength of eggs laid by hens of different ages. British Poultry Science. 2002;43:395–403. doi: 10.1080/00071660120103675. [DOI] [PubMed] [Google Scholar]
- Rodriguez-Navarro A.B. Rapid quantification of avian eggshell microstructure and crystallographic-texture using two-dimensional X-ray diffraction. British Poultry Science. 2007;48:133–144. doi: 10.1080/00071660701302262. [DOI] [PubMed] [Google Scholar]
- Rodriguez-Navarro A.B., Alvarez-Lloret P., Ortega-Huertas M., Rodriguez-Gallego M. Automatic crystal size determination in the micrometer range from spotty X-ray diffraction rings of powder samples. Journal of the American Ceramic Society. 2006;89:2232–2238. [Google Scholar]
- Rossi M., Nys Y., Anton M., Bain M., De Ketelaere B., De Reu K., Dunn I., Gautron J., Hammershøj M., Hidalgo A., Meluzzi A., Mertens K., Nau F., Sirri F. Developments in understanding and assessment of egg and egg product quality over the last century. World's Poultry Science Journal. 2013;69:414–429. doi: 10.1017/S0043933913000408. [DOI] [Google Scholar]
- Simkiss K. The structure and the formation of the shell and the shell membranes. In: Carter T.C., editor. Egg Quality – A Study of the Hen's Egg. Edinburgh, UK: Oliver and Boyd; 1968. pp. 3–25. [Google Scholar]
- Simons P.C.M. Eggshell quality can sometimes be improved. Poultry, (Misset International) 1985;January:6–9. [Google Scholar]
- Solomon S.E. Egg and Eggshell Quality. London, UK: Wolfe Publishing; 1991. [Google Scholar]
- Solomon S.E., Bain M.M., Cranstoun S., Nascimento V. Hen's egg shell structure and function. In: Board R.G., Fuller R., editors. Microbiology of the Avian Egg. London, UK: Chapman & Hall; 1994. pp. 1–24. [Google Scholar]
- Tsang C.P. W. Research note: calcitriol reduces egg breakage. Poultry Science. 1992;71:215–217. doi: 10.3382/ps.0710215. [DOI] [Google Scholar]
- Tullett S.G. Regulation of avian eggshell porosity. Journal of Zoology. 1975;177:339–348. doi: 10.1111/j.1469-7998.1975.tb02237.x. [DOI] [Google Scholar]
- Tullett S.G. Pore size versus pore number in avian eggshells. In: Piiper J., editor. Respiratory Function in Birds, Adults and Embryonic. Berlin, Germany: Springer-Verlag; 1978. pp. 219–226. [Google Scholar]
- Tullett S.G., Board R.G. Oxygen flux across the integument of the avian egg during incubation. British Poultry Science. 1976;17:441–450. doi: 10.1080/00071667608416297. [DOI] [Google Scholar]
- Tumova E., Gous R.M. Interaction of hen production type, age, and temperature on laying pattern and egg quality. Poultry Science. 2012;91:1269–1275. doi: 10.3382/ps.2011-01951. [DOI] [PubMed] [Google Scholar]
- Tyler C. Studies on egg shells. II. A method for marking and counting pores. Journal of the Science of Food and Agriculture. 1953;4:266–272. doi: 10.1002/jsfa.2740040603. [DOI] [Google Scholar]
- Van Toledo B., Parsons A.H., Combs G.F. Role of ultrastructure in determining eggshell strength. Poultry Science. 1982;61:569–572. doi: 10.3382/ps.0610569. [DOI] [Google Scholar]
- Williams D.L.G., Seymour R.S., Kerourio P. Structure of fossil dinosaur eggshell from the Aix basin, France. Palaeogeography, Palaeoclimatology, Palaeoecology. 1984;45:23–37. doi: 10.1016/0031-0182(84)90107-X. [DOI] [Google Scholar]


