

Abstract
We report the binding of the drug raloxifene with Calf thymus DNA (ctDNA) and bovine serum albumin (BSA) in the presence and absence of β-cyclodextrin (β-CD) and explain the influence of β-cyclodextrin on the binding of the drug to macromolecules. UV-Vis absorption, fluorescence, proton nuclear magnetic resonance and two-dimensional rotating-frame nuclear overhauser effect spectroscopic techniques are used to study the stoichiometry and the binding strength of the complexes. Molecular modeling is used in combination with other techniques to propose the structure of the inclusion complex and the interaction with ctDNA. The Stern–Volmer quenching constants of the interaction of raloxifene with ctDNA in aqueous and in β-CD solution are compared. The competition for binding of ctDNA with raloxifene and Methylene Blue is studied. The apparent binding constant and the number of binding sites for the binding of raloxifene with BSA in aqueous solution are significantly different from those in the presence of β-CD. The influence of β-CD on the binding of the small molecules with biological macromolecules is discussed. We infer that the binding strengths between raloxifene and macromolecules, viz., ctDNA and BSA are influenced by the β-CD encapsulation. These results may suggest new ways to tune the drug binding to biomacromolecules by encapsulating specific moieties of drugs.
Keywords: Raloxifene, β-Cyclodextrin, Calf thymus DNA, Fluorescence spectroscopy
Introduction
Raloxifene hydrochloride (methanone, [6-hydroxy-2-(4-hydroxyphenyl) benzo[b]thien-3-yl]-[4-[2-(l-piperidinyl) ethoxy] phenyl]-, hydrochloride, RH), belonging to the benzothiophene class of compounds, is a non-steroidal selective estrogen receptor modulator (SERM) compound, as shown in Fig. 1a [1, 2]. The drug was originally described as an anti-estrogen and used in a clinical trial to prevent breast cancer in high-risk women. It is also used in the treatment and prevention of osteoporosis in post-menopausal women [3]. Being an estrogen agonist in bone, it exerts an anti-resorptive effect [4]. RH was originally named keoxifene. The drug has a high binding affinity to both estrogen receptor-alpha (ER alpha) and estrogen receptor-beta (ER beta) primarily because it has strategically located phenolic groups. However RH is a short-acting compound because of poor bioavailability due to rapid phase II metabolism. The structure of RH does not permit the use of similar chemical methods of detection as used in tamoxifen [5–8].
Fig. 1.

a Molecular structure of raloxifene. b Bond distance calculated by RasMol 2.7.5.2
The aqueous solubility and the bioavailability of drugs can be increased by the formation of inclusion complexes [9]. Cyclodextrins are cyclic oligosaccharides capable of forming host–guest complexes with a variety of guest molecules. Spectroscopic techniques are used to monitor the formation of inclusion complexes [10, 11. In each of the spectroscopic methods, inclusion of a guest molecule into the hydrophobic cavity of this tapered cone–shaped molecule results in the change in a measurable property of the guest. In the case of UV–Vis spectroscopy, a change in absorbance and/or absorption wavelength of the guest is observed [12]. In the case of 1H NMR, a change in the chemical shift of one or more protons on the guest or those in cyclodextrin, particularly of the hydroxyl protons, is observed. In the case of 2D NMR, the correlation between protons of the guest and the host molecules is observed [13]. In the case of fluorescence, a change in the emission intensity and/or emission wavelength maximum of the guest is observed. Of these, fluorescence spectroscopy is the most sensitive, as it requires the lowest concentration of the sample and exhibits by far the largest effects upon inclusion. It is thus an excellent technique to study inclusion phenomena in cyclodextrins [14]. Fluorescence spectroscopy also offers an alternative method for studying the structure and dynamics of DNA and proteins that allow for real-time observations of changes in their microenvironment [15, 16]. Fluorescence-based methods have become instrumental in advancing high-throughput screening techniques, particularly in the context of drug discovery [17]. Schrödinger software has been used for molecular modeling and well suited for drug designing both structure-based and ligand-based methods and we adopt this for supporting our experimental results [18].
The literature is abundant with reports on the host–guest association of drugs or other small molecules with cyclodextrin [19–22]. Similarly, drug molecules binding with macromolecular biological targets including blood proteins and DNA have been explored for several years [23–26]. However, even though cyclodextrins are known carriers that help in the sustained release of drugs, reports on the role of such carrier molecules in bringing the encapsulated molecules towards protein or DNA and their role in modulating the binding of drugs to the targets are scarce. Our laboratory is active in the spectral investigation of cyclodextrin-encapsulated molecules binding to such macromolecular targets. In this paper, we report the role of cyclodextrin on the binding of RH to calf thymus DNA (a model DNA) and with bovine serum albumin (a model protein).
Experimental sections
Apparatus
Absorption and fluorescence spectra were recorded using a UV-Vis spectrophotometer (Jasco-V630, Japan) and a spectrofluorometer (Jasco-FP 750, Japan) equipped with a 150 W Xenon lamp (for excitation), respectively. Both the excitation and the emission bandwidths were set up at 4 nm. The excitation wavelength was fixed at 280 nm. The IR spectrum was recorded with KBr pellets on PerkinElmer spectrometer (RXI, USA). The interaction between RH and β-CD or DNA or BSA was optimized theoretically using molecular modeling using the software Schrödinger, Glide 5.5. Glide sorts its results by GlideScore. GlideScore is an empirical scoring function that approximates the ligand–binding free energy [27, 28]. The B-DNA was used as the model for the theoretical studies. The structure of ctDNA duplex 5-d(CCATTAATGG) 2-3 was built and optimized [29, 30]. The Schrödinger software was used as a tool to find the binding strength of RH-β-CD and RH-DNA complex theoretically. G-score was determined to derive the strength of the interactions. The surface topology of grinded RH and its β-CD inclusion complex were examined by JEOL Model scanning electron microscope JSM 6390, Japan; the pictures were taken at excitation voltages of 10 and 20 kV. The surface of a nonconductive rough–surfaced specimen was sputter-coated evenly from every direction with gold metal prior to observation to prevent the charge-up on the specimen surface. A confocal fluorescence microscope (Carl Zeiss Scope A1, HBO 100 Microscope illuminating system, HAL 100 Halogen illuminator, GmbH, Germany) was used to perform fluorescence microscopic studies. For studies using fluorescence microscope, the samples were applied on glass plates separately and allowed to dry at room temperature and was viewed at the emission wavelength (411 nm) of RH under a confocal fluorescence microscope. 2D ROESY spectra were recorded on a Bruker AV III instrument, operating at 500 MHz with DMSO–d 6 as solvent. As an internal standard, tetramethylsilane (TMS) was used. The chemical shift values were obtained downfield from TMS in parts per million (ppm). The mixing time for ROSEY spectra was 200 ms under the spin lock condition.
Reagents
Calf thymus DNA (ctDNA), purchased from Genei, India, was used as such, without further purification. Crystalline bovine serum albumin, β-cyclodextrin, and HEPES buffer were purchased from Hi Media, India. The purity of ctDNA was checked using optical measurements (A 260/ A280≻ 1.8, where A represents absorbance). ctDNA was dissolved in 50 × 10−3 mol dm−3 of NaCl prior to use to obtain the required stock concentration (per nucleotide phosphate, NP) which was calculated using the molar extinction coefficient of 6,600 l (mol.cm) at 260 nm (pH, 7.5). Acetate buffer (10 × 10−3 mol dm−3, pH 3.5) was used to control the pH of working solution for DNA interactions since the low fluorescence observation of DNA solutions at acidic conditions. The final molarity of the acetate buffer solution is 25 × 10 −4 mol dm−3. HEPES buffer (0.1 mol dm−3) was used to prepare the stock solution of BSA of concentration 3.0 × 10⁻⁵ mol dm −3. Double–distilled water was used to dilut the BSA in the working solution. RH was obtained from Sigma-Aldrich and its concentration was fixed by dissolving in water containing 10% ethanol because of its low aqueous solubility. All the working solutions were prepared by the appropriate dilution of the stock solution. The working solutions were having the concentration of ethanol as 1%. The other reagents and solvents used were of analytical and spectral grade, which were used without further purification. Double–distilled water was used throughout and the solutions were stored at 0–4 ∘C. All experiments were carried out at ambient temperature of 25 ± 2 ∘C.
General procedures
The test solution of RH was prepared by adding microliters of stock solution of RH to water and shaking to ensure complete homogenization of the resulting solution. The required amount of aliquots of RH and an appropriate amount of β-CD and or ctDNA or BSA solution were transferred into micro–tubes and made up to 5 ml using double–distilled water. The absorption and fluorescence measurements were made against the appropriate blank solutions.
Synthesis of RH and β-CD as solid complex
A solution of RH (1.2 × 10⁻² mol dm−3) was prepared in ethanol and an equimolar solution of β-CD was made in double–distilled water separately. A solution of RH was added slowly to the solution of β-CD at room temperature in an ultra-sonicator and maintained for 30 min. Then the mixture was warmed to 60 ∘C for 10 min and kept at room temperature for 2 days. The solid obtained was collected by filtration and analyzed. It was characterized by UV, fluorescence, SEM, 1H NMR, and 2D ROESY spectroscopy.
Results and discussion
Host-guest complex of RH with β-CD
The inclusion complex RH–β-CD was studied by UV-Vis absorption method is shown in Fig. 2a. The absorption band of RH was centered at wavelength (λmax) 284 nm, which correspond to the n – π∗ transition. No identifiable absorption band was observed for β-CD. The inclusion complex of RH-β-CD showed an increase in the absorbance of RH with a small blue shift (≈ 2 nm) of the λmax shown in Fig. 2a. The inclusion complex also showed an enhanced fluorescence (along with a ≈ 6 nm blue shift) of RH (Fig. 2b). Figure 2c and d show the SEM images of RH and RH-β-CD inclusion complex, respectively. The morphology of RH drastically changed due to the formation of the RH-β-CD inclusion complex. The clumps of non-uniform structures of the free RH changed to associated flakes due to complex formation with β-CD. There were no distinguishable substances with two different morphologies. The average 22-μm-long microstructures of the clustered RH changed into 1-μm flakes in the β-CD complex. Cyclodextrin plays a role in changing the morphology, possibly by separating the self-associated structures of RH, due to host–guest association. Due to variation in size between the clumped structures of free RH and its organized assembly inside cyclodextrin cavity in the complexed form, the size difference arises. The 1H NMR and 2D ROESY spectra were recorded to optimize the structure of the RH-β-CD inclusion complex (Fig. 3).
Fig. 2.

a Absorption spectra of raloxifene in the absence and presence of β-CD. b Fluorescence spectra of raloxifene in the absence and presence of β-CD. c Scanning electron microscopic image of raloxifene. d Scanning electron microscopic image of raloxifene-β-CD complex
Fig. 3.

2D ROESY spectra of raloxifene- β-CD complex
The 1H NMR chemical shifts of the RH–β-CD inclusion complex are given in Table 1. Figure 3 shows the 2D ROESY NMR spectrum of RH–β-CD inclusion complex. The 2D ROESY NMR spectrum suggested that there was formation of 1:1 inclusion complex of RH-β-CD. There were cross-correlated peaks observed for the interactions of protons viz., (i) hydroxyl protons of RH at positions 6 and 4 (resonated at 9.86 and 9.79 ppm in the abscissa) and the H 4 proton of β-CD (at 3.41 ppm in the ordinate). (ii) The same hydroxyl protons of RH showed cross peaks with the secondary hydroxyl groups of β-CD (assigned at 5.60 and 5.70 ppm in the ordinate). This result was supported by the molecular docking image of RH with β-CD (shown in Fig. 4a). An H-bond was evidently formed between the hydroxyl proton of RH and the secondary hydroxyl proton of β-CD, with a bond distance of 2.248 Å. (iii) An off-diagonal peak was found between 9.86 ppm and 4.58 ppm due to the signals of the hydroxyl proton of RH at position 6 with the primary hydroxyl proton of β-CD. This was evidently due to the close approach of benzothiophene hydroxyl proton to the primary hydroxyl proton of β-CD as shown in Fig. 4a. Moreover, off-diagonal cross-correlation peaks were observed (2.61 ppm along the x-axis and 3.65 ppm along the y-axis) due to the correlation of methylene protons (position 19) of RH (linking the phenoxy group and piperidine ring) with the H 2 of β-CD. This structure of the complex might be stabilized due to the formation of H-bond between the NH of piperidine and the secondary hydroxyl group of β-CD. The H-bond length was 1.961 Å as evident from docking. This orientation of H-bond is shown in Fig. 4a. Figure 4b and c show the mode of entry of the 1-(2-phenoxyethyl)piperidine moiety of RH into β-CD. The mode of interaction of RH with β-CD is shown in the docking poses. A possibility of three types of interaction, viz., hydrogen bonding, electrostatic, and hydrophobic interactions was inferred. The results of 2D ROESY were in accordance with the theoretical study regarding the position and orientation of RH with β-CD as shown in Fig. 4. The calculated bond length and breadth of RH using RasMol (Version 2.7.5.2) [31] are given in Fig. 1b.
Table 1.
1H NMR spectral data for RH– β-CD inclusion complex
| Protons | Position | Chemical shift (δ), ppm |
|---|---|---|
| Methylene protons | ||
| Methylene protons | 22 and 24 | 1.27 |
| Methylene protons | 23 | 1.76 |
| Methylene protons | 21 and 25 | 2.19 |
| Methylene protons | 19 | 2.61 |
| Methylene protons | 18 | 4.38 |
| Aromatic protons | ||
| Benzothiophene ring | 5 | 6.60 |
| Phenolic ring | 3 and 5 and 5
|
6.86 |
| Phenyl ring | 13 and 15 | 6.98 |
| Phenolic ring | 2 and 6 and 6
|
7.19 |
| Phenyl ring | 12 and 16 | 7.27 |
| Benzothiophene ring | 7 | 7.38 |
| Benzothiophene ring | 4 | 7.71 |
| Hydroxyl protons | ||
| Benzothiophenol | 6 | 9.86 |
| Phenol | 4
|
9.79 |
Fig. 4.

Docking poses of raloxifene with β-CD. a Hydrogen interaction, b electrostatic interaction, and c phobic interaction
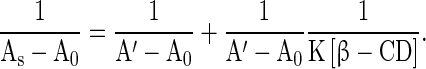
UV-Vis spectroscopy was used to find the interaction between RH and β-CD in solution. When the concentration of β-CD was varied from 0 to 8 × 10⁻³ mol dm −3, the absorption spectrum of RH (2.4 × 10⁻⁶ mol dm −3) showed a hyperchromic shift. The absorption maximum of was shifted to the blue region from 284 nm to 281 nm, with an increase in the added β-CD concentration (Fig. 5a). The absorption maximum and absorbance data are given in Table 2. A plot of 1/As–A 0vs. 1/[ β-CD] is shown in Fig. 5c. The observed absorption spectral data were used in (1),
 |
1 |
Here, A 0 is the absorbance of RH in water, Asis the absorbance at each concentration of β-CD, and A is the intensity of absorbance at the highest concentration of β-CD. K is the binding constant. Linearity was observed in the plot with the observed correlation coefficient (R) of 0.97, and it suggested that there was formation of a 1:1 complex of RH–β-CD. The calculated binding constant (K) was 2,862 mol−1 dm3 (correlation coefficient 0.97, standard deviation 0.27).
Fig. 5.

a Absorption spectra of raloxifene in the presence of various concentrations of β-CD. b Fluorescence spectra of raloxifene in the presence of various concentrations of β-CD. c Plot of 1/As-A0 against 1/[ β-CD] for the interaction of raloxifene in the presence of various concentrations of β-CD. d Plot of 1/I-I0 against 1/[ β-CD] for the interaction of raloxifene in the presence of various concentrations of β-CD
Table 2.
Absorption and fluorescence spectral data for the binding titration of RH with β-CD
| Concentration of | Absorption | Absorbance | Fluorescence |
|---|---|---|---|
| β-CD, mol dm −3 | Maxima (nm) | a. u. | Maxima (nm) |
| 0 | 284 | 0.061 | 411 |
| 1.0 × 10 −4 | 284 | 0.087 | 411 |
| 2.0 × 10 −4 | 284 | 0.102 | 410 |
| 4.0 × 10 −4 | 283 | 0.104 | 410 |
| 6.0 × 10 −4 | 283 | 0.130 | 408 |
| 8.0 × 10 −4 | 283 | 0.143 | 408 |
| 1.0 × 10 −3 | 282 | 0.146 | 408 |
| 2.0 × 10 −3 | 282 | 0.165 | 407 |
| 4.0 × 10 −3 | 281 | 0.174 | 406 |
| 8.0 × 10 −3 | 281 | 0.219 | 405 |
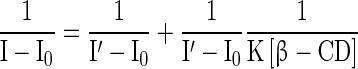
The changes in the fluorescence spectrum are more pronounced than in absorption when β-CD was added to RH. The intensity of fluorescence of RH was enhanced with each addition of β-CD. Also, the emission maximum λemi of RH-β-CD was blue-shifted (Fig. 5b and Table 2). The following Benesi–Hildebrand equation was followed by the fluorescence intensity observed at λemi, 411 nm to find the binding constant for the RH-β-CD inclusion complex [32]:
 |
2 |
In Eq. (2), I represents the intensity of fluorescence of RH at various concentrations of β-CD, I0 is the intensity of RH in water, I is the intensity at maximum concentration of β-CD, and K is the binding constant. The stoichiometry of the inclusion complex RH–β-CD, as inferred from the Benesi–Hildebrand plot, was 1:1 (in accordance with the UV-Vis absorption spectroscopic analysis) and the calculated binding constant was 2.81 × 10 4 mol −1 dm 3 (correlation coefficient 0.99, standard deviation 0.08) for RH–β-CD complex (Fig. 5c).
Binding of RH and ctDNA in the absence and the presence of β-CD
A binding titration of ctDNA (5.68 × 10⁻⁶ mol dm−3) against RH was carried out using UV-Vis absorption measurements. The absorption maximum, λmax, was observed at 260 nm (Fig. 6a). A red shift was observed when RH was added up to a concentration of 6 × 10⁻⁶ mol dm−3. There was also a hyperchromic effect i.e., an increase in the absorbance with an increase in the concentration of RH. This showed the binding affinity of RH for ctDNA. Moreover, the absorption maxima of RH found at 283 and 362 nm resulted in a ∼2 -nm blue shift by titration of RH with varying the concentration of ctDNA from 0 to 1.70 × 10⁻⁵ mol dm−3 (Fig. 7a). Fluorescence measurements were made to provide additional evidence of the interaction of RH with ctDNA by varying the concentration of ctDNA from 0 to 8.51 × 10⁻⁶ mol dm−3. The emission wavelengths (λemi) of RH were observed at 315 and 411 nm. The emission maximum shifted continually to the blue at each addition of ctDNA, to a final wavelength of 408 nm (Fig. 8a). ctDNA by itself has no measurable fluorescence in the region where the complex emits. Thus, the fluorescence was due to the RH complexed to ctDNA. The above observations might be due to the interaction between RH and the hydrophobic environment DNA. The Stern-Volmer quenching constant was calculated as 8.04 × 10 4 mol −1dm3 (correlation coefficient 0.98, standard deviation 0.20) from Fig. 8b by the observed fluorescence intensity at 411 nm. The following Stern-Volmer equation was used for studying the quenching of fluorescence [33]:
 |
3 |
where I 0 and I are the fluorescence intensities in the absence and presence of the quencher, respectively. KSV and [Q] are the Stern–Volmer quenching constant and the concentration of the quencher respectively.
Fig. 6.

a Absorption spectra of calf thymus DNA in the presence of various concentrations of raloxifene, b Absorption spectra of Methylene Blue-Calf thymus DNA in the presence of various concentrations of raloxifene
Fig. 7.

a Absorption spectra of raloxifene in the presence of various concentrations of ctDNA. b Absorption spectra of raloxifene-ctDNA in the presence of various concentrations of β-CD. Inset Plot of 1/A s-A 0 against 1/[β-CD] for the interaction of ctDNA interacted raloxifene in the presence of various concentrations of β-CD. c Absorption spectra of raloxifene- β-CD in the presence of various concentrations of ctDNA
Fig. 8.

a Fluorescence spectra of raloxifene in the presence of various concentrations ctDNA. b Plot of I0/I against [DNA] for the interaction of raloxifene in the presence of various concentrations of ctDNA, c Plot of log [F0-F]/F against log[Q] for the interaction of raloxifene in the presence of various concentrations of ctDNA
A competition for binding to ctDNA between RH and the dye Methylene Blue (MB) was studied. Methylene blue is known for its strong binding to ctDNA. Hence, we chose it as a competitive binder. Figure 6b shows the effect of competitive interaction between RH and the MB-ctDNA carried out by the addition of RH to a solution of Methylene Blue-bound DNA. The absorbance of the spectral band of MB-DNA at 662 nm did not significantly change with increasing RH concentration. An increase in the absorbance of MB-ctDNA was observed with the addition of RH. A new band between 350 and 400 nm appeared, which increased progressively in intensity with RH concentration. An isosbestic point appeared, suggesting that a new species, due to binding, was formed during the competitive interaction. The position of the band of RH in the absence and presence of DNA was not significantly altered, which suggested the occurrence of an electrostatic interaction of RH with the double helix of DNA. This was confirmed by molecular docking studies (shown in Fig. 9). The glide score observed for RH towards binding with DNA was –3.67. The nitrogen atom present in 1-(2-phenoxyethyl)piperidine and the phenolic oxygen atom of RH was involved in the hydrogen bonding with DNA. The benzothiophene moiety was found pointing away from the DNA. Moreover, the phenolic moiety of RH was highly involved in hydrophobic binding with DNA.
Fig. 9.
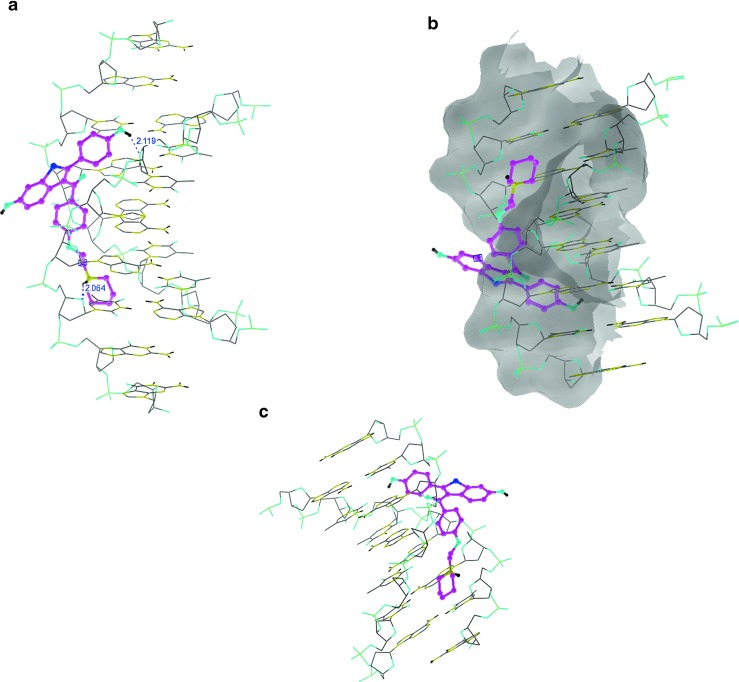
Docking poses of raloxifene with DNA. a Hydrogen interaction, b phobic interaction, c electrostatic interaction
Addition of β-CD to RH-ctDNA did not alter the absorption maximum of RH-ctDNA at 281 nm (Fig. 7b). Moreover, the fluorescence intensity of RH-ctDNA increased with an increase in the concentration of β-CD. This might be due to the binding of the available portion of RH outside the encapsulating β-CD molecule with ctDNA. The changes in the absorbance of RH-ctDNA with respect to the addition of β-CD were monitored and the stoichiometry of the RH–β-CD complex was determined as 1:1 with the binding constant of 775 mol−1 dm 3 (correlation coefficient 0.99, standard deviation 0.13, shown in the inset of Fig. 7b). The presence of ctDNA thus plays a role in the binding strength of inclusion -complex formation between RH and β-CD, and does not influence the stoichiometry of the inclusion complex. The concentration of RH and β-CD was fixed at 4 × 10⁻⁶ mol dm−3. Figure 7c shows the blue shift of RH-β-CD down to 280 nm, at the addition of ctDNA. Moreover, varying the concentration of ctDNA (from 0 to 8.51 × 10⁻⁶ mol dm−3) resulted in the quenching of fluorescence of the RH–β-CD system (Fig. 10a). The quenching occurs due to the decrease in the fluorescence quantum yield of RH due to binding interaction with DNA with the DNA acting as the quencher. The Stern–Volmer quenching constant was 8.19 × 10⁴ mol−1 dm3 (correlation coefficient 0.98, standard deviation 0.18, as shown in Fig. 10b). The quenching constant for RH-β-CD was in accordance with that of RH for ctDNA binding. Hence the part of the RH molecule (the 1-(2-phenoxyethyl)piperidine moiety) encapsulated by β-CD might not be affected on DNA binding. The phenolic moiety of RH interacted with DNA in the absence and presence of β-CD. The quenching constant for RH with DNA was not altered even in the presence of β-CD. Thus, β-CD act like a bangle wrapping around the 1-(2-phenoxyethyl)piperidine moiety during the binding with DNA. This binding also resulted in the enhancement of fluorescence of RH. It suggests that the encapsulation phenomenon may lead to increase in the bioavailability and aqueous solubility of RH when binding with DNA.
Fig. 10.

a Fluorescence spectra of raloxifene- β-CD in the presence of various concentrations ctDNA. b Plot of I/I against [DNA] for the interaction of raloxifene- β-CD in the presence of various concentrations of ctDNA. c Plot of log [F 0-F]/F against log[Q] for the interaction of raloxifene- β-CD in the presence of various concentrations of ctDNA
Addition of β-CD to RH-ctDNA did not alter the absorption maximum of RH-ctDNA at 281 nm (Fig. 7b). Moreover, the fluorescence intensity of RH-ctDNA increased with an increase in the concentration of β-CD. This might be due to the binding of the available portion of RH outside the encapsulating β-CD molecule with ctDNA. The changes in the absorbance of RH-ctDNA with respect to the addition of β-CD were monitored and the stoichiometry of the RH–β-CD complex was determined as 1:1 with the binding constant of 775 mol−1 dm 3 (correlation coefficient 0.99, standard deviation 0.13, shown in the inset of Fig. 7b). The presence of ctDNA thus plays a role in the binding strength of inclusion -complex formation between RH and β-CD, and does not influence the stoichiometry of the inclusion complex. The concentration of RH and β-CD was fixed at 4 × 10⁻⁶ mol dm−3. Figure 7c shows the blue shift of RH-β-CD down to 280 nm, at the addition of ctDNA. Moreover, varying the concentration of ctDNA (from 0 to 8.51 × 10⁻⁶ mol dm−3) resulted in the quenching of fluorescence of the RH–β-CD system (Fig. 10a). The quenching occurs due to the decrease in the fluorescence quantum yield of RH due to binding interaction with DNA with the DNA acting as the quencher. The Stern–Volmer quenching constant was 8.19 × 10⁴ mol−1 dm3 (correlation coefficient 0.98, standard deviation 0.18, as shown in Fig. 10b). The quenching constant for RH-β-CD was in accordance with that of RH for ctDNA binding. Hence the part of the RH molecule (the 1-(2-phenoxyethyl)piperidine moiety) encapsulated by β-CD might not be affected on DNA binding. The phenolic moiety of RH interacted with DNA in the absence and presence of β-CD. The quenching constant for RH with DNA was not altered even in the presence of β-CD. Thus, β-CD act like a bangle wrapping around the 1-(2-phenoxyethyl)piperidine moiety during the binding with DNA. This binding also resulted in the enhancement of fluorescence of RH. It suggests that the encapsulation phenomenon may lead to an increase in the bioavailability and aqueous solubility of RH when binding with DNA.
The binding constant K b and the number of binding sites n were determined by the observed fluorescence intensity at 411 nm on titration with ctDNA [34]. Equation (4) was utilized for the plotting of the double logarithm regression curve (Figs. 8 and 10c) of log (F 0-F/F) vs. log [Q], where F0 and F are the fluorescence intensities in the absence and presence of the quencher, respectively.
 |
4 |
The binding constant K b and the number of binding sites n for the interaction between RH and ctDNA in the absence and the presence of β-CD were determined from the plot with correlation coefficients of 0.99 and 0.96 respectively. The number of binding sites n calculated for RH and β-CD-bound RH with ctDNA was approximately 1. This suggested a 1:1 stoichiometry of binding of RH and RH-β-CD with ctDNA. Similar stoichiometry between the free and β-CD-encapsulated forms of RH complexed with DNA might be due to the similar mode of RH-ctDNA binding occurring in the absence and presence of β-CD. The binding constants K b of the binding of RH- and β-CD-complexed RH to ctDNA were 1.14 × 10⁴ and 1.65 × 10² mol−1 dm3, respectively. The lower binding constant of RH-β-CD-ctDNA might be due to the cleavage of RH from the DNA hydrophobic environment, competing with the inclusion complex formation with β-cyclodextrin. This process is schematically represented in the Fig. 11.
Fig. 11.

a Schematic representation of inclusion complexation of raloxifene with β-CD. b Schematic representation of binding of raloxifene with DNA. c Schematic representation of binding of raloxifene-β-CD inclusion complex with DNA. d Schematic representation of binding of Raloxifene complex with BSA. e Schematic representation of binding of raloxifene-β-CD inclusion complex with BSA
Fluorescence microscopy was used to view the interaction of RH with β-CD, ctDNA and β-CD-ctDNA systems. Figure 12 shows the interaction of RH with β-CD, ctDNA, and β-CD-ctDNA systems. The presence of β-CD resulted in an ordered organization of RH due to the holding of RH inside the cavity of β-CD. ctDNA, being non-fluorescent, shows the identity of RH in the absence and presence of β-CD in the fluorescence emission.
Fig. 12.

a Fluorescence microscopic image of raloxifene. b Fluorescence microscopic image of raloxifene-β-CD. c Fluorescence microscopic image of raloxifene-ctDNA. d Fluorescence microscopic image of raloxifene-ctDNA-β-CD
In conclusion, both from spectroscopy and molecular modelling, it was inferred that the structure of the inclusion complex formed between RH and β-CD might be as shown in Fig. 11a. The binding of RH to DNA in the absence and the presence of β-CD is schematically represented as given in Fig. 11b and c, respectively.
RH/β-CD complex–BSA binding
A spectral study of the interaction of RH with BSA has been reported [35]. We extended it to the binding of the RH-β-CD complex with BSA and analyzed the influence of β-CD on the binding. The absorption spectrum of BSA with different concentrations of RH–β-CD complex is shown in Fig. 13a. The absorption bands are red-shifted by 2 nm on binding with BSA, along with a hyperchromic shift. However, the absorbance increased, suggesting that binding with BSA occurred. The absorption and the fluorescence spectral data of RH–β-CD complex with BSA are given in Table 3. The fluorescence of BSA was quenched continuously with a red shift of 5 nm at the successive addition of RH–β-CD complex (as shown in Fig. 13b). As a considerable amount of fluorescence energy of the tryptophan residues in BSA is transferred to the RH, the fluorescence of the BSA is quenched with RH acting as the quencher. The energy transfer is discussed in the subsequent paragraphs. The fluorescence quenching mechanism between RH– β-CD complex and BSA was analyzed by using the Stern–Volmer Eq. (3). The Stern–Volmer plot for the quenching of fluorescence by RH– β-CD complex is shown in Fig. 13c. The calculated K SV was 9.55 × 10 4 mol −1 dm 3 (correlation coefficient 0.98, standard deviation 0.25).
Fig. 13.

a Absorption spectra of BSA in the presence of various concentrations of raloxifene-β-CD. b Fluorescence spectra of BSA in the presence of various concentrations of raloxifene-β-CD. c Plot of F0/F against [raloxifene- β-CD] for the interaction of BSA in the presence of various concentrations of raloxifene-β-CD. d Plot of log [F0-F]/F against log (1/[Dt]–(F0-F)/[Pt][F 0] for the interaction of BSA in the presence of various concentrations of raloxifene-β-CD
Table 3.
Absorption and fluorescence spectral data for the binding of RH/ β-CD with BSA
| Concentration of | Absorption | Absorbance | Fluorescence |
|---|---|---|---|
| RH (mol dm−3) | Maxima (nm) | a.u. | Maxima (nm) |
| 0 | 277 | 0.572 | 346 |
| 2.5 × 10⁻⁶ | 278 | 0.692 | 349 |
| 5.0 × 10⁻⁶ | 278 | 0.754 | 350 |
| 1.0 × 10⁻⁵ | 279 | 0.843 | 351 |
| 1.5 × 10⁻⁵ | 279 | 0.968 | 351 |
| 2.0 × 10⁻⁵ | 279 | 1.120 | 351 |
The binding constant for the binding of RH–β-CD complex with BSA was calculated from the plot (Fig. 13d) of log {1/[D t]-(F 0-F)[P t]/F 0} vs. log(F 0-F) following the Eq. (5).
 |
5 |
Here, F0 and F are the fluorescence intensities of BSA in the absence and presence of the quencher, respectively. [Dt] and [P t] are the total quencher concentration and the total BSA concentration, respectively. The linear plot of log (F0-F)/F vs. log (1/[Dt]–(F0-F)/[Pt]/[F0] is shown in Fig. 13d. The binding constant was calculated as 10.67 × 10⁴ mol −1 dm 3 and the number of binding site was 1.
There would be energy transfer between the tryptophan residues of BSA and the RH–β-CD complex in which BSA is acting as donor and the RH–β-CD complex as acceptor. This was estimated by Förster energy transfer theory. The overlap of the absorption spectrum of RH–β-CD complex and the fluorescence spectrum of BSA is shown in Fig. 14. The efficiency of energy transfer (E), binding distance (r) between the donor and the acceptor, and the critical distance (R0) were calculated using
 |
6 |
where, R 0 is the Förster distance when the efficiency of energy transfer is 50 % and r0 is the distance between the donor and the acceptor. R 0 was calculated using the equation:
 |
7 |
Here, n is the refractive index of the medium, Φ is the fluorescence quantum yield of the donor, κ2is the relative orientation of the donor and acceptor, and J(λ) is the overlap integral of the fluorescence spectrum of the donor and the absorption spectrum of the acceptor. J(λ), the overlap integral is given by
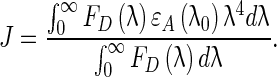 |
8 |
In the above equation FD (λ) refers to the corrected fluorescence intensity of the donor between the wavelengths λ and (λ+Δλ), and εA (λ) is the molar extinction coefficient of the acceptor at the wavelength λ. Random orientations of the donor and the acceptor were assumed. The results obtained were N = 1.33, Φ= 0.15, J = 6.0629 × 10 −20 cm 3 mol−1 dm3, E = 0.1054, R0= 3.4564 nm, and r = 4.9365 nm. The donor–to–acceptor distance was 4.9365 nm which confirmed that static quenching occurred with the energy transfer from BSA to RH–β-CD complex.
Fig. 14.

Spectral overlapping between the UV absorption spectrum of raloxifene and the fluorescence spectrum of BSA
The apparent binding constant and the number of binding sites for the binding of RH with BSA in aqueous solution were 2.33 × 10⁵ mol −1 dm−3 and 1.68 as obtained from the Stern-Volmer equation [24]. This was significantly decreased (9.55 × 10 4 mol −1 dm3) in the presence of β-CD. It follows that the site of RH encapsulated by β-CD might have a role in binding with BSA. Shielding by β-CD decreased the affinity of binding of RH with BSA. Moreover, the number of binding sites was decreased from 1.68 to 1. However, the donor-to-acceptor distance remained almost the same in the presence and the absence of β-CD. The above discussion on the binding of RH with BSA in the absence and the presence of β-CD results in the schematic representation as given in Fig. 11d and e.
Conclusions
The capping agent β-CD influences the binding of the small molecule RH with biological macromolecules such as DNA and BSA significantly. The part of the RH molecule, i.e., the 1-(2-phenoxyethyl)piperidine moiety, encapsulated by β-CD, is not affected on binding with DNA or BSA. Thus, β-CD acts like a bangle wrapping around the 1-(2-phenoxyethyl)piperidine moiety during its binding with macromolecules. Due to the encapsulation of 1-(2-phenoxyethyl)piperidine moiety by β-CD, the affinity of RH towards BSA is decreased. β-CD can be used to tune RH by blocking a part of the drug for binding with macromolecules. This kind of study can aid (1) the comprehension of the site of binding of small molecules with the macromolecular targets, (2) the development of methods to increase the fluorescence efficiency/aqueous solubility/bioavailability of small molecules by complexation with β-CD and (3) the identification of mechanisms for tuning the binding properties of small molecules to macromolecule using host molecules such as β-CD.
Acknowledgments
This work was financially supported by the SERB–Department of Science and Technology (DST), Government of India (Project file: SR/FT/CS-062/2009). We express our sense of gratitude to the DST. We extend our thanks to SAIF, Indian Institute of Technology–Madras, Chennai, for the help in NMR measurements.
References
- 1.Jordan VC. Selective estrogen receptor modulation: concept and consequences in cancer. Canc. Cell. 2004;5:207–213. doi: 10.1016/S1535-6108(04)00059-5. [DOI] [PubMed] [Google Scholar]
- 2.Jeffrey WM, Skerjanec A, Knadler MP, Ghosh A, Sandra RBA. Divergent effects of raloxifene HCl on the pharmacokinetics and pharmacodynamics of Warfarin. Pharma. Res. 2001;18:1024–1028. doi: 10.1023/A:1010904815275. [DOI] [PubMed] [Google Scholar]
- 3.Olevsk O, Martino S. Randomized clinical trials of raloxifene: reducing the risk of osteoporosis and breast cancer in postmenopausal women. Menopause. 2008;15:790–796. doi: 10.1097/gme.0b013e31817e6683. [DOI] [PubMed] [Google Scholar]
- 4.Stepan JJ, Alenfeld F, Boivin G, Feyen JHM, Lakatos P. Mechanisms of action of antiresorptive therapies of postmenopausal osteoporosis. Endocr. Regul. 2003;37:227–240. [PubMed] [Google Scholar]
- 5.Mamta K, Susan H, Powel B. Defining the role of raloxifene for the prevention of breast cancer. J. Natl. Canc. Inst. 2004;96:1731–1733. doi: 10.1093/jnci/djh345. [DOI] [PubMed] [Google Scholar]
- 6.Craig VJ, Monica M. Tamoxifen, raloxifene, and the prevention of breast cancer. Endocr. Rev. 1999;20:253–278. doi: 10.1210/edrv.20.3.0368. [DOI] [PubMed] [Google Scholar]
- 7.Bryant H, Glasebrook A, Yang N, Sato M. An estrogen receptor basis for raloxifene action in bone. J. Steroid Biochem. Mol. Biol. 1999;69:37–44. doi: 10.1016/s0960-0760(98)00147-2. [DOI] [PubMed] [Google Scholar]
- 8.Black L, Goode R. Uterine bioassay of Tamoxifen, Trioxifene and a new estrogen antagonist (Ly117018) in rats and mice. Life Sci. 1980;26:1453–1458. doi: 10.1016/0024-3205(80)90049-1. [DOI] [PubMed] [Google Scholar]
- 9.Fermeglia M, Ferrone M, Lodi A, Pricl S. Host–guest inclusion complexes between anticancer drugs and ##β##-cyclodextrin: computational studies. Carbohyd. Polym. 2003;53:15–44. doi: 10.1016/S0144-8617(03)00011-0. [DOI] [Google Scholar]
- 10.Kohler G, Grabner G, Klein CT, Marconi G, Mayer B, Monti S, Rechthaler K, Rotkiewicz K, Viernstein H, Wolschann P. Structure and spectroscopic properties of cyclodextrin inclusion complexes. J. Incl. Phenom. Mol. Recognit. Chem. 1996;25:103–108. doi: 10.1007/BF01041546. [DOI] [Google Scholar]
- 11.Rui Z, Tianwei T, Corine S. NMR studies on puerarin and its interaction with ##β##-Cyclodextrin. J. Biol. Phys. 2011;37:387–400. doi: 10.1007/s10867-011-9221-0. [DOI] [PMC free article] [PubMed] [Google Scholar]
- 12.El-Shishtawy RM, Oliveira AS, Almeida P, Ferreira DP, Conceiçao DS, Ferreira LFV. Photophysical studies of a new water-soluble indocarbocyanine dye adsorbed onto microcrystalline cellulose and ##β##-cyclodextrin. Molecules. 2013;18:5648–5668. doi: 10.3390/molecules18055648. [DOI] [PMC free article] [PubMed] [Google Scholar]
- 13.Upadhyay SK, Ali SM. Solution structure of loperamide and ##β##-cyclodextrin inclusion complexes using NMR spectroscopy. J. Chem. Sci. 2009;121:521–527. doi: 10.1007/s12039-009-0063-2. [DOI] [Google Scholar]
- 14.Enoch IVMV, Yousuf S. ##β##-Cyclodextrin inclusion complexes of 2-hydroxyfluorene and 2-hydroxy-9-fluoreneone: differences in stoichiometry and excited state prototropic equilibrium. J. Solut. Chem. 2013;42:470–484. doi: 10.1007/s10953-013-9965-1. [DOI] [Google Scholar]
- 15.Dillingham MS, Tibbles KL, Hunter JL, Bell JC, Kowalczykowski SC, Webb MR. Fluorescent single-stranded DNA binding protein as a probe for sensitive, real-time assays of helicase activity. Biophys. J. 2008;95:3330–3339. doi: 10.1529/biophysj.108.133512. [DOI] [PMC free article] [PubMed] [Google Scholar]
- 16.Williams AK, Desilva SC, Bhatta A, Rawal B, Liu M, Korobkovam EA. Determination of the drug–DNA binding modes using fluorescence-based assays. Anal. Biochem. 2012;422:66–73. doi: 10.1016/j.ab.2011.12.041. [DOI] [PubMed] [Google Scholar]
- 17.Neefjes J, Dantuma NP. Fluorescent probes for proteolysis: tools for drug discovery. Nat. Rev. Drug Disco. 2004;3:58–69. doi: 10.1038/nrd1282. [DOI] [PMC free article] [PubMed] [Google Scholar]
- 18.Dineshkumar B, Vigneshkumar P, Bhuvaneshwaran SP, Mitra A. Advanced drug designing softwares and their applications in medical research. Int. J. Pharm. Pharm. Sci. 2010;2:16–18. [Google Scholar]
- 19.Ling YZ, Yan JJ, Jun PZBL. ##β##-Cyclodextrin inclusion complex: preparation, characterization, and its aspirin release in vitro. Front. Mater. Sci. 2012;6:259–267. doi: 10.1007/s11706-012-0176-2. [DOI] [Google Scholar]
- 20.Dua K, Pabreja K, Ramana MV, Lather V. Dissolution behavior of ##β##-cyclodextrin molecular inclusion complexes of aceclofenac. J. Pharm. Bioallied. Sci. 2011;3:417–425. doi: 10.4103/0975-7406.84457. [DOI] [PMC free article] [PubMed] [Google Scholar]
- 21.Lin SY, Kao YH. Solid particulates of drug-##β##-cyclodextrin inclusion complexes directly prepared by a spray-drying technique. Int. J. Pharm. 1989;56:249–259. [Google Scholar]
- 22.Martin Del Valle EM. Cyclodextrins and their uses: a review. Proc. Biochem. 2004;39:1033–1046. doi: 10.1016/S0032-9592(03)00258-9. [DOI] [Google Scholar]
- 23.Bischoff G, Hoffmann S. DNA-binding of drugs used in medicinal therapies. Curr. Med. Chem. 2002;9:312–348. doi: 10.2174/0929867023371085. [DOI] [PubMed] [Google Scholar]
- 24.Gurova K. New hopes from old drugs: revisiting DNA-binding small molecules as anticancer agents. Futur. Oncol. 2010;5:1685–1704. doi: 10.2217/fon.09.127. [DOI] [PMC free article] [PubMed] [Google Scholar]
- 25.Ridler PJ, Jennings BR. Electro-optical fluorescence studies on the DNA binding of medically active drugs. Phys. Med. Biol. 1983;28:625–632. doi: 10.1088/0031-9155/28/6/002. [DOI] [PubMed] [Google Scholar]
- 26.Zdenek M, Stephen N, Bohdan S. Protein and drug interactions in the minor groove of DNA. Nucl. Acid. Res. 2002;30:1182–1191. doi: 10.1093/nar/30.5.1182. [DOI] [PMC free article] [PubMed] [Google Scholar]
- 27.Schrödinger Software: Glide, A Complete Solution for Ligand Receptor Docking [Computer Software]. Schrödinger, LLC, Portland, OR, USA (2009)
- 28.Friesner RA, Banks JL, Murphy RB, Halgren TA, Klicic JJ, Mainz DT, Repasky MP, Knoll EH, Shelley M, Perry JK, Shaw DE, Francis P, Shenkin PS. Glide: a new approach for rapid, accurate docking and scoring. 1. Method and assessment of docking accuracy. J. Med. Chem. 2004;25:1739–1749. doi: 10.1021/jm0306430. [DOI] [PubMed] [Google Scholar]
- 29.Enoch IVMV, Swaminathan M. Fluorimetric study on molecular recognition of ##β##-cyclodextrin with 2-amino-9-fluorenone. J. Fluoresc. 2006;16:501–510. doi: 10.1007/s10895-006-0074-z. [DOI] [PubMed] [Google Scholar]
- 30.Lakowicz, J.R.: Principles of Fluorescence Spectroscopy, 3rd ed., pp 280–281. Springer (2006)
- 31.Bernstein, H.J.: RasMol 2.7.5.2. Molecular Graphics Visualisation Tool. Based on RasMol 2.6 by Roger Sayle Biomolecular Structures Group Glaxo Wellcome Research & Development, Stevenage, Hertfordshire, UK (2011)
- 32.Lu Y, Wang GK, Lv J, Zhang GS, Liu QF. Study on the interaction of an anthracycline disaccharide with DNA by spectroscopic techniques and molecular modeling. J. Fluoresc. 2011;21:409–414. doi: 10.1007/s10895-010-0729-7. [DOI] [PubMed] [Google Scholar]
- 33.Li X, Yan S, Zhang Y, Ye L. Study on the interaction of raloxifene and bovine serum albumin by the Tachiya model. J. Solut. Chem. 2010;39:1187–1199. doi: 10.1007/s10953-010-9571-4. [DOI] [Google Scholar]
- 34.Sameena Y, Enoch IVMV. Binding interactions of naringenin and naringin with calf thymus DNA and the role of ##β##-cyclodextrin in the binding. AAPS Pharm. Sci. Tech. 2013;14:770–781. doi: 10.1208/s12249-013-9963-z. [DOI] [PMC free article] [PubMed] [Google Scholar]
- 35.Lu Y, Lv J, Zhang G, Wang G, Liu Q. Interaction of an anthracycline disaccharide with ctDNA: investigation by spectroscopic technique and modeling studies. Spectrochim. Acta A: Mol Biomol Spectrosc. 2010;75:1511–1515. doi: 10.1016/j.saa.2010.02.008. [DOI] [PubMed] [Google Scholar]