Abstract
Near-Infrared frequency-domain technologies, such as Diffuse Optical Spectroscopy (DOS), have demonstrated growing potential in a number of clinical applications. The broader dissemination of this technology is limited by the complexity and cost of instrumentation. We present here a simple system constructed with off-the-shelf components that utilizes undersampling for digital frequency-domain dDOS measurements. Broadband RF sweeps (50–300 MHz) were digitally sampled at 25 MSPS; amplitude, phase, and optical property extractions were within 5% of network analyzer derived values. The use of undersampling for broad bandwidth dDOS provides a significant reduction in complexity, power consumption, and cost compared with high-speed ADCs and analog techniques.
The clinical utility of quantitative tissue optical property determination is becoming increasingly recognized in the medical field.1 In the near-infrared (NIR) wavelength band (650–1000 nm), knowledge of optical properties, including the absorption coefficient (μa) and the reduced scattering coefficient (μs`), at multiple wavelengths, allows for the determination of molar tissue concentrations of endogenous chromophores including oxy and deoxyhemoglobin, water, and fat. These can then be used as markers for a variety of clinical pathologies including the detection and monitoring of tumors during treatment,2,3 cerebral hemodynamics,4 and others.
Frequency-domain Diffuse Optical Spectroscopy (DOS) and Tomography (DOT) methods utilize intensity modulated light sources in the RF frequency range, typically between 50 MHz and 1 GHz. When incident on multiple-scattering media, the resultant light propagates as a diffusive wave with a coherent front, called a photon density wave (PDW). The amplitude and phase of detected PDWs can be used to extract μa and μs` through the use of an inverse model based on the diffusion approximation to the radiative transfer equation.5 Research groups developing DOS and DOT systems use different instrumentation strategies, with some utilizing one or a few modulation frequencies,6,7 and others utilizing a sweep in order to improve model fitting.5 To date, almost all devices have utilized analog technologies to extract amplitude and phase measurements of detected PDWs, with the most common methods being homodyne and heterodyne detection. The cost and/or difficulty in constructing these devices, which require expensive components (e.g., a Vector Network Analyzer) or custom analog electronics, limits the expansion and dissemination of this technology. In an effort to address these limitations, a small number of research groups including our own have recently demonstrated digital continuous wave (CW) or frequency-domain DOS techniques (dDOS).8–10 Our previous dDOS method used a direct digital synthesis (DDS) integrated circuit (IC) for RF signal generation and a two-channel 12-bit 1.8 gigasample-per-second (GSPS) ADC. At the time of publication, this sampling rate was the state-of-the-art for 12-bit ADC technology and was chosen to ensure the sampling rate was at least 2X higher than the sampled RF signals. High accuracy and precision DOS measurements were available using this setup, but the ADC cost was relatively high (∼$5k US) and the digital backend needed to handle high data transfer rates limited opportunities to reduce system complexity. In an attempt to reduce future device cost and complexity, as well as to provide a blueprint for those interested in fabricating a dDOS system using off-the-shelf components, we explore here, for the first time, extending digital undersampling up to the 25th Nyquist zone for broad bandwidth dDOS. We characterize the system in the context of previous devices.
A Texas Instruments ADS62P49 dual channel 14-bit, 250 MSPS pipeline ADC with a 700 MHz analog input bandwidth and a 2Vpk-pk input voltage range was chosen for this device. This ADC was chosen because of its large analog bandwidth, relatively high bit depth, modest cost (∼$250 for the evaluation module or IC), and its potential for incorporation in future point-of-care (POC) devices due in part to its modest sampling rate. An evaluation module incorporating the ADC (ADS62P49EVM) was coupled with a low-cost data capture board (TSW1405EVM) that utilizes a Lattice ECP3 Field Programmable Gate Array (FPGA) to format the digitized low-voltage differential signaling (LVDS) data stream from the ADC for storage on onboard RAM, and then to read data from memory and transmit it over a USB connection to the host computer. The sampling rate is controlled with an external clock source. A custom Labview based GUI was used to communicate with the data capture board and perform repeated captures.
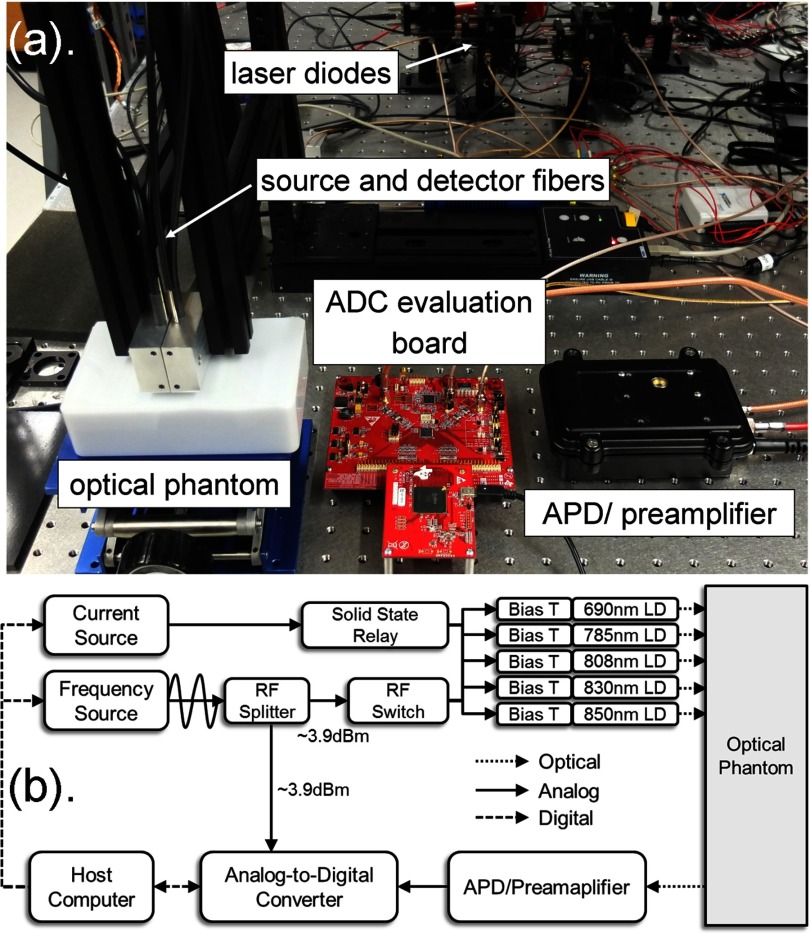
The accuracy and precision of amplitude, phase, and optical property measurements was compared with a gold-standard network analyzer based DOS system.5 For all measurements, a frequency sweep from 50–300 MHz in 4 MHz increments was conducted at a sampling rate of 25 MHz. Data points collected at modulation frequencies that were integer multiples of the Nyquist frequency were discarded. The most important system component and a block diagram of the experimental setup is shown in Figure 1. A RF signal generator (Rohde and Schwarz SMIQ03B, Munich, Germany) produced a 7.8 dBm source signal which was routed through a 50/50 RF splitter to the reference channel of the ADC and to a SP6T digitally controlled RF switch (HMC252QS24, Hittite Microwave Corp., Chelmsford, MA). The RF switch routed the signal to one of five laser diode modules (LDM9T, Thorlabs Inc., Newton, NJ). DC current was provided by a laser driver (ILX Lightwave LDX-3525B, Newport Optics, Irvine, CA); DC and AC power were combined with a bias tee integrated in the laser module. Five laser diodes with wavelengths of 690, 785, 808, 830, and 850 nm were used; typical DC optical output was ∼10–20 mW (all laser diodes were purchased from Thorlabs Inc.). Each laser was coupled to a 400 μm core optical fiber and the five fibers were bundled and routed to a silicon optical phantom with known optical properties. A 3 mm core detector fiber was coupled to a 3 mm avalanche photodiode (APD) (S11519-30, Hamamatsu, Japan). A 20 mm source-detector center-to-center spacing was used between the source bundle and detector fiber. A custom RF preamplifier was used prior to inputting the signal into the sample channel of the ADC. Commercially available APD preamplifiers such as Hamamatsu C5658 also work well for this application. A custom Labview GUI was used to control the system and communicate between the signal generator, ADC, DC laser diode current controller and the RF switch. For this proof-of-concept setup, acquisition times were limited by the relatively slow communication protocols between the host computer and the ADC, with a typical sweep at one wavelength taking 8 min. Sample lengths of 32 768 were collected for all measurements.
FIG. 1.
Picture of core dDOS components (a) and system diagram (b).
Amplitude and phase are presented as calibrated values taken from a silicone-based tissue-simulating phantom. Calibration accounts from the instrument response and is performed using a second optical phantom with known optical properties. Optical properties were computed by fitting amplitude and phase data to an analytical light propagation model based on the diffusion equation in radiative transfer with semi-infinite boundary conditions.5,11
The phase and amplitude of the signal-of-interest at each modulation frequency was determined for both the sample and reference channel signals using a Fast Fourier Transform (FFT) with a rectangular window. The dual channel ADC collects data simultaneously from each channel at the sampling edge of the system clock, allowing phase measurements to be compared between the channels. The aperture delay matching between the two channels is ±50 ps. The phase difference and the amplitude quotient between the sample and reference channels were used as inputs to the model.
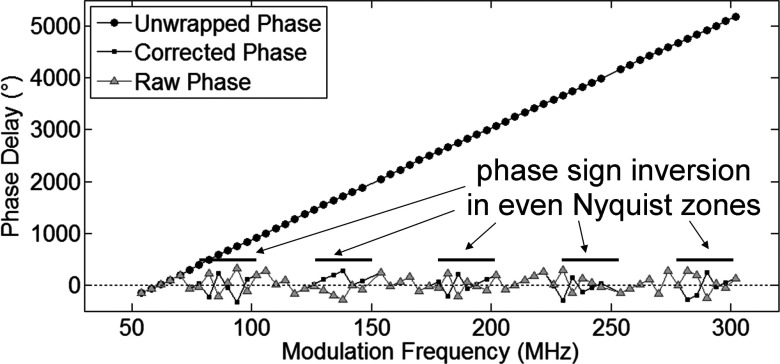
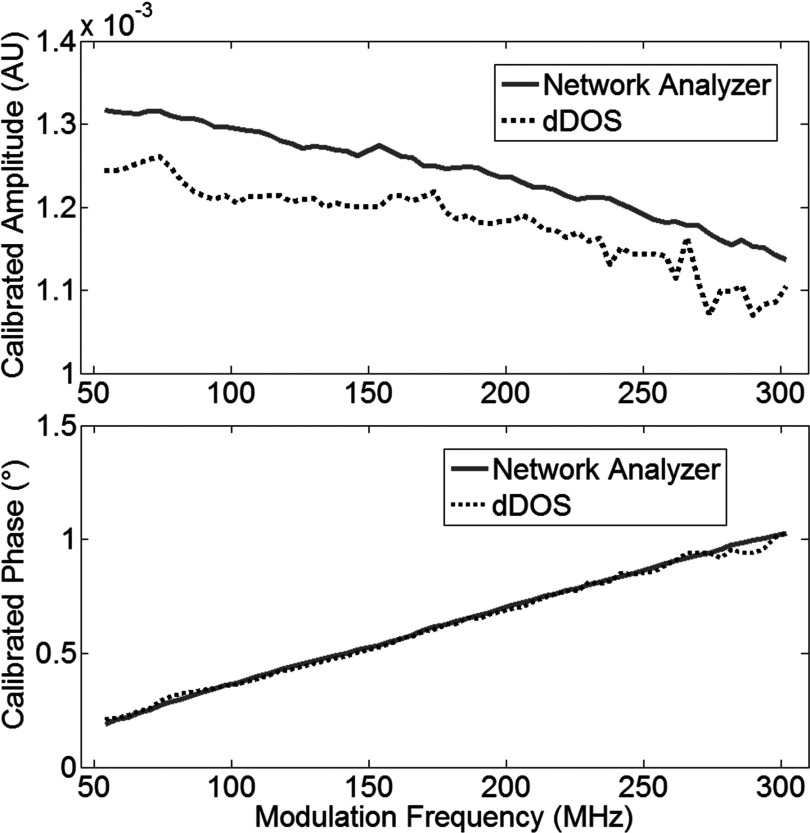
A simple correction algorithm was used during post-processing to correct the phase of undersampled signals. In the second Nyquist zone (0.5 fsampling – fsampling), and each subsequent even Nyquist zones (the 4th, 6th,..), the sign of the phase delay was reversed. In the third Nyquist zone (fsampling – 1.5fsampling), and each subsequent odd Nyquist zones the phase was not altered. The corrected phase was then unwrapped. An example of raw and corrected phase using a 50 MHz sampling rate is shown in Figure 2. No undersampling correction was necessary for amplitude measurements. Figure 3 shows example amplitude and corrected phase measurements taken on an optical phantoms using a 785 nm laser diode.
FIG. 2.
Example figure of raw, corrected, and unwrapped corrected phase for a frequency sweep collected using a 50 MHz sampling rate.
FIG. 3.
Example amplitude and phase measurements.
For evaluation of accuracy, the average of ten repeated dDOS sweeps was compared with the average of ten repeated network analyzer measurements. For precision measurements, the standard deviation of the measurements was computed. Accuracy and precision were determined for both amplitude and phase at each modulation frequency, then averaged for each wavelength, and then averaged for the whole system. Accuracy and precision of optical properties were determined at each wavelength and then averaged to demonstrate overall system performance. Table I shows results from the current undersampling dDOS system and the 1st generation dDOS system.8 Values for both systems are comparable and with 5% of network analyzer derived values.
Table I.
A comparisons of the 1st generation dDOS system and the undersampling dDOS system.
| 1st generation | Undersampling | |||
|---|---|---|---|---|
| dDOS:1.8 GSPS (Ref. 8) | dDOS 25 MSPS | |||
| Error | Std. dev. | Error | Std. dev. | |
| Amplitude | 1.44% | 1.02% | 4.42% | 3.62% |
| Phase | 0.32% | 0.59° | 0.023° | 0.02% |
| μa(mm-1) | 3.60% | 3.80% | 4.87% | 1.86% |
| μs′(mm-1) | 2.80% | 2.00% | 1.90% | 2.30% |
The system demonstrated here required no custom PCBs and can be built using off-the-shelf components and evaluation boards. This is possible because of the relatively straightforward direct-sampling method, which requires no external sources or ICs for frequency mixing or IQ demodulation. The performance was comparable to our previous work using 1.8 GHz digital oversampling method, and greatly reduces requirements on future hardware designs, power consumption, and cost. The slower sampling rates reduce concerns related to coupling the LVDS ADC outputs to a FPGA, which require very careful PCB layouts and signal routing at high data transfer speeds in order to avoid marginal capture issues. The power consumption of the ADS62P49 at the 25 MHz sampling rate is more than 7 times lower than the 1.8 GHz system (∼0.6 W compared to ∼4.4 W) and the cost of the ADC IC is ∼20X less than the 1.8 GHz ADC. Additionally, the ADC used here is 14-bit (compared to 12-bit for the 1.8 GHz system).
There are currently few other published works utilizing digital frequency-domain methodologies. Most notably, Weigel et al. demonstrated a three wavelength, single modulation frequency digital system with a 16-bit ADC and a sampling frequency of 72 MHz. A 0.1 dB and 0.25° standard deviation in amplitude and phase measurements were achieved during a drift test with good agreement in optical property extractions.9 Lasker et al. demonstrated a digital system that uses continuous wave tomographic methods with low frequency lock-in detection.10 Our device compares favorably to these instruments, and is the first to use undersampling for broad bandwidth measurements. It does have the limitation of slow measurement speed, which was several minutes per sweep. This issue may be reduced somewhat by decreasing the captured signal length and narrowing the bandwidth of frequency sweeps; we recently demonstrated that 50–150 MHz sweeps provided optical property extractions within 3.8% of 50–300 MHz sweeps.12 Acquisition time may not be a major concern for benchtop and laboratory systems, but clinical systems will require better integration between hardware components to achieve faster acquisition times. Overall, the developments shown here pave the way for future hardware implementations that optimize cost effectiveness, power consumption, and device complexity towards POC applications.
Acknowledgments
This work was supported in part by the National Cancer Institute U54 Center for Future Technologies in Cancer Care (CFTCC) Innovation Fellowship and a Boston University Undergraduate Research Opportunities Program (UROP) student award.
REFERENCES
- 1.Tromberg B. J., Pogue B. W., Paulsen K. D., Yodh A. G., Boas D. A., and Cerussi A. E., Med. Phys. 35(6), 2443–2451 (2008). 10.1118/1.2919078 [DOI] [PMC free article] [PubMed] [Google Scholar]
- 2.Pogue B. W., Poplack S. P., Mcbride T. O., Wells W. A., Osterman K. S., Osterberg U. L., and Paulsen K. D., Radiology 218(1), 261–266 (2001). 10.1148/radiology.218.1.r01ja51261 [DOI] [PubMed] [Google Scholar]
- 3.Roblyer D., Ueda S., Cerussi A., Tanamai W., Durkin A., Mehta R., Hsiang D., Butler J. A., Mclaren C., Chen W. P., and Tromberg B., Proc. Natl. Acad. Sci. U.S.A. 108(35), 14626–14631 (2011). 10.1073/pnas.1013103108 [DOI] [PMC free article] [PubMed] [Google Scholar]
- 4.Yu G., Durduran T., Furuya D., Greenberg J. H., and Yodh A. G., Appl. Opt. 42(16), 2931–2939 (2003). 10.1364/AO.42.002931 [DOI] [PubMed] [Google Scholar]
- 5.Pham T. H., Coquoz O., Fishkin J. B., Anderson E., and Tromberg B. J., Rev. Sci. Instrum. 71(6), 2500–2513 (2000). 10.1063/1.1150665 [DOI] [Google Scholar]
- 6.Culver J. P., Choe R., Holboke M. J., Zubkov L., Durduran T., Slemp A., Ntziachristos V., Chance B., and Yodh A. G., Med. Phys. 30(2), 235–247 (2003). 10.1118/1.1534109 [DOI] [PubMed] [Google Scholar]
- 7.Pogue B., Testorf M., Mcbride T., Osterberg U., and Paulsen K., Opt. Exp. 1(13), 391–403 (1997). 10.1364/OE.1.000391 [DOI] [PubMed] [Google Scholar]
- 8.Roblyer D., O'sullivan T. D., Warren R., and Tromberg B., Meas. Sci. Technol. 24(4), 045501 (2013). 10.1088/0957-0233/24/4/045501 [DOI] [PMC free article] [PubMed] [Google Scholar]
- 9.Weigel U. M., Revilla R., Oliverio N. H., Gonzalez A. A., Cifuentes J. C., Zirak P., Saiz R., Mitrani D., Ninou J., Casellas O., and Durduran T., OSA Technical Digest (Optical Society of America, Miami, FL, 2012). [Google Scholar]
- 10.Lasker J. M., Masciotti J. M., Schoenecker M., Schmitz C. H., and Hielscher A. H., Rev. Sci. Instrum. 78(8), 083706 (2007). 10.1063/1.2769577 [DOI] [PubMed] [Google Scholar]
- 11.Haskell R. C., Svaasand L. O., Tsay T. T., Feng T. C., and Mcadams M. S., J. Opt. Soc. Am. A 11(10), 2727–2741 (1994). 10.1364/JOSAA.11.002727 [DOI] [PubMed] [Google Scholar]
- 12.Jung J., Istfan R., and Roblyer D., “Effect of modulation frequency bandwidth on measurement accuracy and precision for digital diffuse optical spectroscopy (dDOS),” Proc. SPIE 8936, Design and Quality for Biomedical Technologies VII, 89360K (March 4, 2014). 10.1117/12.2040582 [DOI] [Google Scholar]


