Abstract
Coarse graining of membrane simulations by translating atomistic dynamics to densities and fields with Milestoning is discussed. The space of the membrane system is divided into cells and the different cells are characterized by order parameters presenting the number densities. The dynamics of the order parameters are probed with Milestoning. The methodology is illustrated here for a phospholipid membrane system (a hydrated bilayer of DOPC (1,2-dioleoyl-sn-glycero-3-phosphocholine) lipid molecules). Significant inhomogeneity in membrane internal number density leads to complex free energy landscape and local maps of transition times. Dynamics and distributions of cavities within the membrane assist the permeation of nonpolar solutes such as xenon atoms. It is illustrated that quantitative and detailed dynamics of water transport through DOPC membrane can be analyzed using Milestoning with fields. The reaction space for water transport includes at least two slow variables: the normal to the membrane plane, and the water density.
I. INTRODUCTION
Biological membranes are critical components of living systems and have attracted considerable body of simulation work.1–20 The simulations provide atomically detailed pictures of membrane statics and dynamics, and of the interactions of the membrane with other molecules. Of interest to the present article are permeability and insertion of medium size molecules into bilayers.12,13,16,20–35 Passive transport (without involving cellular machinery such as pumps) is an important biological process in cellular biology. At the least, living system must adapt to minimize this type of process for invading or not losing materials.
These simulations provide considerable insight, however, they are also challenging due to the broad range of temporal and spatial scales of membrane processes. The time scales of local membrane motions extend from picoseconds (local diffusion of a single phospholipid molecule36,37) to hours (e.g., a flip of a phospholipid molecule from one side of the membrane to the other38,39). Between these extreme limits of time scales one finds collective diffusion of lipids in the membrane plane,40 large scale bending,41 and more.42 This broad time scale makes it difficult to sample the appropriate motions of membranes using straightforward Molecular Dynamics (MD) simulations. This is the case even if periodic boundary conditions of small membrane patches are used.41 While it is not clear how the slow motions are coupled to permeation the existence of extremely broad range of permeation times (from microseconds to hours43) suggests that such coupling is likely. Of course motions on much larger spatial scales than the size of a single molecule are also possible and they make MD simulations even more challenging.
It is therefore not a surprise that many simulations of membranes stop at the qualitative level. It is also not surprising that collective large-scale dynamics of membranes is typically described at the continuum elastic limit.44–47 However, coupling molecular permeation to the continuum limit is challenging. Another approach to simplify simulations of membranes is to coarse-grain their representation. This approach has gained in popularity48–53 and enabled significant enhancement in sampling. The coarse-grained models are frequently based on collecting a group of atoms into a single point mass. From the perspective of this paper they focus on reproducing equilibrium behavior and are not calibrated for kinetics. The present paper outlines a coarse-grained scheme to compute membrane dynamics with a focus on time dependent phenomena.
We consider permeation through and insertion of medium size molecules to membranes. Marrink and Berendsen led the field of computer modeling of molecular permeation in their pioneering work of molecular translocation through membrane.2,54 They computed the potential of mean force and the diffusion constant of small molecules as a function of the permeant center of mass position across the membrane. These functions were used to compute the permeation coefficient that compared favorably with experiment.54 Others used this approach extensively to investigate other membrane-permeant systems.12,16,28,30,55–58 The assumption is that only the motion of the permeant along the z axis (normal to the membrane) is slow. The rest of the variables are assumed to be in thermal equilibrium on the time scale of permeation. We show in this article that this assumption needs to, and can be improved.
When medium size molecules are considered, the permeation mechanism becomes more complex. The permeant translocation is likely to depend on molecular orientation and its internal degrees of freedom (such as rotations around bonds). We59 and others27,60–62 have examined the impact of permeant degrees of freedom on movement through membranes. However, we illustrated recently59 that even with a set of coarse variables describing the important degrees of freedom of the permeant, hidden coarse variables remain. We hypothesize that the missing order parameters are associated with the membrane itself.
A hypothesis that we explore here is that membrane atomic density is a relevant coarse variable for permeation. Relaxations of phospholipid molecules may be necessary to create the space for the permeant to “walk” through, via cavity-assisted-diffusion. Thermal contributions to these fluctuations can be exceedingly slow as membrane dynamics spans long time scales.40,42 Previous simulation studies have characterized some equilibrium properties like shape and size of membrane voids63–65 but there is no direct information on the time scales of cavity formation in lipids. In the limit of very long relaxation times the permeant may see a “frozen” set of lipid configurations and frozen distribution of cavities. An average over the set of frozen membrane configurations is required to obtain macroscopic observables of the permeation process. Each member of an ensemble of permeants is passing through a slightly different “frozen” membrane. On the other hand, the translocation process that we examine in the past66 is exceptionally long (hours). On this time scale we expect many of the dynamic fluctuations of the lipids, which are not accessible to straightforward MD, to be available for the permeant.
Assessing convergence of MD simulations is difficult since it is typically limited by ergodicity and not by the size of the statistics. If the statistics were the only factor then the accuracy of the observables would improve as where L is the number of sampled points. We say that the sampling is ergodic if the points are uniformly sampled from the correct distribution. In typical complex simulations the system may be trapped in a local free energy minimum. Transitions out of local free energy minima may not be sampled in straightforward MD simulations causing significant errors in estimating averages. How do we know if the system is ergodic or not? While interesting and useful ergodic measures have been introduced,67 relevant order parameters need to be identified. It is not clear what these order parameters might be for the membrane system.
A simple test of ergodicity for the permeation problem is possible, and we exploited this test in our recent study.59 Let the two layers of the membrane be constructed independently. Let us further assume that the internal degrees of freedom of the permeant are sampled comprehensively. Permeation from aqueous solution to the center of the membrane explores different lipid conformations than the translocation process through the other half of the bilayer. By construction, both layers have the same chemical composition in our study (this is not the case for biological membranes68). At the “frozen” membrane limit, and at the time scale of MD, we expect different permeation rates through each of the layers. But if the system were at the fast equilibration limit the permeation rates would be similar for both halves of the membrane. Therefore, if the rates differ significantly that would suggest that slow conformational motions of the membrane are coupled to permeation and this interaction is not sampled correctly during the MD averages. Each layer is trapped in a local free energy minimum on the MD time scale, which is typically in the sub microsecond time scale.
In Refs. 59 and 66 we simulated permeation of N-Acetyl-L-tryptophanamide (NATA) through a DOPC (1,2-dioleoyl-sn-glycero-3-phosphocholine) membrane using the theory and algorithm of Milestoning.69–72 We examined in detail the convergence of the calculations (as defined above) using order parameters that include the membrane depth, permeant orientation, and the permeant internal degree of freedom (the ψ backbone dihedral angle). We found that the similarity between the rates of the two layers increases when the internal degrees of freedom of the permeant were taken into account. However, systematic deviations remain. The question of modeling the membrane explicit dynamics and its possible coupling to the translocation process was not addressed. The impact of the fluctuations of the membrane packing density in a pure phospholipid bilayer, and its time dependence are the prime focus of the present paper. In the absence of electrostatic interactions (e.g., when the permeant is electrically neutral) the free energy profile of an uncharged permeant is remarkably similar to the free energy of cavity formation (see Sec. V). This makes it possible to offer a general model for the contribution of short-range interactions to the permeation free energy and dynamics. We also illustrate that analyzing the membrane packing dynamics with Milestoning it is possible to determine the permeation rate and pathways of water molecules moving through the membrane. We suggest a new order parameter for the water translocation, which is the water density.
The choice of local density to describe the interactions of membrane fluctuations with uncharged permeants is a sensible and simple choice. Previous work has explored the connection among phospholipid membrane packing, cholesterol content, and lateral diffusion.73 The use of density could facilitate the development of multiscale modeling connecting the atomically detailed description of membrane permeation with continuous modeling of membranes. Also, the local densities are easy to determine from post-processing of the trajectory data. Other order parameters are possible, for example, the local orientation and ordering of the lipid chains. However, in the present paper we start with the simplest choice that we could think about.
The paper is organized as follows. In Sec. II we outline the theory for Milestoning with fields that is used to analyze the MD trajectories. In Sec. III we describe the algorithm to extract the required transition kernel for Milestoning. Section IV details the MD simulations of the membrane that determine the parameters for the Milestoning theory and describes additional methods to extract kinetic and mechanistic information for water permeation. Results and discussion are in Sec. V and conclusions are at the end.
II. MILESTONING FOR FIELDS: THEORY
Milestoning is a theory and algorithm to compute long time kinetics from an ensemble of short molecular dynamics trajectories.72 The first step in Milestoning is to define a reaction space. It is a set of order parameters or coarse variables that we use to describe the equilibrium and dynamics of the system −Q(u) ∈ Rn, where Q is a vector of the coarse variables of length n, and u ∈ R3N is the vector position of all the N atoms of the system. Using phase space variables to describe reaction space is also possible. However, for membrane processes diffusive dynamics that does not take into count inertial motions seems appropriate. In the past, reaction spaces were defined by torsions,74 a combination of torsions and hydrogen bonds,75 or by a Cartesian representation of a subset of atoms.76,77 It is not necessary to worry about Jacobian factors in Milestoning as long as the coordinates are not dependent. The coarse variables can be as complex as we see fit. It is also possible to use a one-dimensional reaction-coordinate for a reaction space.78 In this case it was shown that the optimal choice of the reaction coordinate for overdamped dynamics is the iso-committor function.79 On the other hand, a Milestoning study of a multi-dimensional reaction space produces a more detailed picture, which is a network representation of the process. The network is analyzed to elucidate mechanisms and extract kinetic and equilibrium properties to be tested by experiments.80
The proper choice of coarse variables to describe the dynamics of membrane density is a challenge. Some coarse-grained algorithms (e.g., Martini48) are based on collecting groups of atoms to point masses, and modeling mean force potentials between these points. These procedures are successful in reproducing thermodynamic features of membranes. However, understanding kinetics is not so clear. Memory kernels, which are notoriously difficult to compute, are required to study coarse-grained particle dynamics.81 Avoiding memory kernels means using ad hoc friction coefficients and noise terms, which are phenomenological and are hard to test against microscopic theories and atomically detailed simulations. It is desirable to develop a dynamic model for the membrane density that does not have any free parameters and all the variables are determined directly from short MD trajectories and microscopic modeling of interactions. We propose such a model below.
For the membrane system we consider the density ρX(R) where X is the atom type. The density ρ(R) is the number of atoms we find in an infinitesimal volume element centered at R. R is a three dimensional vector. We focus on one cell at each layer of the membrane at a specific value of z, the membrane depth. A pure phospholipid bilayer membrane is invariant under translations in the plane (on the average) and hence the above focus.
The basic entity we examine in Milestoning is the flux, q, or the change in the state of the system in a unit time. Since local density determines the system state, we have
| (1) |
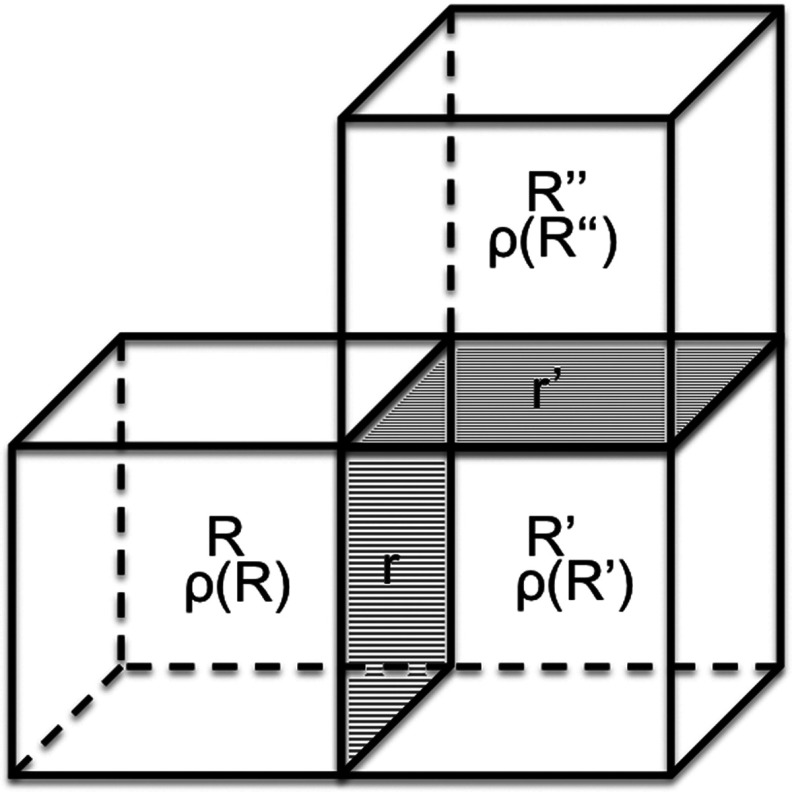
where r is the position of the wall between two nearby cells centered at R and R′ which we call a milestone (Fig. 1). During this change of state cell R changes its density from ρ(R) to ρ′(R), and cell R′ from ρ(R′) to ρ′(R′). Clearly the change in the density inside a volume element must come from incoming (or outgoing) particles from other nearby cells, and hence the definition of the flux as dependent on two cells. We assume that the density transfer is binary and at any time only one cell is engaged in density exchange with the cell of interest. We test the correctness of this assumption during simulations. If we find an exception that during a particular short time interval (our time step) two transitions occur we randomly pick one of the transitions to be first and the other to be next.
FIG. 1.
Transition of density between two milestones. Milestone r is the wall separating cells centered at R and R′, and milestone r′ separates cells with centers at R′ and R″. The density ρ(R) is the number of atoms in the cell centered at R. We consider transitions between two different boundaries belonging to the same cell, in this case cell R′. A transition event starts with a change of densities of the cells separated by r: Δρ(r) = ρ(R′) → ρ′(R′), ρ(R) → ρ′(R). We set the time of this density change to zero. The densities ρ′(R) and ρ′(R′) are the densities of those two cells at t = 0. The density of R′ is followed until the next transfer of mass occurs to a different milestone r′ at time t: Δρ′(r′) = ρ′(R′) → ρ″(R′), ρ′(R″) → ρ″(R″). The transition kernel K(Δρ(r), Δρ′(r′), t) is the probability that the density transition Δρ(r) at milestone r is followed by the density change Δρ′(r′) at milestone r′. For brevity we also say that the transition occurs between milestone Δρ(r) to milestone Δρ′(r′) where the term milestone refers both to the location of the wall and the density change associated with it.
The fluxes through all the milestones are the prime target of the calculations. We write an integral equation probing conservation of fluxes and building on a local transition matrix. We consider fluxes through two different boundaries of the same cell and write the probability that such two sequential transitions will happen at exactly time interval t. In other words we set the time of entry into the cell through one milestone to be zero and the next transition exiting from the cell to be at time t (Fig. 1). The probability density or kernel of this transition is K(Δρ(r), Δρ′(r′), t). This kernel is estimated from molecular dynamics trajectories. Either a single long trajectory, which is chopped to many small fragments,75,82 or many short trajectories are used.59,66,82,83 From the trajectories we determined instances in which the milestone Δρ(r) and Δρ′(r′) are passed in sequence, one after the other. Let the number of crossing of the milestone Δρ(r) be n(r) and the number of follow-up crosses of Δρ′(r′) at time t, before any other milestone is crossed, be n(r, r′, t). The corresponding value of the kernel is estimated from the trajectories as K(Δρ(r), Δρ′(r′), t) = n(r, r′, t)/n(r). Further discussion of the numerical estimates in Milestoning is provided in Sec. III. With the kernel at hand we write the Milestoning equations for flux conservation
| (2) |
Equation (2) is a statement about conservation of flux. In the above formula we introduce pX(ΔρX(r), t) which is the probability that the last milestone crossed before or at time t is ΔρX, δ is the Dirac's delta function. The time difference in the delta function is set to ensure that the time integral over the delta function is one (and not 1/2). The time integration in the second term on the right considers all possible early entries to the cell at times t′ < t and the coarse space integration (Γρ) is over all possible density changes in the pair of cells. In practice the values of the densities are discretized and the integral is replaced by a sum as explained in Sec. III.
Equation (2) is solved with the help of Laplace transforms.70,72,84 We define . A Laplace transform in time of Eq. (2) gives
| (3) |
Taking the zero limit of the Laplace variable, u, we recover a long time limit. We consider two cases. The first is of cyclic condition in which particles in the final target milestone ΔρX(rf) are fed back up to the initial milestone ΔρX(ri), e.g., a cell at the lower leaflet of the membrane is transmitting density to a cell at the upper leaflet. In that case we have in the limit u → 0:
| (4) |
And we also have
| (5) |
The function qX, stat(ΔρX(r)) is the stationary flux under the cyclic boundary conditions imposed in Eq. (4). We now write Eq. (3) for the limit of zero for the Laplace variable (after multiplying both sides by u) in a more compact and abstract form
| (6) |
The average corresponds to the integral over the phase space points of the trajectories that pass through the milestones and the transition matrix K with elements defined in Eq. (4). The stationary probability vector of all milestones is given by
| (7) |
where the symbol ⊙ denotes element wise product. The local life-time of a milestone, t, which we also consider in this paper is
| (8) |
where (t)r is the average life time of milestone r.
Finally the overall mean first passage is computed using reduced matrices, at the level of the milestones and not at the level of individual phase space point as discussed earlier. This requires a physically sensible assumption of de-correlation of trajectories70 from initiation to termination, or in the present formulation that the flux function is approximately a constant on the range of a cell wall (a milestone). We have72
| (9) |
where ⟨τ⟩ is the overall mean first passage time and p0 is the initial probability that a milestone was crossed. The kernel K̶ is similar to K except that
 |
(10) |
which implies an absorbing boundary condition at milestone f. The population decays to zero and its life-time, as defined in Eq. (9), is finite.
III. MILESTONING FOR FIELDS: ALGORITHMS
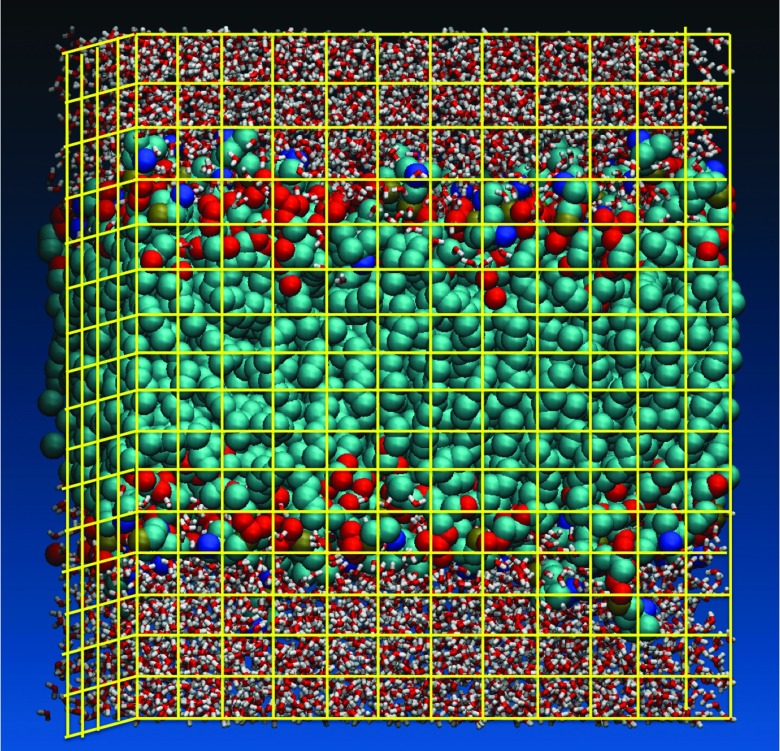
Since r is a continuous variable it means that the number of reaction coordinates (the field densities) is infinite. The use of the density field to describe reaction space with computer simulations makes practical sense only after discretization of the field. Consider a simulation box of volume V divided into C cells (Fig. 2). If the number of atoms of type X in cell i is nXi then the cell density is given by ρXi = C · nXi/V. To explore transitions we examine the densities in neighboring cells as a function of time. We call below a change in the density of a cell an “event.” The transfer of density in each event can be positive or negative, i.e., cell i can gain or lose density in events. Our code was build to analyze any of the cells of the membrane, with a total of 15 × 15 × 17 cells (this is the more common discretization used in this work). We use 17 cells in the direction normal to the membrane plane (the z axis) and 15 for each of the in-membrane axes. However, since the membrane is symmetric on the average in the membrane plane, we focus in the present study on a single column of cells along the normal to the membrane. This gives us a total of 17 prime cells.
FIG. 2.
Discretization of the simulation box into cells used for the Milestoning calculation of density fluctuations. This is an approximate picture of the cells. The actual cell sizes used in the calculations are slightly smaller.
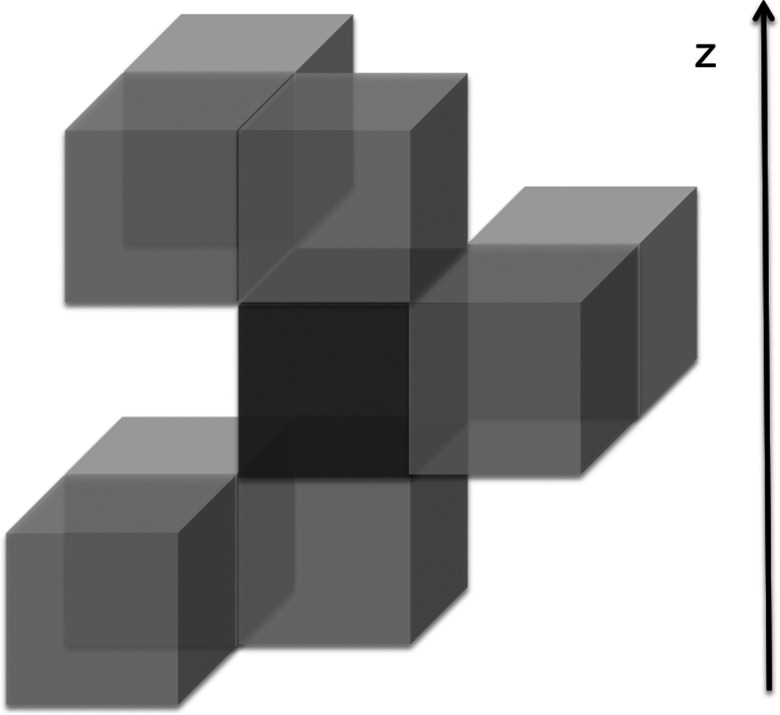
In three dimensions and assuming equal and cubic cell sizes, there are 26 neighbors to a central cell. Symmetry reduces the number of distinct nearby cells to only 8 (Fig. 3). As we described in Sec. II, we need to consider two elementary events at cell i to build the transition kernel. The first event involves density transfer between the pairs of cells (j, i) and the second event, after time t, transfers density between cells (i, k). We call the two sequential events “an elementary sequence” if there is no other event in cell i between the two transitions mentioned above. We record (of course) only elementary sequences. We estimate the transition kernel for atoms of type X as KXji, ik(t) ≅ nji, ik(t)/nji(0). Where nji(0) is the number of (j, i) events initiated at time zero, and nji, ik(t) is the number of (j, i) trajectories initiated at time zero that continue to event (i, k) exactly at time t. Since the kernel depends only on time differences in the time-homogeneous process being considered we can set the time of the original event to zero.
FIG. 3.
The number of cells surrounding a cubic central cell (shown here with a darker grey) that needs to be considered can be reduced by symmetry because the x and y directions are equivalent on the average in a pure bilayer system. Only two cells are required in the xy plane with the same z value as the central cell. Above the prime cell in the z direction three nonequivalent cells are needed, and three additional cells are required below the central cell.
With the transitional kernel at hand we can determine the reactive flux, stationary probability density, and the overall mean first passage times. We re-iterate that we are not required to know the transition kernel at all time. The zero and the first order time moments are sufficient to estimate parameters of equilibrium and local kinetics according to Eqs. (6), (7), and (9). With the above discretization the matrices of Eq. (2) (i.e., K) are of dimensionality M × M where M is the number of milestones.
If we have J discrete values for the density, the number of milestones for the discretization described above is M = (8 × 17 × J × J) for a particular atom type. The number of density levels we considered is J = 14. That gives a total number of milestones M = 26 656. This is a large number. However, the matrices are highly sparse and the linear problems that we solve (for the flux q, and for the mean first passage time, MFPT, ⟨τ⟩) are accessible with standard libraries.85 Furthermore, milestones that face directly the central cell are sampled more often than the ones located at the corners. Therefore, for the present calculations to enhance the statistical convergence of our results we accumulated the transitions to the three top cells (Fig. 3) into one top cell. The same was done for the two lateral cells and the three bottom cells. This reduces the calculation to a single column along the z-axis and the number of milestones is M = 17 × 14 × 14 × 3 = 9996 where “17” is the number of layers along z. The sampling of all the lipid and water atoms includes only a fraction of the milestones as active (5810). The number of milestones was 2747 when only the water atoms were included in the analysis. The prime computational bottleneck remains the collection of the short trajectories between the milestones and not the post processing of the Milestoning equations.
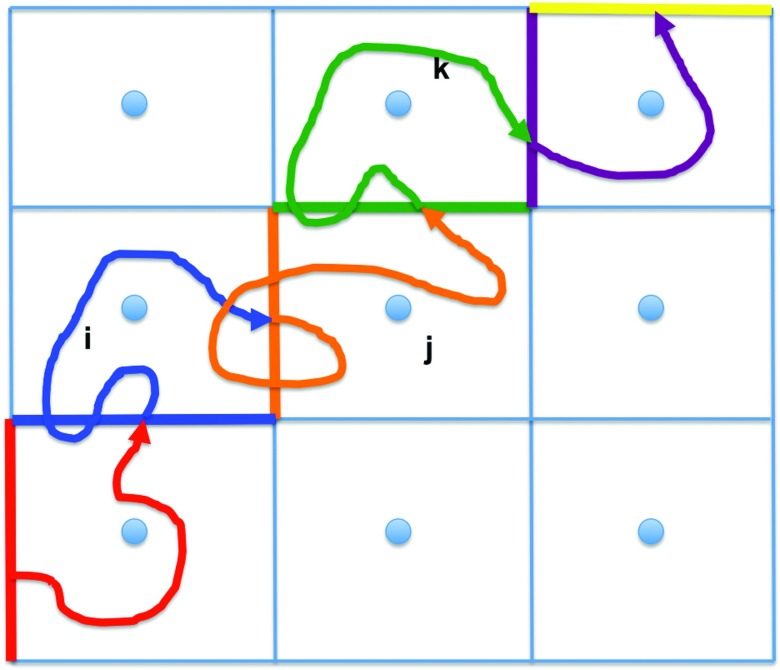
Instead of running many short trajectories we analyze a single long trajectory in this work. We “chop” a long trajectory to fragments that describe the elementary events between milestones that we seek (Fig. 4). We set the start of a trajectory fragment to be the time it passes milestone (i, j) (the orange wall in Fig. 4) given that the prior event was the crossing of a different milestone, and terminate the trajectory the first time it passes yet another milestone (j, k) (the green wall). The trajectory fragment is added to the statistical model of the transition kernel.
FIG. 4.
Simple representation of the Milestoning algorithm. The blue circles are anchors and the straight lines are milestones (interfaces) separating the different anchor domains in the system. In the present case anchors are located at the center of every grid cell and there are different anchors depending on the number of atoms present in the cell. The curve line represents a long trajectory that has been partitioned into trajectory fragments depending on the last milestone that the long trajectory has crossed. The red trajectory fragment starts at the red milestone and it belongs to the red milestone until it hits the blue milestone for the first time. At that moment the trajectory belongs to the blue milestone until it hits a neighboring milestone (the orange one) and so on.
IV. METHODS
A. MD simulations
The simulated system is a bilayer membrane with 64 DOPC molecules in each leaflet, a total of 128 DOPC and 6097 water molecules. The system has a total of 47.6 water molecules per lipid, above the experimental ratio of 32.5, ensuring full hydration and stability of the simulated system. The initial configuration of the system was prepared using the membrane builder facility of CHARMM-GUI (Chemistry at HARvard Molecular Mechanics-Graphical User Interface).86,87 The force fields used in the simulations were the united-atom Berger force field for the acyl chain atoms of the lipid8 and OPLS (Optimized Potentials for Liquid Simulations) force field88 for the head group region. We have used the same set of force field parameters in previous simulations of the same lipid system59,66 where comparisons with experiments and Potential of Mean Force (PMF) obtained with other force field sets suggests the chosen parameters are accurate enough to provide sensitive description of the permeation process. Water molecules were modeled using the TIP3P force field.89 The combination of Berger/OPLS parameters for the lipid and TIP3P model for water has been tested and used by others.90,91 The simulations were done with our molecular package MOIL.92,93 The initial configuration was heated slowly and equilibrated at 300 K during a 2 ns run. The simulation box size is 66.0 × 66.0 × 74.9 Å3. That gives a surface area per lipid of 68.1 Å2 that is in the range obtained in previous simulations94 and 5% smaller than the experimental value.95
Periodic boundary conditions were applied in the three spatial directions. The long-range electrostatic forces were calculated using the smooth particle mesh Ewald method96 with a grid of 64 × 64 × 76. The cutoffs for van der Waals interactions and for the real space component of the electrostatics forces were set to 9.8 Å. In all the simulations we constrain water bond length and angles with a matrix implementation of the SHAKE algorithm.97,98 The simulations were done with multiple time steps according to r-RESPA (reversible Reference System Propagation Algorithm),99 with 1 fs time step to integrate the bonding, van der Waals, and real part of the electrostatics interactions and a 4 fs time step to evaluate the reciprocal-space component of the Ewald sum.
After the equilibration runs, a 200 ns production run was performed at constant temperature and volume. Configurations were saved every 1 ps for density analysis.
Two additional sets of simulations were run using the same bilayer system to evaluate the PMF of membrane permeation for xenon and for charged “xenon” atoms. In particular we are interested in comparing the potential of mean force for a xenon atom to the potential of mean force for cavity formation. In one set of simulations with constraints we added two neutral xenon atoms into the bilayer system (one in each leaflet). The locations of the atoms along the z axis (the axis perpendicular to the membrane surface) were constrained in each window with a harmonic potential with a force constant of 10 kcal/mol Å2. The location of the biasing potential was displaced by 2 Å in consecutive windows going from Z = −32 Å to Z = 0 Å for the xenon atom placed in the negative leaflet and from Z = 0 Å to Z = 32 Å for the xenon atom placed in the positive leaflet. This procedure gives a total number of 17 sampling windows. In each simulation window the distance separating the two xenon atoms was at least 32 Å to minimize their interaction. Initial bilayer coordinates for these runs were taken from configurations extracted from the last 20 ns of the pure bilayer run. Xenon atoms were placed in cavities observed in these conformations at locations close to the center of the bias potential for a particular window. The cavities were large enough (see below) to accommodate a xenon atom (van der Waals radius of 2.2 Å) so initial membrane disruption was minimized. After a short equilibration period of 100 ps, trajectories of 50 ns were launched in each window. Configurations from the last 40 ns were used to evaluate the PMF. In the second set of bias simulations one negatively charged xenon particle was added and its position was restrained in a similar way as in the first set of constraint simulations. Ions perturb more significantly the membrane compared to neutral species and may also interact strongly which each other over larger distances. Therefore, only one charged xenon atom was added to the membrane at a time. The goal of this study was to have a quantitative appreciation of the relative magnitude of electrostatic versus cavity formation forces during a permeation process.
To ensure system neutrality one positively charged potassium ion was added to the box and placed in the aqueous side opposite to the leaflet occupied by the negative xenon. We placed the negatively charged xenon in membrane cavities found in pure bilayer configurations as before. After a short equilibration period, trajectories of 100 ns were computed in each window and configurations from the last 40 ns were used in the analysis. We computed 33 sampling windows with the bias potential shifted by 2 Å in consecutive windows and use the Z-constraint method to evaluate the PMF.2
B. Density representation
To extract density information from MD simulations we mapped the simulation box onto a three-dimensional rectangular grid (Fig. 2). Unless it is stated otherwise for most of the analysis shown in the paper we use 15 × 15 × 17 grid cells, with cubic cells of size 4.4 Å. The number of heavy atoms (carbon, oxygen, nitrogen, and phosphorous atoms of the lipid and oxygen atoms of the water molecules) present in every grid was counted and the density of the grid was classified according to this number of atoms. For the analysis of water permeation we only count the oxygen atoms of the water molecules to label the grid density. Including both the lipid and water molecules the average number of non-hydrogen atoms for the 4.4 Å grid size is 3.4 atoms per cell.
C. Determination of global maximum weight paths (GMWP)
Global maximum weight paths are pathways of maximum flux connecting two given nodes in a network. They are useful for qualitative understanding of mechanism and to determine precise reaction coordinates at finite temperatures. The concept was elaborated on and discussed by Berezhkovskii, Hummer, and Szabo100 and by Metzner, Schütte, and Vanden-Eijnden in the framework of transition path theory101 and is particularly useful and easy to implement in Milestoning. We used a recently developed code,80 which is based on a Recursive Dijkstra's algorithm, to determine GMWP for water permeation in the network of density levels and membrane depths.
D. Computation of permeability coefficient
The rate of passive permeation of a solute through a membrane is quantified by its permeability coefficient that gives the flux of solute per unit area and normalized it by the concentration gradient across the membrane interface. Previously we described a procedure to compute the permeability coefficient by Milestoning.59 We write the permeability as P = (J1/Δc)qf where J1 is the number of molecules that pass through the first milestone per unit time and area, Δc is the concentration gradient, and qf is the flux under stationary conditions through the final milestone (with q1 = 1). To estimate the Milestoning fluxes we use a set of dual cyclic boundary conditions as described in Ref. 59.
V. RESULTS AND DISCUSSION
A. Density distribution for the combination of lipid and water atoms at equilibrium
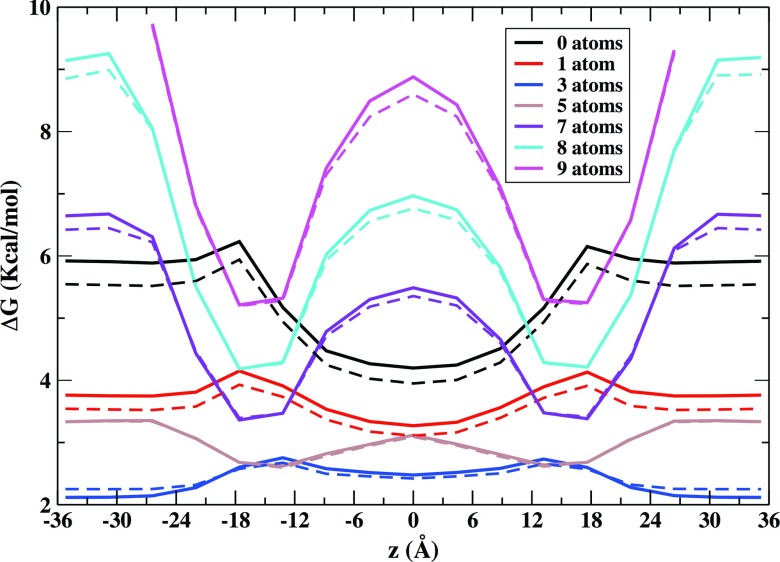
We first determined the density distribution of lipid and water atoms along the membrane axis. Fig. 5 shows the equilibrium distribution for different cell densities obtained with Milestoning using Eq. (7). These distributions compare well to the equilibrium distributions determined by a straightforward average over the 200 ns of simulation data and increase our confidence in the Milestoning results. As expected the free energy profile for zero density of lipid and water atoms decreases going from the lipid/water interface to the interior of the membrane with a slight peak at 18 Å where the phosphate head groups are located.66 The free energy for low density states (1–3 atoms per cell) reaches its minimum value at the center of the membrane while for higher density states (more than 5 atoms in the cell) the profiles have their minima in a region between 18 and 13 Å from the membrane center.
FIG. 5.
Free energy profiles along the z axis for different atomic occupancy of cells. The solid lines represent the equilibrium free energy according to the number of lipid and water atoms associated with each milestone. The dashed lines are the same free energies obtained from the original MD trajectory that were average over the 200 ns of simulation data obtained for the pure bilayer system. For a given z value we are also averaging over all the grids in the xy plane. The center of the membrane is at 0 Å. The close symmetry between the left and right leaflets reveals excellent convergence of this equilibrium property.
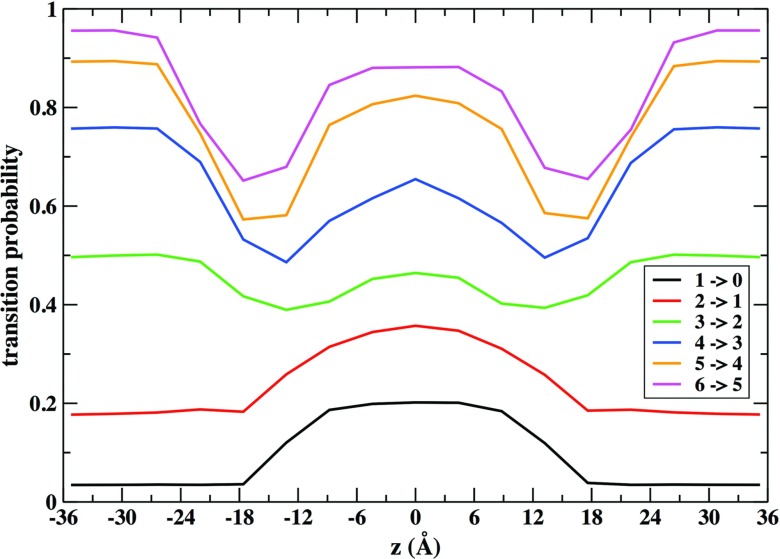
The probability of transitions of density depends strongly on the location of the cells along the membrane axis. Fig. 6 illustrates that dependence for a decrease of density for several initial conditions. For low densities (1 or 2 atoms) the probability of transitions to lower the density further is higher at the membrane center (where the overall atomic density is lower) compared to other locations. For higher densities (4–6 atoms initially in the cell) the transitions to lower densities occur more easily at the water phase. By comparison, they are less probable in the 18–13 Å region where the lipid tails are more closely packed.66
FIG. 6.
Probability of transition events between milestones that result in a decrease of the density of the cell is plotted as a function of the membrane axis. A transition event is defined as a change of cell density. When a cell contains one atom at a given time it can take one atom from other cell (transition 1 → 2) or lose that atom to a neighboring cell (transition 1 → 0). The sum of all transition probabilities is normalized to one.
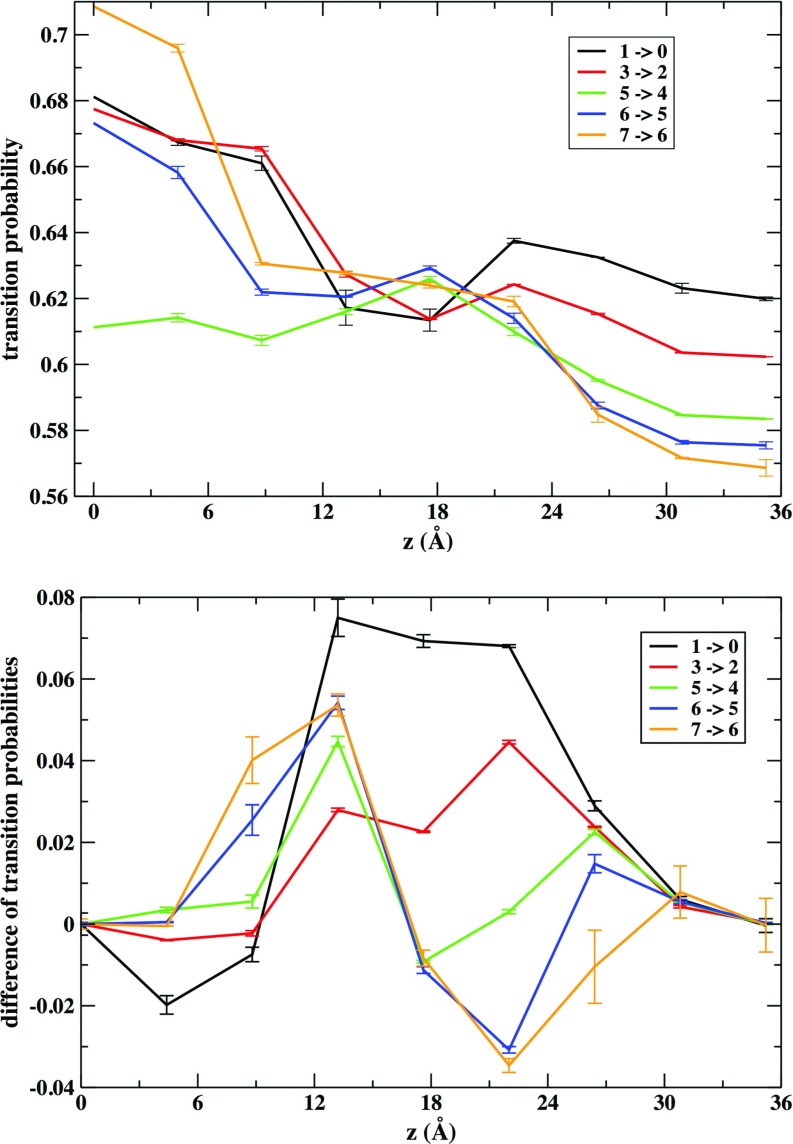
We ask which neighboring cells are more likely to gain density when a central cell decreases its density. We further inquire how this probability changes along the z axis. Fig. 7 illustrates those variations of transitional probabilities. For a given density change there is a higher propensity for transitions to lateral cells when the cell is closer to the membrane center (Figure 7, top). This inclination as a function of the z axis is more pronounced when the cell contains more atoms before the transition. At the center of the membrane there is more space available (see Fig. 5) for lateral displacements. The behavior is more complex and subtle for up or down transitions (transitions to cells with a larger value or lower value of z). The bottom of Fig. 7 shows the difference of transition probability to go up or down (a positive value means that probability to go up is larger). For transitions 1 → 0 to form an empty cavity up transitions are more probable than down transition for most locations with the exception of the region closer to the membrane center were up and down transitions probabilities become similar. The general tendency to favor up transitions moves density away from the membrane center. On the other hand for initial densities larger than average (for example, transition 7 → 6) the up transition is more probable in the region between 6 and 13 Å and the down transitions are more probable in the region 18–24 Å. The overall tendency favors mass motion to the more dense region of the membrane system at about ∼18 Å where the phosphate groups are approximately located. At intermediate densities the transition probability changes along the membrane axis are a mix of these two tendencies observed at the lower and higher ends of density.
FIG. 7.
The probability of transition events between milestones that result in a decrease of the density of the cell is classified according to the location of the cell that acts as an acceptor to the transition. The top panel shows the probability of transitions to lateral cells (transitions between cells with the same value of z). The bottom panel displays the difference between the probability of transition to a neighboring cell with a larger value of z and a lower value of z. The error bars represent the values computed for the two layers.
B. Permeation of water
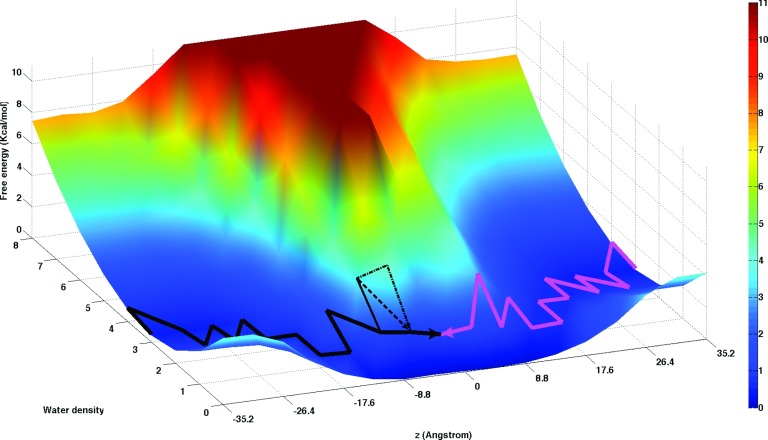
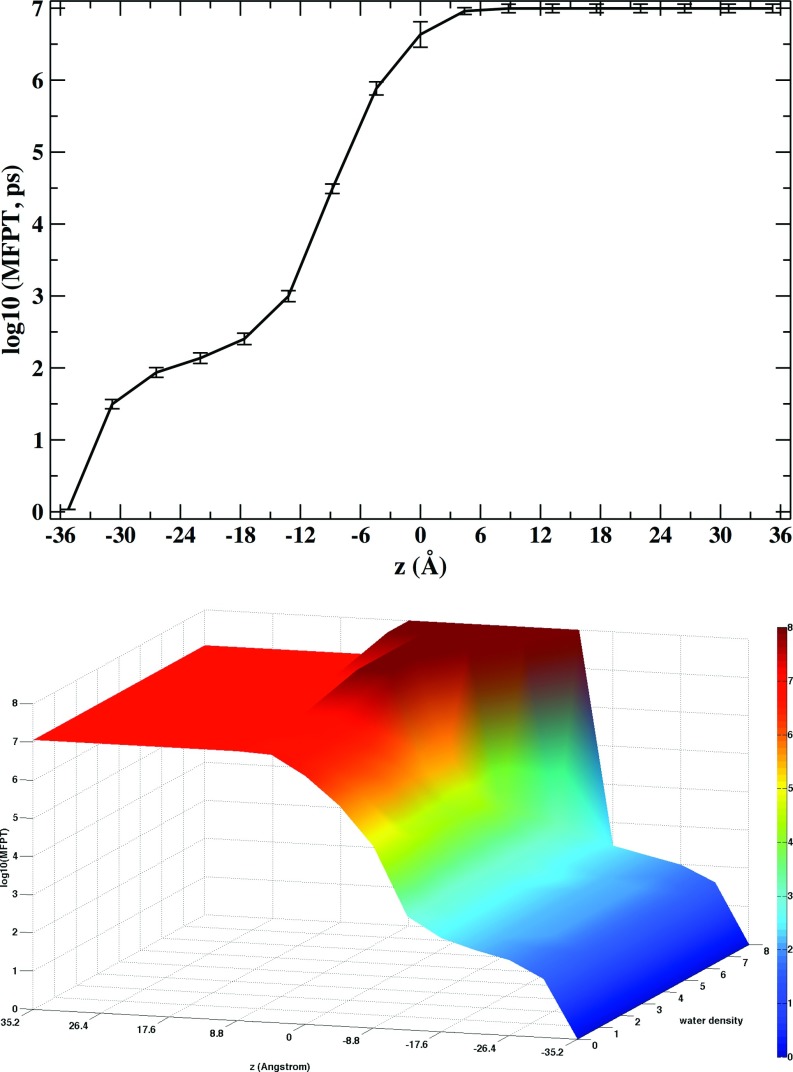
We also used grid discretization of the simulation cell to examine changes of density and dynamics of water moving through the membrane. In this case we keep track only of the number of water molecules present in each grid cell and determine transition events and density changes of water. Figure 8 displays the free energy for water density distribution at different membrane depths. At the water phase, there is a valley region in the surface with a minimum value fluctuating between three to four water molecules per cell. The surface slope is steeper at low water densities and more gradual at larger water densities. As expected moving closer to the membrane center the location of this valley shifts to lower water densities and the high-density slope becomes steeper. At membrane depths below 10 Å the lower density slope disappears. At those membrane depths the more probable water grid density becomes zero. Still, enough water molecules move close to the membrane center to be able to evaluate water density changes in that region and therefore to obtain estimates of the free energy and MFPT for the water permeation process. A projection of the free energy surface along the membrane axis produces a barrier height of 5.7 kcal/mol that is within the values 5.5–6.2 kcal/mol reported in previous computations.2,16,56,102 Our estimate of the MFPT for the transmembrane permeation of water gives an average of 10.0 ± 1.2 μs (the error bars are estimated from the studies of water permeation for each leaflet of the membrane).
FIG. 8.
A two-dimensional free energy surface showing atomic occupancy for the oxygen-water atoms in the membrane system at different membrane depths calculated by Milestoning. It is also displayed the global maximum weight paths (GMWP) for water permeation from the water phase at each side of the membrane to the center of the membrane (black and mauve lines). For the water permeation on the left side the second and third next GWMPs are shown in dashed black lines. These paths are obtained by removal of the kinetic bottleneck from the previous GWMP. The free energy landscape and GWMP illustrate that the optimal path is not simply the normal to the membrane plane (z) but rather a combination of z with the water density to create a curved reaction path in two dimensions.
We also computed the permeability coefficient P = (J1/Δc)qf with the method described in Sec. IV. The permeation coefficient requires further elaboration compared to the free energy and the mean first passage time since our equation for the flux (Eq. (6)) is not normalized. If the flux q is a solution of Eq. (6) so is λq where λ is a positive scalar constant. Hence we need to determine independently the initial value of the flux. We estimated the initial flux of water molecules by counting the number of water molecules moving through a cross section at the water phase in our simulation box. The cross section was the 66 × 66 Å2 of the membrane plane of the full box. It was placed 35 Å from the membrane center and the number of water molecules crossing this surface was averaged over the 200 ns simulation. The average flux was 0.015 water molecules Å−2 ps−1. This gives J1/Δc = 4.4 × 103 cm/s where we use Δc = 55 M for the unidirectional flux of water across the membrane. Using Milestoning we computed the flux qf for the halves of the membrane. This gives P = 0.041 ± 0.019 cm/s, somewhat larger than the reported experimental values for permeation of water through DOPC membranes that range from 0.0158 to 0.0056 cm/s.103–105 Our larger estimate may reflect the (too large) diffusion constant of the water model TIP3P.106
Figure 8 also shows GMWP for water permeation from both water layers to the membrane center. Both trajectories follow closely areas of low free energy. At a distance of 8 Å from the membrane center these maximum flux paths tend to pass through grid cells with two waters molecules. This could suggest that water pathways are faster when a water molecule drags another one on its way to the hydrophobic membrane center. Elimination of the bottlenecks to generate the second and third GMWPs (illustrated for the permeation pathways at the left side) creates pathways with more multiple occupancies between −8 and −4 Å. The flux for these second and third GMWPs has a similar order of magnitude than the first GMWP so these pathways are expected to contribute to the permeation of water.
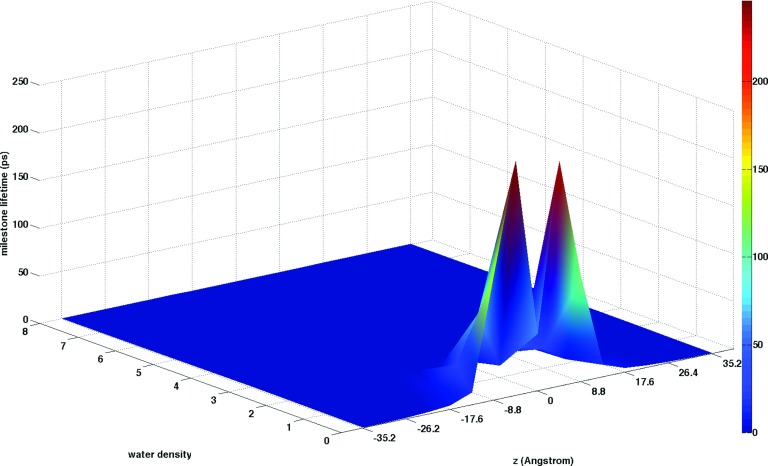
Figure 9 shows milestone life times in the coarse-grained space of water density and position along the membrane axis. In most regions, the life times are very short reflecting the fast diffusion and changes of water density in locations where water is abundant. Closer to the membrane center with lower water densities, changes of density are slower, with life times reaching several hundreds of pico seconds. At the membrane center there is a decrease of the milestone life times. At that location there is more space available for molecular motions and fluctuations of density can speed up. In Fig. 10 we show the overall mean first passage time for water permeation as a function of the normal to the membrane plane, z, and the water density. There are two distinct time scales, one in the hundreds of picoseconds and a second in the tens of microseconds. We are able to observe ten of microsecond kinetics due to the enhancement factors of Milestoning that makes it possible for us to probe much longer time scale than the ones that are accessible to straightforward MD. The permeation time saturates near the membrane center at z = 0 Å. Only a weak dependence of the MFPT on the local water density, mostly near the barrier position, is observed.
FIG. 9.
Milestone life times for changes of water density. Most life times are short with the exception of the ones in the middle of the membrane that can reach hundreds of picoseconds. Note the “dip” at the membrane center. At the center of the membrane the density is low which facilitates less collisional events and more rapid motions.
FIG. 10.
Mean first passage time for water permeation through the membrane. (Top) Projection of the MFPT along the membrane axis. Error bars are obtained by comparing water permeation estimates starting on opposite sides of the membrane. (Bottom) The projection of the MFPT over the membrane axis and water density. This surface shows permeation times for water molecules moving from the negative to the positive z-layer. The MFPT is slightly dependent on the water density before the barrier is reached.
C. Cavity density and kinetics
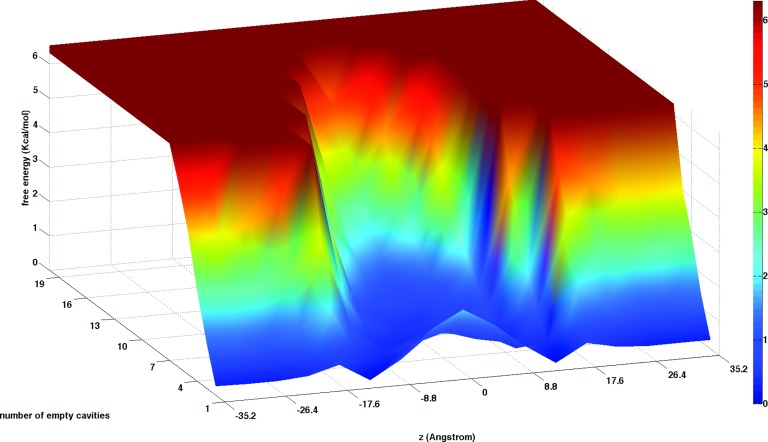
The previous analysis of the combined lipid and water densities in the bilayer membrane system (Fig. 5) showed that transient cavities (cells with no atoms of any kind) can form in the crowded membrane environment. Figure 11 shows the probability of finding different number of cavities along the z axis. In the region from the water phase to the membrane/water interface the formation of empty cavities is limited so it is very rare to have two or more empty cells at the same membrane depth. The least favorable location for hole formation is about 18 Å from the membrane center (see also Figs. 5 and 12) where the phosphate groups are approximately located.66 A larger number of cavities is observed close to the membrane center. For example, at the center the most probable number of cavities is five for a cubic cell of volume 85.3 Å3. More generally, this volume of cavities corresponds to a fraction of 0.02 of the total volume in a layer at the membrane center.
FIG. 11.
Equilibrium distribution of the number of empty cells (starting from 1 to 19 empty cells) present at different locations along the membrane axis. It is more probable to find multiple holes at the membrane center than in other regions of the membrane system.
FIG. 12.
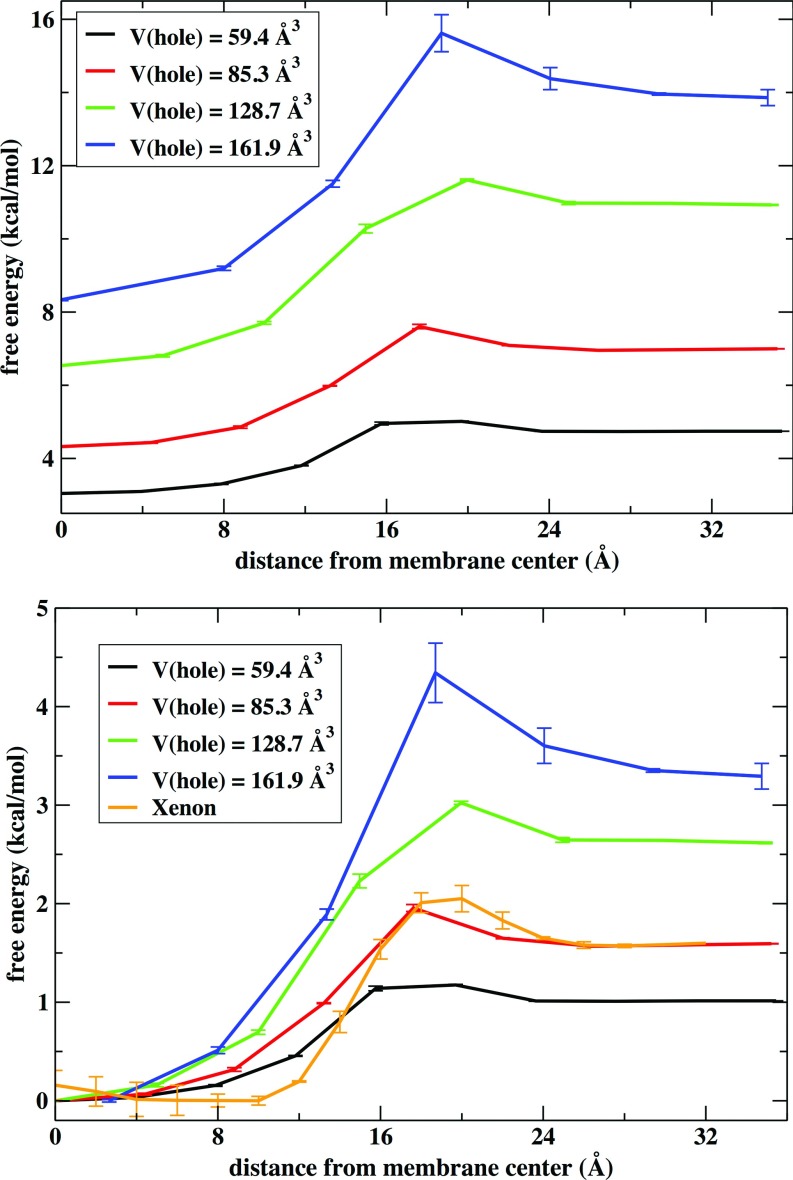
(Top) Free energy of hole formation as a function of the distance from the center of the membrane. Results are shown for different volumes of the grid used to discretize the density data. Error bars are obtained by comparing results from the two membrane layers. (Bottom) it shows the same free energy normalized along z and with the free energy shifted to zero at the center of the membrane. The orange curve is the PMF for permeation of a xenon atom. The van der Waals diameter of xenon is 4.3 Å, smaller than the size of the cubic grid cell of volume 85.3 Å3 shown in red (with a 4.4 Å side).
Figure 12 depicts free energy profiles for hole formation along the membrane axis for different sizes of the cubic grid used to discretize the simulation box. The difference of probability for cavity formation between the membrane center and the water phase increases with the volume of the cavity. The height of the barrier also increases with the cavity volume. With increasing cell volumes becomes even more difficult to find holes in areas of high particle density in the membrane system. When the volume of the cell is larger than 161.9 Å3 (that volume corresponds to a cubic size of 5.5 Å) holes were not present at the denser locations of the membrane in our simulations. For the smaller volume displayed, 59.3 Å3, the probability for hole formation is similar in the water/membrane interface and the water phase although the probability to observe holes is still slightly larger at the membrane center.
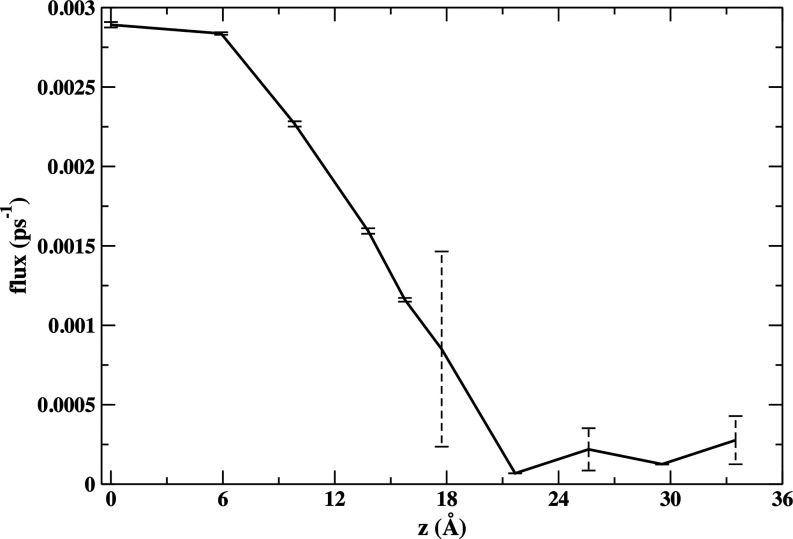
We computed kinetics of cavity mobility with Milestoning. For a small cell volume of 59.3 Å3 a complete permeation path of a cavity was found (Fig. 13). The kinetic bottleneck is observed at the location of the membrane headgroups and the flux increases once the cavity is approaching the membrane center.
FIG. 13.
Milestone flux for the permeation of a hole from the water phase to the center of the membrane. Error bars are obtained by comparing the independent Milestoning results for the two layers.
D. Neutral and charge xenon transport
The noble gas xenon is known to be an anesthetic agent but the mechanism of anesthetic action is not well understood. Recent MD simulations of lipid bilayers interacting with Xe atoms at different concentrations showed that these atoms tend to accumulate at the membrane center.107,108 In here, we used MD with Z constrained to a particular value using a harmonic restraint to determine the PMF for permeation of a xenon atom through the same bilayer system we used in the density analysis (the van der Waals diameter of a xenon atom is 4.3 Å). The cubic box of volume 85.3 Å3 is large enough (side 4.4 Å) to enclose one xenon atom. The bottom panel of Figure 12 shows that the PMF for xenon is similar to the free energy change for the 85.3 Å3 cavity. The overall change of free energy and the location of the barrier are similar (slightly shifted to the water phase for the PMF of xenon). The more notable difference is that the minimum basin seems to be broader for xenon. This similarity suggests that the membrane permeation of xenon is controlled by the presence of these membrane cavities.
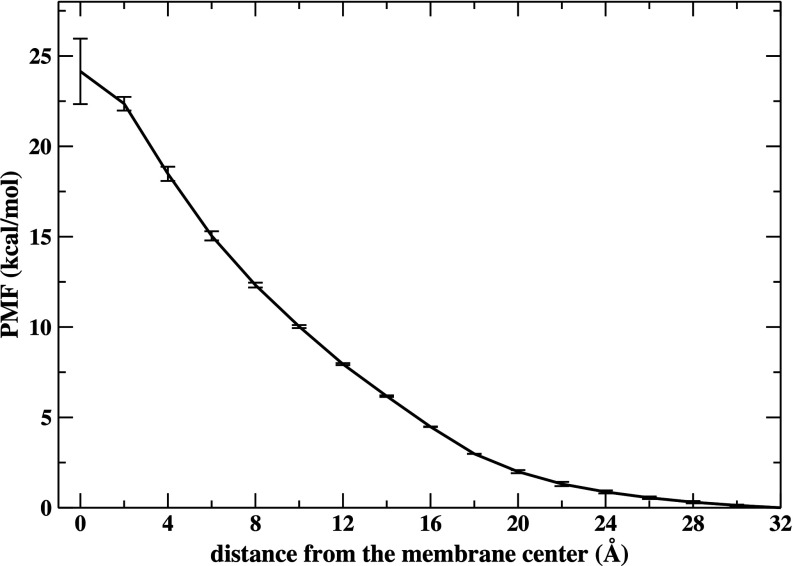
We also computed the PMF of anionic xenon. We used this artificial anion to study the effects of electrostatics while keeping the size of the particle the same as the neutral case. The PMF increases monotonically going from the water phase to the center of the membrane where the only barrier is present (Fig. 14). The barrier height is 24.1 ± 1.8 kcal/mol, larger by about 20 kcal/mol compared to the transport of the neutral atom. An electrostatics calculation using a continuum dielectric model5 gives a barrier at the center of 35 kcal/mol. We observed, as noted by others5,109 that when the anion is at the membrane center there is a considerable distortion of the bilayer structure with the formation of a column of water molecules coming from one of the aqueous phases all the way to the location of the anion that can be surrounded by up to 10 water molecules at a time. On the other hand, for the neutral Xe atom, the bilayer structure is preserved when the atom is at the membrane center. These observations suggest a mechanism that cannot be captured by continuum theories, like the self energy used above.
FIG. 14.
The free energy profile for a negatively charged “xenon.” See text for more details. Error bars are obtained by comparing the results of the two layers.
VI. CONCLUSION
In the present paper we proposed a novel approach of coarse graining membranes to obtain continuum, field-like representation, based on atomically detailed MD simulations. The approach makes it possible to connect microscopic with mesoscopic description of membrane and open the way for multiscale modeling of membranes bridging from atomic description to continuum. For example, earlier modeling of membrane as highly viscous fluids are accessible to the present description. Further reduction in complexity of the present model is expected using continuous Markovian modeling110 and deriving the corresponding diffusion equation for the particle density.
The Milestoning with fields algorithm introduced here provides sensible results probing the density fluctuations and dynamics of membrane systems. The equilibrium probabilities for the different density states obtained with the algorithm are accurate enough to provide useful information for transition probabilities and how these transition probabilities change depending on the heterogeneous membrane environment. We showed that membrane-packing fluctuations create transient cavities and contribute to the permeation of uncharged small solutes through the membrane. The extent in which these membrane fluctuations contribute to the permeation of larger molecules such as peptides is a topic for future work as well as assessing if the use of different force fields can influence the results extracted from our analysis. We also showed that the permeability of water is satisfactorily described with Milestoning with fields. Our calculations suggest that pathways in which two water molecules are clustered near the membrane center could have significant contribution to the permeation process.
ACKNOWLEDGMENTS
The authors acknowledge the Texas Advanced Computing Center (TACC) at the University of Texas at Austin for providing HPC resources that have contributed to the results reported within this paper URL: http://www.tacc.utexas.edu. R.E. acknowledges support from National Institutes of Health Grant No. GM05976, National Science Foundation Grant No. CCF-0833162, and Welch Grant No. F-1783.
REFERENCES
- 1.Heller H., Schaefer M., and Schulten K., J. Phys. Chem. 97(31), 8343–8360 (1993). 10.1021/j100133a034 [DOI] [Google Scholar]
- 2.Marrink S. J. and Berendsen H. J. C., J. Phys. Chem. 98(15), 4155–4168 (1994). 10.1021/j100066a040 [DOI] [Google Scholar]
- 3.Tieleman D. P. and Berendsen H. J. C., J. Chem. Phys. 105(11), 4871–4880 (1996). 10.1063/1.472323 [DOI] [Google Scholar]
- 4.Feller S. E., Venable R. M., and Pastor R. W., Langmuir 13(24), 6555–6561 (1997). 10.1021/la970746j [DOI] [Google Scholar]
- 5.Wilson M. A. and Pohorille A., J. Am. Chem. Soc. 118(28), 6580–6587 (1996). 10.1021/ja9540381 [DOI] [PubMed] [Google Scholar]
- 6.Tu K., Tobias D. J., Blasie J. K., and Klein M. L., Biophys. J. 70(2), 595–608 (1996). 10.1016/S0006-3495(96)79623-6 [DOI] [PMC free article] [PubMed] [Google Scholar]
- 7.Smondyrev A. M. and Berkowitz M. L., Biophys. J. 77(4), 2075–2089 (1999). 10.1016/S0006-3495(99)77049-9 [DOI] [PMC free article] [PubMed] [Google Scholar]
- 8.Berger O., Edholm O., and Jahnig F., Biophys. J. 72(5), 2002–2013 (1997). 10.1016/S0006-3495(97)78845-3 [DOI] [PMC free article] [PubMed] [Google Scholar]
- 9.Lindahl E. and Edholm O., Biophys. J. 79(1), 426–433 (2000). 10.1016/S0006-3495(00)76304-1 [DOI] [PMC free article] [PubMed] [Google Scholar]
- 10.Patra M., Karttunen M., Hyvonen M. T., Falck E., Lindqvist P., and Vattulainen I., Biophys. J. 84(6), 3636–3645 (2003). 10.1016/S0006-3495(03)75094-2 [DOI] [PMC free article] [PubMed] [Google Scholar]
- 11.Marrink S. J. and Mark A. E., J. Phys. Chem. B 105(26), 6122–6127 (2001). 10.1021/jp0103474 [DOI] [Google Scholar]
- 12.MacCallum J. L., Bennett W. F. D., and Tieleman D. P., Biophys. J. 94(9), 3393–3404 (2008). 10.1529/biophysj.107.112805 [DOI] [PMC free article] [PubMed] [Google Scholar]
- 13.Herce H. D. and Garcia A. E., Proc. Natl. Acad. Sci. U.S.A. 104(52), 20805–20810 (2007). 10.1073/pnas.0706574105 [DOI] [PMC free article] [PubMed] [Google Scholar]
- 14.Pasenkiewicz-Gierula M., Rog T., Kitamura K., and Kusumi A., Biophys. J. 78(3), 1376–1389 (2000). 10.1016/S0006-3495(00)76691-4 [DOI] [PMC free article] [PubMed] [Google Scholar]
- 15.Leontiadou H., Mark A. E., and Marrink S. J., Biophys. J. 86(4), 2156–2164 (2004). 10.1016/S0006-3495(04)74275-7 [DOI] [PMC free article] [PubMed] [Google Scholar]
- 16.Bemporad D., Essex J. W., and Luttmann C., J. Phys. Chem. B 108(15), 4875–4884 (2004). 10.1021/jp035260s [DOI] [Google Scholar]
- 17.Klauda J. B., Kucerka N., Brooks B. R., Pastor R. W., and Nagle J. F., Biophys. J. 90(8), 2796–2807 (2006). 10.1529/biophysj.105.075697 [DOI] [PMC free article] [PubMed] [Google Scholar]
- 18.Saiz L. and Klein M. L., Acc. Chem. Res. 35(6), 482–489 (2002). 10.1021/ar010167c [DOI] [PubMed] [Google Scholar]
- 19.Feller S. E., in Current Topics in Membrane, edited by Benos D. J. and Simon S. A. (Elsevier, San Diego, 2008), Vol. 60, p. 466. [Google Scholar]
- 20.Rabinovich A. L. and Lyubartsev A. P., Polym Sci, Ser C 55(1), 162–180 (2013). 10.1134/S1811238213070060 [DOI] [Google Scholar]
- 21.Ulander J. and Haymet A. D. J., Biophys. J. 85(6), 3475–3484 (2003). 10.1016/S0006-3495(03)74768-7 [DOI] [PMC free article] [PubMed] [Google Scholar]
- 22.Bemporad D., Luttmann C., and Essex J. W., Biochim. Biophys. Acta-Biomembr. 1718(1–2), 1–21 (2005). 10.1016/j.bbamem.2005.07.009 [DOI] [PubMed] [Google Scholar]
- 23.Xiang T. X. and Anderson B. D., Adv. Drug Deliv. Rev. 58(12–13), 1357–1378 (2006). 10.1016/j.addr.2006.09.002 [DOI] [PubMed] [Google Scholar]
- 24.Wei C. and Pohorille A., J. Phys. Chem. B 115, 3681–3688 (2011). 10.1021/jp112104r [DOI] [PubMed] [Google Scholar]
- 25.Tejwani R. W., Davis M. E., Anderson B. D., and Stouch T. R., J. Pharm. Sci. 100(6), 2136–2146 (2011). 10.1002/jps.22441 [DOI] [PubMed] [Google Scholar]
- 26.Kapla J., Wohlert J., Stevensson B., Engstrom O., Widmalm G., and Maliniak A., J. Phys. Chem. B 117(22), 6667–6673 (2013). 10.1021/jp402385d [DOI] [PubMed] [Google Scholar]
- 27.Jambeck J. P. M. and Lyubartsev A. P., J. Phys. Chem. Lett. 4(11), 1781–1787 (2013). 10.1021/jz4007993 [DOI] [PubMed] [Google Scholar]
- 28.Grossfield A. and Woolf T. B., Langmuir 18(1), 198–210 (2002). 10.1021/la0106485 [DOI] [Google Scholar]
- 29.Rezai T., Bock J. E., Zhou M. V., Kalyanaraman C., Lokey R. S., and Jacobson M. P., J. Am. Chem. Soc. 128(43), 14073–14080 (2006). 10.1021/ja063076p [DOI] [PubMed] [Google Scholar]
- 30.Johansson A. C. V. and Lindahl E., Proteins 70(4), 1332–1344 (2008). 10.1002/prot.21629 [DOI] [PubMed] [Google Scholar]
- 31.Babakhani A., Gorfe A. A., Kim J. E., and McCammon J. A., J. Phys. Chem. B 112(34), 10528–10534 (2008). 10.1021/jp804710v [DOI] [PMC free article] [PubMed] [Google Scholar]
- 32.Yesylevskyy S., Marrink S. J., and Mark A. E., Biophys. J. 97(1), 40–49 (2009). 10.1016/j.bpj.2009.03.059 [DOI] [PMC free article] [PubMed] [Google Scholar]
- 33.MacCallum J. L., Bennett W. F. D., and Tieleman D. P., Biophys. J. 101(1), 110–117 (2011). 10.1016/j.bpj.2011.05.038 [DOI] [PMC free article] [PubMed] [Google Scholar]
- 34.Rafi S. B., Hearn B. R., Vedantham P., Jacobson M. P., and Renslo A. R., J. Med. Chem. 55(7), 3163–3169 (2012). 10.1021/jm201634q [DOI] [PMC free article] [PubMed] [Google Scholar]
- 35.Bock J. E., Gavenonis J., and Kritzer J. A., ACS Chem. Biol. 8(3), 488–499 (2013). 10.1021/cb300515u [DOI] [PMC free article] [PubMed] [Google Scholar]
- 36.Machan R. and Hof M., Biochim. Biophys. Acta-Biomembr. 1798(7), 1377–1391 (2010). 10.1016/j.bbamem.2010.02.014 [DOI] [PubMed] [Google Scholar]
- 37.Lindblom G. and Oradd G., Biochim. Biophys. Acta-Biomembr. 1788(1), 234–244 (2009). 10.1016/j.bbamem.2008.08.016 [DOI] [PubMed] [Google Scholar]
- 38.Kol M. A., de Kroon A., Killian J. A., and de Kruijff B., Biochemistry 43(10), 2673–2681 (2004). 10.1021/bi036200f [DOI] [PubMed] [Google Scholar]
- 39.Wimley W. C. and Thompson T. E., Biochemistry 30(6), 1702–1709 (1991). 10.1021/bi00220a036 [DOI] [PubMed] [Google Scholar]
- 40.Gurtovenko A. A. and Vattulainen I., Handb. Mod. Biophys. 2, 121–139 (2009). 10.1007/978-1-60761-314-5_5 [DOI] [Google Scholar]
- 41.Marrink S. J., de Vries A. H. and Tieleman D. P., Biochim Biophys. Acta-Biomembr. 1788(1), 149–168 (2009). 10.1016/j.bbamem.2008.10.006 [DOI] [PubMed] [Google Scholar]
- 42.Leftin A. and Brown M. F., Biochim. Biophys. Acta-Biomembr. 1808(3), 818–839 (2011). 10.1016/j.bbamem.2010.11.027 [DOI] [PMC free article] [PubMed] [Google Scholar]
- 43.Balaz S., Chem. Rev. 109(5), 1793–1899 (2009). 10.1021/cr030440j [DOI] [PMC free article] [PubMed] [Google Scholar]
- 44.Brown F. L. H., Annu. Rev. Phys. Chem. 59, 685–712 (2008). 10.1146/annurev.physchem.59.032607.093550 [DOI] [PubMed] [Google Scholar]
- 45.Brown F. L. H., Q. Rev. Biophys. 44(4), 391–432 (2011). 10.1017/S0033583511000047 [DOI] [PubMed] [Google Scholar]
- 46.Hu M. Y., Briguglio J. J., and Deserno M., Biophys. J. 102(6), 1403–1410 (2012). 10.1016/j.bpj.2012.02.013 [DOI] [PMC free article] [PubMed] [Google Scholar]
- 47.Nakamura T. and Shinoda W., J. Chem. Phys. 138(12), 124903 (2013). 10.1063/1.4795579 [DOI] [PubMed] [Google Scholar]
- 48.Marrink S. J., Risselada H. J., Yefimov S., Tieleman D. P., and de Vries A. H., J. Phys. Chem. B 111(27), 7812–7824 (2007). 10.1021/jp071097f [DOI] [PubMed] [Google Scholar]
- 49.Shelley J. C., Shelley M. Y., Reeder R. C., Bandyopadhyay S., Moore P. B., and Klein M. L., J. Phys. Chem. B 105(40), 9785–9792 (2001). 10.1021/jp011637n [DOI] [Google Scholar]
- 50.Cooke I. R. and Deserno M., J. Chem. Phys. 123(22), 224710 (2005). 10.1063/1.2135785 [DOI] [PubMed] [Google Scholar]
- 51.Lyubartsev A. P., Eur. Biophys. J. 35(1), 53–61 (2005). 10.1007/s00249-005-0005-y [DOI] [PubMed] [Google Scholar]
- 52.Izvekov S. and Voth G. A., J. Chem. Theory Comput. 2(3), 637–648 (2006). 10.1021/ct050300c [DOI] [PubMed] [Google Scholar]
- 53.Orsi M., Michel J., and Essex J. W., J. Phys.-Condens. Matter 22(15), 155106 (2010). 10.1088/0953-8984/22/15/155106 [DOI] [PubMed] [Google Scholar]
- 54.Marrink S. J. and Berendsen H. J. C., J. Phys. Chem. 100(41), 16729–16738 (1996). 10.1021/jp952956f [DOI] [Google Scholar]
- 55.Pohorille A., Cieplak P., and Wilson M. A., Chem. Phys. 204(2–3), 337–345 (1996). 10.1016/0301-0104(95)00292-8 [DOI] [PubMed] [Google Scholar]
- 56.Shinoda W., Mikami M., Baba T., and Hato M., J. Phys. Chem. B 108(26), 9346–9356 (2004). 10.1021/jp035998+ [DOI] [Google Scholar]
- 57.MacCallum J. and Tieleman D., Interactions between Small Molecules and Lipid Bilayers (Elsevier, Amsterdam, 2008). [Google Scholar]
- 58.Wei C. and Pohorille A., J. Am. Chem. Soc. 131, 10237–10245 (2009). 10.1021/ja902531k [DOI] [PubMed] [Google Scholar]
- 59.Cardenas A. E. and Elber R., Mol. Phys. 111(22–23), 3565–3578 (2013). 10.1080/00268976.2013.842010 [DOI] [PMC free article] [PubMed] [Google Scholar]
- 60.Jo S., Rui H. A., Lim J. B., Klauda J. B., and Im W., J. Phys. Chem. B 114(42), 13342–13348 (2010). 10.1021/jp108166k [DOI] [PubMed] [Google Scholar]
- 61.Ghaemi Z., Minozzi M., Carloni P., and Laio A., J. Phys. Chem. B 116(29), 8714–8721 (2012). 10.1021/jp301083h [DOI] [PubMed] [Google Scholar]
- 62.Parisio G., Stocchero M., and Ferrarini A., J. Chem. Theory Comput. 9(12), 5236–5246 (2013). 10.1021/ct400690t [DOI] [PubMed] [Google Scholar]
- 63.Marrink S. J., Sok R. M., and Berendsen H. J. C., J. Chem. Phys. 104(22), 9090–9099 (1996). 10.1063/1.471442 [DOI] [Google Scholar]
- 64.Falck E., Patra M., Karttunen M., Hyvonen M. T., and Vattulainen I., J. Chem. Phys. 121(24), 12676–12689 (2004). 10.1063/1.1824033 [DOI] [PubMed] [Google Scholar]
- 65.Rabinovich A. L., Balabaev N. K., Alinchenko M. G., Voloshin V. P., Medvedev N. N., and Jedlovszky P., J. Chem. Phys. 122(8), 084906 (2005). 10.1063/1.1850903 [DOI] [PubMed] [Google Scholar]
- 66.Cardenas A. E., Jas G. S., DeLeon K. Y., Hegefeld W. A., Kuczera K., and Elber R., J. Phys. Chem. B 116, 2739–2750 (2012). 10.1021/jp2102447 [DOI] [PMC free article] [PubMed] [Google Scholar]
- 67.Straub J. E. and Thirumalai D., Proc. Natl. Acad. Sci. U.S.A. 90(3), 809–813 (1993). 10.1073/pnas.90.3.809 [DOI] [PMC free article] [PubMed] [Google Scholar]
- 68.Janmey P. A. and Kinnunen P. K. J., Trends Cell Biol. 16(10), 538–546 (2006). 10.1016/j.tcb.2006.08.009 [DOI] [PubMed] [Google Scholar]
- 69.Faradjian A. K. and Elber R., J. Chem. Phys. 120(23), 10880–10889 (2004). 10.1063/1.1738640 [DOI] [PubMed] [Google Scholar]
- 70.West A. M. A., Elber R., and Shalloway D., J. Chem. Phys. 126(14), 145104 (2007). 10.1063/1.2716389 [DOI] [PubMed] [Google Scholar]
- 71.Majek P. and Elber R., J. Chem. Theory Comput. 6(6), 1805–1817 (2010). 10.1021/ct100114j [DOI] [PMC free article] [PubMed] [Google Scholar]
- 72.Kirmizialtin S. and Elber R., J. Phys. Chem. A 115(23), 6137–6148 (2011). 10.1021/jp111093c [DOI] [PMC free article] [PubMed] [Google Scholar]
- 73.Falck E., Patra M., Karttunen M., Hyvonen M. T., and Vattulainen I., Biophys. J. 87(2), 1076–1091 (2004). 10.1529/biophysj.104.041368 [DOI] [PMC free article] [PubMed] [Google Scholar]
- 74.Jas G. S., Hegefeld W. A., Majek P., Kuczera K., and Elber R., J. Phys. Chem. B 116(23), 6598–6610 (2012). 10.1021/jp211645s [DOI] [PMC free article] [PubMed] [Google Scholar]
- 75.Kreuzer S. M., Moon T. J., and Elber R., J. Chem. Phys. 139(12), 121902 (2013). 10.1063/1.4811366 [DOI] [PMC free article] [PubMed] [Google Scholar]
- 76.Kirmizialtin S., Nguyen V., Johnson K. A., and Elber R., Structure 20(4), 618–627 (2012). 10.1016/j.str.2012.02.018 [DOI] [PMC free article] [PubMed] [Google Scholar]
- 77.Maragliano L., Cottone G., Ciccotti G., and Vanden-Eijnden E., J. Am. Chem. Soc. 132(3), 1010–1017 (2010). 10.1021/ja905671x [DOI] [PubMed] [Google Scholar]
- 78.Elber R. and West A., Proc. Natl. Acad. Sci. U.S.A. 107, 5001–5005 (2010). 10.1073/pnas.0909636107 [DOI] [PMC free article] [PubMed] [Google Scholar]
- 79.Vanden Eijnden E., Venturoli M., Ciccotti G., and Elber R., J. Chem. Phys. 129(17), 174102 (2008). 10.1063/1.2996509 [DOI] [PMC free article] [PubMed] [Google Scholar]
- 80.Viswanath S., Kreuzer S. M., Cardenas A. E., and Elber R., J. Chem. Phys. 139(17), 174105 (2013). 10.1063/1.4827495 [DOI] [PMC free article] [PubMed] [Google Scholar]
- 81.Zwanzig R., Nonequilibrium Statistical Mechanics (Oxford University Press, Oxford, 2001). [Google Scholar]
- 82.Kreuzer S. M., Elber R., and Moon T. J., J. Phys. Chem. B 116(29), 8662–8691 (2012). 10.1021/jp300788e [DOI] [PMC free article] [PubMed] [Google Scholar]
- 83.Kuczera K., Jas G. S., and Elber R., J. Phys. Chem. A 113(26), 7461–7473 (2009). 10.1021/jp900407w [DOI] [PMC free article] [PubMed] [Google Scholar]
- 84.Shalloway D. and Faradjian A. K., J. Chem. Phys. 124(5), 054112 (2006). 10.1063/1.2161211 [DOI] [PubMed] [Google Scholar]
- 85.Anderson E., LAPACK Users’ Guide, 3rd ed. (Society for Industrial and Applied Mathematics, Philadelphia, 1999). [Google Scholar]
- 86.Jo S., Kim T., Iyer V. G., and Im W., J. Comput. Chem. 29(11), 1859–1865 (2008). 10.1002/jcc.20945 [DOI] [PubMed] [Google Scholar]
- 87.Jo S., Lim J. B., Klauda J. B., and Im W., Biophys. J. 97(1), 50–58 (2009). 10.1016/j.bpj.2009.04.013 [DOI] [PMC free article] [PubMed] [Google Scholar]
- 88.Jorgensen W. L. and Tiradorives J., J. Am. Chem. Soc. 110(6), 1657–1666 (1988). 10.1021/ja00214a001 [DOI] [PubMed] [Google Scholar]
- 89.Jorgensen W. L., Chandrasekhar J., Madura J. D., Impey R. W., and Klein M. L., J. Chem. Phys. 79(2), 926–935 (1983). 10.1063/1.445869 [DOI] [Google Scholar]
- 90.Cordomi A., Caltabiano G., and Pardo L., J. Chem. Theory Comput. 8(3), 948–958 (2012). 10.1021/ct200491c [DOI] [PubMed] [Google Scholar]
- 91.Javanainen M., Hammaren H., Monticelli L., Jeon J. H., Miettinen M. S., Martinez-Seara H., Metzler R., and Vattulainen I., Faraday Discuss. 161, 397–417 (2013). 10.1039/c2fd20085f [DOI] [PubMed] [Google Scholar]
- 92.Elber R., Roitberg A., Simmerling C., Goldstein R., Li H. Y., Verkhivker G., Keasar C., Zhang J., and Ulitsky A., Comput. Phys. Commun. 91(1–3), 159–189 (1995). 10.1016/0010-4655(95)00047-J [DOI] [Google Scholar]
- 93.Ruymgaart A. P., Cardenas A. E., and Elber R., J. Chem. Theory Comput. 7, 3072 (2011). 10.1021/ct200360f [DOI] [PMC free article] [PubMed] [Google Scholar]
- 94.Siu S. W. I., Vacha R., Jungwirth P., and Bockmann R. A., J. Chem. Phys. 128(12), 125103 (2008). 10.1063/1.2897760 [DOI] [PubMed] [Google Scholar]
- 95.Liu Y. F. and Nagle J. F., Phys. Rev. E 69(4), 040901 (2004). 10.1103/PhysRevE.69.040901 [DOI] [PMC free article] [PubMed] [Google Scholar]
- 96.Essmann U., Perera L., Berkowitz M. L., Darden T., Lee H., and Pedersen L. G., J. Chem. Phys. 103(19), 8577–8593 (1995). 10.1063/1.470117 [DOI] [Google Scholar]
- 97.Weinbach Y. and Elber R., J. Comput. Phys. 209(1), 193–206 (2005). 10.1016/j.jcp.2005.03.015 [DOI] [Google Scholar]
- 98.Ryckaert J. P., Ciccotti G., and Berendsen H. J. C., J. Comput. Phys. 23(3), 327–341 (1977). 10.1016/0021-9991(77)90098-5 [DOI] [Google Scholar]
- 99.Tuckerman M., Berne B. J., and Martyna G. J., J. Chem. Phys. 97(3), 1990–2001 (1992). 10.1063/1.463137 [DOI] [Google Scholar]
- 100.Berezhkovskii A., Hummer G., and Szabo A., J. Chem. Phys. 130(20), 205102 (2009). 10.1063/1.3139063 [DOI] [PMC free article] [PubMed] [Google Scholar]
- 101.Metzner P., Schutte C., and Vanden Eijnden E., Multiscale Model. Simul. 7, 1192–1219 (2009). 10.1137/070699500 [DOI] [Google Scholar]
- 102.Sugii T., Takagi S., and Matsumoto Y., J. Chem. Phys. 123(18), 184714 (2005). 10.1063/1.2102900 [DOI] [PubMed] [Google Scholar]
- 103.Huster D., Jin A. J., Arnold K., and Gawrisch K., Biophys. J. 73(2), 855–864 (1997). 10.1016/S0006-3495(97)78118-9 [DOI] [PMC free article] [PubMed] [Google Scholar]
- 104.Rawicz W., Smith B. A., McIntosh T. J., Simon S. A., and Evans E., Biophys. J. 94(12), 4725–4736 (2008). 10.1529/biophysj.107.121731 [DOI] [PMC free article] [PubMed] [Google Scholar]
- 105.Mathai J. C., Tristram-Nagle S., Nagle J. F., and Zeidel M. L., J. Gen. Physiol. 131(1), 69–76 (2008). 10.1085/jgp.200709848 [DOI] [PMC free article] [PubMed] [Google Scholar]
- 106.Mark P. and Nilsson L., J. Phys. Chem. A 105(43), 9954–9960 (2001). 10.1021/jp003020w [DOI] [Google Scholar]
- 107.Yamamoto E., Akimoto T., Shimizu H., Hirano Y., Yasui M., and Yasuoka K., J. Phys. Chem. B 116(30), 8989–8995 (2012). 10.1021/jp303330c [DOI] [PubMed] [Google Scholar]
- 108.Booker R. D. and Sum A. K., Biochim. Biophys. Acta-Biomembranes 1828(5), 1347–1356 (2013). 10.1016/j.bbamem.2013.01.016 [DOI] [PubMed] [Google Scholar]
- 109.Khavrutskii I. V., Gorfe A. A., Lu B. Z., and McCammon J. A., J. Am. Chem. Soc. 131(5), 1706–1716 (2009). 10.1021/ja8081704 [DOI] [PMC free article] [PubMed] [Google Scholar]
- 110.Mugnai M. L. and Elber R., “Exact Milestoning” (unpublished).


