

Abstract
Chromatin dynamics modulate DNA repair factor accessibility throughout the DNA damage response. The spatiotemporal scale upon which these dynamics occur render them invisible to live cell imaging. Here we present a believed novel assay to monitor the in vivo structural rearrangements of chromatin during DNA repair. By pair correlation analysis of EGFP molecular flow into chromatin before and after damage, this assay measures millisecond variations in chromatin compaction with submicron resolution. Combined with laser microirradiation we employ this assay to monitor the real-time accessibility of DNA at the damage site. We find from comparison of EGFP molecular flow with a molecule that has an affinity toward double-strand breaks (Ku-EGFP) that DNA damage induces a transient decrease in chromatin compaction at the damage site and an increase in compaction to adjacent regions, which together facilitate DNA repair factor recruitment to the lesion with high spatiotemporal control.
Introduction
Genome integrity is constantly being challenged by endogenous products of normal metabolism, such as reactive oxygen species, and by exogenous DNA damaging agents such as UV radiation, ionizing radiation, and mutagenic chemicals (1). If the DNA lesions that result are not correctly repaired, mutations ranging from single nucleotide changes to chromosomal rearrangements accumulate and this can lead to cancer, developmental abnormalities, and cell death (2). To prevent the accumulation of such mutations, lesion-specific repair factors are recruited to the damage site to invoke the appropriate DNA repair pathway (3). Although many factors critical for DNA repair have been identified by genetic studies, our knowledge of how their activity is coordinated in the cell nucleus remains incomplete because methods of detection with high spatiotemporal resolution are necessary to understand the DNA damage response in vivo (4,5).
In vivo DNA damage and repair does not occur on a naked DNA template; instead, it occurs on chromatin, where DNA is complexed with histones and compacted into higher-order structures (6). As a result, both the sensitivity of DNA to damage and the kinetics of repair are regulated by the underlying level of chromatin compaction (7). Given that any process that involves nuclear DNA requires modification of chromatin structure through the rearrangement of nucleosomes, traditionally it was thought that an open chromatin structure would facilitate DNA damage factor recruitment and repair (8). For example, it has been shown that heterochromatic double-strand breaks (DSBs) are more difficult to repair and process than euchromatic DSBs, because the tightly compacted nature of heterochromatin inhibits access of the DNA damage response proteins to the break (9). There is increasing evidence, however, for damage site recruitment and repair function of heterochromatin compaction factors in addition to the previously identified chromatin opening factors (7,10–12). Thus, the precise chromosome dynamics at damage sites remains controversial, and as a consequence, little is known about the regulation of higher-order chromatin structure in response to DNA damage.
As can be seen, significant challenges remain in the DNA repair field. This is in part because elucidation of how a DNA damage response is coordinated by the recruited DNA repair factors requires a means to understand how chromatin compaction modulates their access to the site of DNA damage. Although insights have been gained from experiments based on fluorescence recovery after photobleaching (13–16), single-particle tracking (17), and fluorescence correlation spectroscopy (18–20), none of these methods have the capability to measure how chromatin regulates overall molecular flow and therefore DNA repair factor accessibility in live cells at the single molecule level. In 2010, we established a method to indirectly measure chromatin compaction in live cells by pair correlation analysis of EGFP (an inert tracer) accessibility into fluorescently-labeled chromatin (21). Pair correlation analysis is a believed-novel approach to spatiotemporal correlation spectroscopy, which maps the molecular flow pattern of a population of molecules by temporal cross-correlation of a pair of points, separated by a distance that tests the diffusive route of interest (22). Based on this method we found the naturally occurring changes in chromatin compaction during the cell cycle to modulate protein access as detected by changes in the spatial distribution and temporal dynamics of EGFP within the nucleus (23). In particular, we found that interphase chromatin caused two disconnect molecular flows of EGFP associated with high and low chromatin density regions and that this channeled regulation disappears in dividing cells where molecular flow of EGFP into the mitotic chromosome is no longer obstructed (21,24).
Here we establish an assay to measure throughout the DNA damage response, the real-time changes in chromatin compaction and DNA repair factor accessibility in live cells. The assay employs near-infrared laser microirradiation to induce DNA damage at specific submicron regions in the cell nucleus and then pair correlation analysis of EGFP molecular flow to detect the millisecond changes in chromatin accessibility before and after damage. We first use the assay to characterize the cell-cycle-dependent response of chromatin compaction to DNA damage, both at the lesion site and adjacent regions, to see whether chromatin structural rearrangements during repair are local and if so, the impact that rearrangement has on surrounding undamaged chromatin. We then investigate how the detected changes in chromatin compaction local or adjacent to the damage site and in different cell-cycle stages regulate the spatiotemporal dynamics of specific nuclear factors involved in the DNA damage response. From comparison of EGFP molecular flow with Ku-EGFP (an abundant nuclear protein with essential function in DSB repair) we find post-DNA damage chromatin to become more accessible at the lesion site and more compact in adjacent regions, which together enables DNA repair factor recruitment to the damage site lesion with high spatial and temporal control. We believe this dynamic rearrangement of chromatin could explain why some studies observe an opening of chromatin at the damage site and other studies detect heterochromatin factor recruitment, and thus demonstrates the power of this analytical tool, which has the spatiotemporal resolution to reveal a level of complexity and heterogeneity to the DNA damage response previously masked by ensemble-based measurements.
Materials and Methods
Sample preparation
HeLa cells were grown in Dulbecco’s modified Eagle medium supplemented with 10% fetal bovine serum, glutamine (2 mmol/L, penicillin (100 IU/mL), and streptomycin (100 IU/mL). The GFP clone stable cell line was described in Kong et al. (25). For G1 cells, mitotic cells were marked on gridded coverslips. Three hours after their division, the daughter cells were subjected for analysis. For synchronization of cells in S or G2 phase, cells were synchronized by double-thymidine block, and were released from thymidine and cultured for 4 h for S phase and 8 h for G2 phase as described in Gregson et al. (26). The full-length human Ku70 was cloned with EGFP placed in-frame at its C-terminus after altering Ku70’s endogenous termination codon. This fusion was inserted into pIRESneo3.0 (Clontech/Takara Bio USA, Madison, WI). The resulting fusion protein was expressed in human cell lines and was found to localize to the nucleus as expected. Stable HeLa cell lines were made expressing GFP-Ku (kindly provided by Dr. Akira Yasui at Tohoku University, Sendai, Miyagi, Japan). Proper expression and subcellular localization were confirmed by Western blot and microscopy, respectively. Stable clones were maintained in the culture medium containing 300 μg/mL G418.
Microscopy
The microscopy measurements were performed on a model No. LSM710 Quasar laser scanning microscope, using a 40× water immersion objective, 1.2 N.A. (Carl Zeiss, Oberkochen, Germany). EGFP was excited with the 488-nm emission line of an Argon laser. Hoechst 33342 was excited with the 405-nm emission line of a diode laser. EGFP and Hoechst were measured sequentially using the 510–560 nm and 410–490 nm emission ranges, respectively. For each channel the pinhole was set to 1 Airy Unit. A detailed description of the experimental settings used for the line-scan measurement is from Hinde et al. (21). Briefly, we acquire data by rapidly scanning a diffraction-limited laser beam (488 nm) along a line drawn inside the nucleus across a discontinuity in chromatin density. Measuring a line of 64 pixels at a zoom that results in a line length of 10 μm, we sample fluorescence every 150 nm. The maximum scanning speed for these settings was selected (pixel dwell time 6.3 μs, line time 0.945 ms) so that the EGFP molecules could be correlated in time between lines. In general, for each experiment, 1 × 10⁵ consecutive lines (with no intervals between lines) were acquired. Time regions within each experiment with no average change in fluorescence intensity (e.g., photobleaching) were then selected for the correlation analysis.
Laser microirradiation
For all microirradiation experiments, the two-photon Ti:Sapphire laser (80 fs, repetition rate 80 MHz; Spectra-Physics Mai Tai, Newport Beach, CA) was tuned to 780 nm and used in conjunction with a model No. LSM710 Quasar laser-scanning microscope (Carl Zeiss). The laser beam was then focused on a small section of the nucleus (10 × 1 μm), which avoided the nucleolus or nuclear envelope and a frame scan acquired (300 × 40 pixels, 21 μs/pixel) at a power level of 0.5 mW, as measured at the objective. These conditions were found to recruit DNA repair factor Ku70 (see Fig. S1 in the Supporting Material) and therefore induce both strand breaks (single and double). A lower laser power (0.2 mW) did not recruit Ku70 (see Fig. S1) and had no effect on chromatin accessibility (see Fig. S2). In the majority of cases, however, a higher laser power (0.9–1.4 mW) recruited a high level of Ku-70 that affected cell health and induced irreversible change on chromatin accessibility (see Fig. S2). Laser microirradiation at 0.5 mW in all experiments presented in the Results did not induce whole cell movement or significant change in nuclear morphology as shown in Fig. S3.
Data analysis
Calculation of the pair-correlation functions was done using the SIMFCS software developed at the Laboratory for Fluorescence Dynamics (www.lfd.uci.edu), as described in the Supporting Material and previously published articles (21,22,27). Intensity data are presented by using a carpet representation in which the x coordinate corresponds to the point along the line (pixels) and the y coordinate corresponds to the time of acquisition. The pair correlation functions (pCF, pixels) are displayed in pseudo-colors in an image in which the x coordinate corresponds to the point along the line and the y coordinate corresponds to the pair correlation time in a log scale. The distances at which pCF analysis were carried out were not fixed across all experiments, but instead determined on an individual basis by the chromatin density variation along each line measured. In general, a distance of 4–6 pixels (which corresponds to 600–900 nm) was employed.
Results
Rules to interpreting pair correlation analysis of chromatin compaction during the DNA damage response
The chromatin network is known to obstruct molecular diffusion and depending on the local status of compaction, molecules are directed to diffuse either around or through an encountered chromatin fiber. Given that pCF analysis can detect and characterize the penetrability of a barrier to diffusion by temporal cross-correlation of a pair of points at a set distance, the different molecular routes that chromatin compaction imparts on diffusion of an inert molecule can be distinguished and used as a read-out of chromatin accessibility. Here we demonstrate this concept in live human cells stably transfected with monomeric EGFP (a freely diffusing inert molecule) and stained with Hoechst 33342 (a DNA probe) as a reference of local chromatin density (Fig. 1 A). For each cell tested, we select a line scan within the nucleus that traverses a high chromatin density environment (Fig. 1 B) so that we may test the compaction of that zone before and after DNA damage. The compaction status of the traversed chromatin density region is measured by scanning the selected line 1 × 10⁵ times in the EGFP channel, using the experimental settings described in the Materials and Methods.
Figure 1.
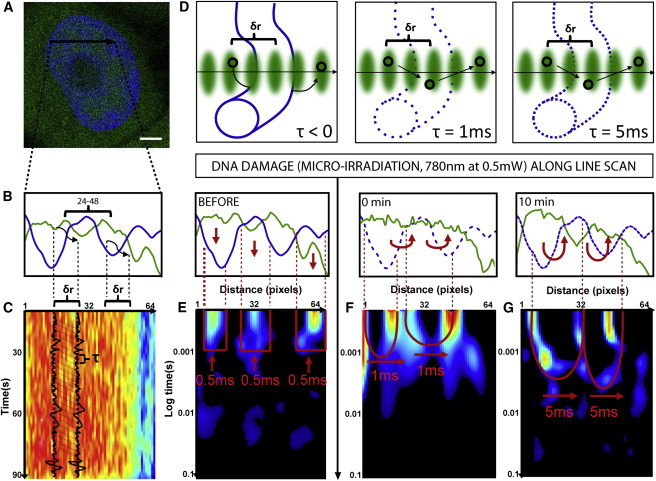
Changes in chromatin compaction during the DNA damage response measured by pair correlation analysis of EGFP molecular flow. (A) HeLa cell expressing EGFP with the chromatin marked by Hoechst 33342, scale bar equals 3 μm. The line scan selected for pair correlation analysis of EGFP molecular flow with respect to chromatin superimposed. (B) Intensity profile of free EGFP (green) and DNA (blue) along the selected line scan shows a high-density chromatin region between pixels 24 and 48 that slightly excludes EGFP from this environment. (C) Intensity carpet of free EGFP along the selected line scan (1 × 10⁵ lines). Each column of the intensity carpet thus contains an intensity fluctuation and pair correlation analysis can be performed between columns of the intensity carpet at a distance (δr) that cross-correlates intensity fluctuations located outside the high-density chromatin region to intensity fluctuations located inside the high-density region. The time delay (τ) at which maximum cross-correlation is observed between two columns indicates the average time taken by the molecules to enter the chromatin region. (D) In the instance a chromatin region is inaccessible, this will cause molecules to diffuse around the fiber and τ < 0. Alternatively, if a chromatin region is accessible and therefore allows molecules to diffuse through it, depending on its compaction status this will cause τ > 0. (E) Pair correlation analysis of intact chromatin at a distance of 5 pixels (pCF(5)) reveals disconnect molecular flow (as indicated by vertical red arrows) inside and outside of the chromatin (blue line). (F) Pair correlation analysis of chromatin 0 min after damage at pCF(5) reveals moderately delayed molecular flow in and out of the chromatin on a timescale of 1 ms (as indicated by the double-arc feature and horizontal red arrows). (G) Pair correlation analysis of chromatin 10 min after damage at pCF(5) reveals significantly delayed molecular flow in and out of the chromatin on a timescale of 5 ms. To see this figure in color, go online.
The acquired lines are then constructed into an intensity carpet (Fig. 1 C), and pair correlation analysis is performed between columns at a distance (δr) that cross-correlates intensity fluctuations located outside the high-density chromatin region to intensity fluctuations located inside the high-density region (typically 5 pixels, as schematically shown in Fig. 1, B and C). The time delay (τ) at which maximum cross-correlation is observed between two columns indicates the average time taken by the molecules to enter the chromatin region. Thus, depending on the tested chromatin region’s accessibility, a maximum of cross-correlation is not observed for pCF(δr) (τ < 0) in the instance the molecules are directed to diffuse around the fiber, or a peak of positive correlation is observed for pCF(δr) (τ > 0) with a time delay that is proportional to the degree of difficulty in performing the transit (Fig. 1 D).
The compaction status of the intact chromatin regions along the line selected in Fig. 1, A–C, can thus be assessed by construction of the cross-correlation profile calculated for each pixel pair along the line scan at a distance of 5 pixels, into a pCF carpet (Fig. 1 E). As can be seen from Fig. 1 E, at this pCF distance EGFP molecular flow along the line scan is disconnected, with diffusion only being observed inside or outside of the high-density chromatin regions at a characteristic time of τ = 0.5 ms. The lack of positive cross-correlation observed in those columns that measure EGFP flow into or out of the chromatin environment indicates that the intact chromatin regions along the selected line scan are inaccessible on the timescale of the experiment. To test whether this mode of regulation imparted by intact chromatin on EGFP accessibility is changed during DNA repair, we then induced DNA damage along this line scan by exposure to near-infrared radiation (780 nm, 0.5 mW), at a power level predetermined to recruit DNA repair factor Ku70 (see Fig. S1). The compaction status of the post-DNA damage chromatin is then assessed by reacquiring the selected line scan and performing pair correlation analysis again at a distance of 5 pixels (Fig. 1 F). Neither cell movement nor significant change in nuclear morphology was observed post-microirradiation (see Fig. S2 A).
From inspection of Fig. 1 F we find that, post-damage, EGFP still diffuses inside or outside of the high-density chromatin regions with a characteristic time of τ = 0.5 ms, but now in those columns that measure flow into and out of this environment we see a delayed peak of positive cross-correlation at τ = 1 ms. Thus, this result indicates that DNA damage made the high-density chromatin region accessible to EGFP diffusion and the degree of access induced can be extracted from the double-arc feature that is produced in the derived pCF carpet (Fig. 1 F); the depth of each arc equals the delay time to enter or exit the chromatin. As can be seen in Fig. 1 G, if we measure again the compaction status of chromatin along the line scan at 10 min post-DNA damage, we find the depth of the double-arc feature to lengthen to τ = 5 ms. Thus, the assay reveals DNA damage to induce a transient decrease in chromatin compaction that enables passive diffusion of inert molecules in and out of this environment, and at 10 min a reversal of this access by a mechanism that reinstates chromatin compaction.
Cell-cycle-specific response of chromatin compaction to DNA damage
Based on demonstration of the assay as sensitive to changes in chromatin compaction induced by DNA damage, here we test whether the detected increase in accessibility of chromatin during the initial stages of DNA repair is local to the DNA damage site and a cell-cycle-specific phenomenon. To achieve this, we first implement the developed assay in a G1 interphase nucleus (Fig. 2 A). However, this time we compare the changes in compaction experienced by chromatin directly damaged from exposure to infrared radiation (780 nm, 0.5 mW applied across line 1) with chromatin that is undamaged 3 μm above the damage site (line 2). Neither cell movement nor significant change in nuclear morphology was observed post-microirradiation (see Fig. S2 B).
Figure 2.
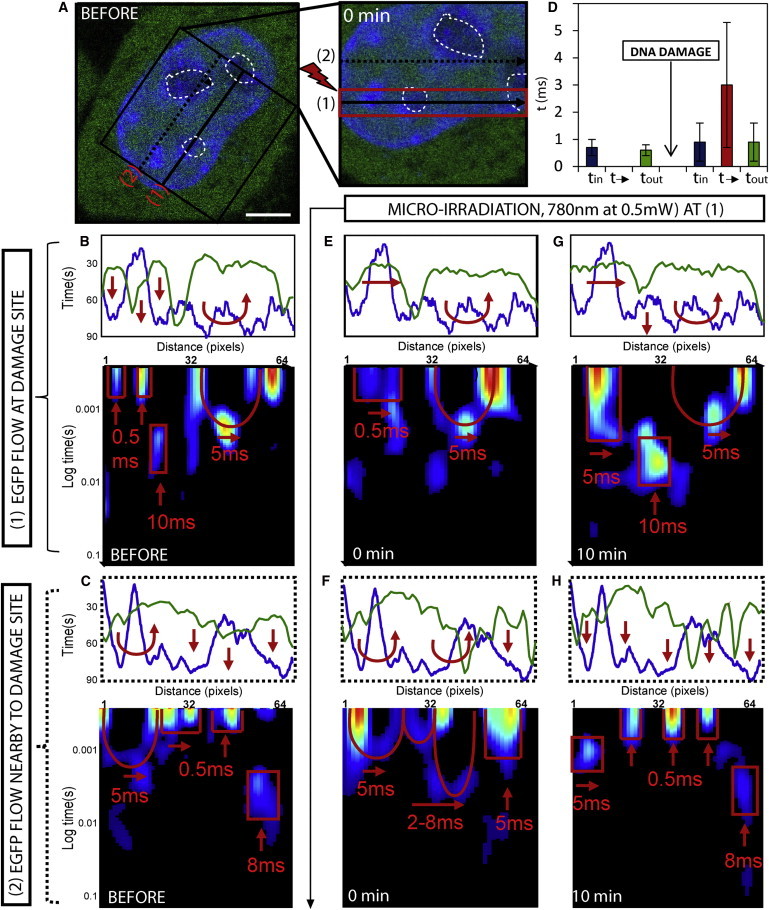
Changes in G1 interphase chromatin compaction during DNA damage response. (A) G1 interphase HeLa cell expressing EGFP with the chromatin marked by Hoechst 33342, scale bar equals 3 μm. The line scan selected for pair correlation analysis of EGFP molecular flow with respect to damaged and undamaged chromatin superimposed at position 1 and 2, respectively. DNA damage is induced along the line scan at position 1 by microirradiation and then the chromatin is measured as position 1 and 2 at 0–10 min post-damage. (B and C) Intensity profile of free EGFP (green) and DNA (blue) along the line scan at position 1 and 2, respectively, before DNA damage. The highest density chromatin region along each line (pixels 8–16 in panel B and pixels 36–60 in panel C) excludes EGFP. Pair correlation analysis along each line scan reveals the high-density chromatin regions to cause disconnect in molecular flow (indicated by vertical red arrows). (D) The average time delay for EGFP molecular flow inside, outside, and in-between interphase chromatin before DNA damage (representative data shown in panel B) and how these times are changed after DNA damage (representative data shown in panel E). (E) Intensity profile of free EGFP and DNA along the line scan at position 1 at 0 min after DNA damage reveals the highest-density chromatin region (pixels 8–16) to no longer exclude EGFP. Pair correlation analysis along this line at pCF(5) reveals the chromatin density region to now be accessible on a timescale of 0.5 ms (indicated by horizontal red arrows). (F) Intensity profile of free EGFP and DNA along the line scan at position 2 at 0 min after DNA damage shows the high-density chromatin region between pixels 36 and 60 to exclude more EGFP. Pair correlation analysis along this line scan at pCF(5) reveals this chromatin density region be less accessible (indicated by vertical red arrows). (G) Intensity profile of free EGFP and DNA along the line scan at position 1 at 10 min after DNA damage, shows the high-density chromatin region between pixels 8 and 16 to remain accessible to EGFP. Pair correlation analysis along this line scan at this time reveals the chromatin density region to be slightly less accessible on a timescale of 5 ms (as indicated by horizontal red arrows). (H) Intensity profile of free EGFP and DNA along the line scan at position 2 at 10 min after DNA damage shows the high-density chromatin region to remain inaccessible to EGFP (as indicated by horizontal red arrows). To see this figure in color, go online.
If we first consider the structure of intact G1 interphase chromatin along line scan 1 (Fig. 2 B) and line scan 2 (Fig. 2 C), we find in agreement with Fig. 1 that before microirradiation there is an exclusion of EGFP from the highest density chromatin region in each case. The exclusion of EGFP from pixels 8–16 in Fig. 2 B and pixels 36–60 in Fig. 2 C can be explained by pair correlation analysis of EGFP molecular flow, which reveals in agreement with Fig. 1 and previous studies (21) that G1 interphase chromatin is inaccessible on the timescale of the experiment. Only discrete bands of correlation are observed for EGFP diffusion inside or outside of the high-density chromatin region on a timescale of τ = 0.7 ± 0.3 ms and τ = 0.6 ± 0.2 ms, respectively (Fig. 2 D, N = 6 cells).
If we then compare how this mode of regulation is changed at lines 1 and 2 after induction of DNA damage along only the line scan positioned at 1, we find from analysis of chromatin at the damage site (Fig. 2 E) that EGFP is no longer excluded from the high-density chromatin region between pixels 8–16 (Fig. 2 E). This change in localization, which is in agreement with Fig. 1, can be explained by the pair correlation analysis of EGFP flow that reveals the G1 phase chromatin to become accessible toward passive diffusion on a timescale of τ = 3 ± 2.3 ms (Fig. 2 D, N = 6 cells). Intriguingly, analysis of the undamaged chromatin 3 μm above the damage site (Fig. 2 F) reveals the opposite. The chromatin region between pixels 36–60 that partially excluded EGFP before damage now does so more efficiently. This increased exclusion of EGFP can be explained by the pair correlation analysis, which reveals the delay time to enter this high-density region to have increased and even low chromatin regions that were previously accessible by free diffusion now cause a delay.
At 10 min post-DNA damage, we find the damaged chromatin to remain accessible (Fig. 2 G) and the undamaged chromatin to become inaccessible (Fig. 2 H), as indicated by a further increase in exclusion of EGFP from chromatin density regions and a completely disconnected pair correlation carpet. Thus, it is as if the loosening of chromatin at the damage site (as indicated by an increase in EGFP accessibility) causes a tightening of adjacent chromatin regions (as indicated by a decrease in EGFP accessibility) in a similar manner to what occurs upon pulling apart a twisted rope. Similar results were obtained throughout the remaining stages of interphase, as shown in Fig. S4 from experiments performed in S and G2 cells.
We next tested whether the observed spatiotemporal changes of chromatin in interphase are also induced in mitosis (Fig. 3 A). As can be seen in Fig. 3 A, in an analogous manner to the experiment presented in Fig. 2, we scan a line that is directly damaged from exposure to infrared radiation (line 1) and a second line that is 3 μm above the damage site (line 2), which should remain intact after induction of damage. Neither cell movement nor significant change in nuclear morphology was observed post-microirradiation (see Fig. S2 C). If we first consider the structure of the intact mitotic chromosome along line scan 1 (Fig. 3 B) and line scan 2 (Fig. 3 C), we find that there is significant exclusion of EGFP from the mitotic chromosome between pixels 10 and 46 in Fig. 3 B and pixels 10 and 50 in Fig. 3 C. Pair correlation analysis of EGFP molecular flow along each line reveals the mitotic chromosome to be accessible at both line-scan positions, with EGFP diffusion not only being detected inside (τ = 1.2 ± 0.4 ms) and outside (τ = 0.8 ± 0.3 ms) of the mitotic chromosome but also in columns that test entry and exit out of this high-density environment, albeit on a delayed timescale of τ = 5.4 ± 3.1 ms (Fig. 3 D, N = 5 cells). A diffusive behavior that gives rise to the double-arc feature described in Fig. 1, where the depth of each arc indicates the timescale of entry and exit, is a result previously established for regulation of intranuclear diffusion by mitotic chromosomes (24).
Figure 3.
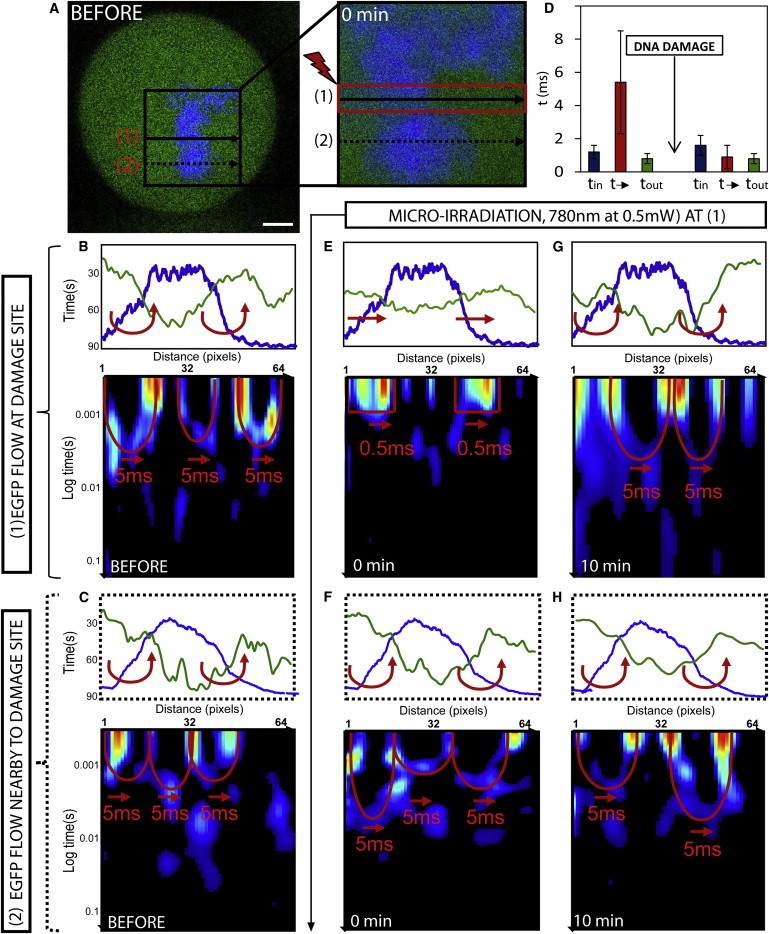
Changes in mitotic phase chromosome compaction during DNA damage response. (A) Mitotic HeLa cell expressing EGFP with the chromatin marked by Hoechst 33342, scale bar equals 3 μm. The line scan selected for pair correlation analysis of EGFP molecular flow with respect to damaged and undamaged chromatin superimposed at position 1 and 2, respectively. DNA damage is induced along the line scan at position 1 by microirradiation and then the chromatin is measured 0–10 min afterward. (B) Intensity profile of free EGFP (green) and DNA (blue) along the line scan at position 1 before DNA damage shows a high-density chromatin region between pixels 10 and 46 to exclude EGFP from this environment. Pair correlation analysis along this line scan reveals this chromatin density region to cause delayed molecular flow (as indicated by double-arc feature). (C) Intensity profile of free EGFP (green) and DNA (blue) along the line scan at position 2 before DNA damage shows a high-density chromatin region between pixels 10 and 50 to exclude EGFP from this environment. Pair correlation analysis along this line scan reveals this chromatin density region to cause delayed molecular flow (as indicated by double-arc feature). (D) The average time delay for EGFP molecular flow inside, outside, and in-between mitotic chromosome before DNA damage (representative data shown in panel B) and how these times are changed after DNA damage (representative data shown in panel E). (E) Intensity profile of free EGFP (green) and DNA (blue) along the line scan at position 1 at 0 min after DNA damage shows the high-density chromatin region between pixels 10 and 46 to no longer exclude EGFP from this environment. Pair correlation analysis along this line scan reveals this chromatin density region to no longer cause delayed molecular flow but instead free diffusion in and out of this environment. (F) Intensity profile of free EGFP (green) and DNA (blue) along the line scan at position 2 at 0 min after DNA damage shows the high-density chromatin region between pixels 10 and 50 to still exclude EGFP from this environment. Pair correlation analysis along this line reveals no change in chromatin accessibility. (G) Intensity profile of free EGFP (green) and DNA (blue) along the line scan at position 1 at 10 min after DNA damage shows the high-density chromatin region between pixels 10 and 46 to again exclude EGFP from this environment. Pair correlation analysis along this line scan reveals this chromatin density region to again cause a delay in molecular flow in and out of this environment. (H) Intensity profile of free EGFP (green) and DNA (blue) along the line scan at position 2 at 10 min after DNA damage shows the high-density chromatin region between pixels 10 and 50 to still exclude EGFP from this environment. Pair correlation analysis along this line reveals no change in chromatin accessibility. To see this figure in color, go online.
If we compare how this mode of regulation is changed at lines 1 and 2 after induction of DNA damage along line 1, we find from analysis of the mitotic chromosome at the damage site (Fig. 3 E) that EGFP is no longer excluded from this highly dense region (pixels 10–46 in Fig. 3 E). This change in localization is explained by pair correlation analysis of EGFP flow, which reveals the mitotic chromosome at position 1 to become more accessible, now causing τ = 0.9 ± 0.7 ms delay for molecules to enter or exit this environment (Fig. 3 D, N = 5 cells). Analysis of the undamaged chromosome 3 μm above the damage site (Fig. 3 F) reveals no significant change in accessibility to adjacent regions of the mitotic chromosome, despite increased access at the damage site. This is in contrast to the G1 interphase chromatin, where structural rearrangements at the DNA damage site cause adjacent regions to be altered. At 10-min post-DNA damage, we find the damaged chromatin along line 1 (Fig. 3 G) to undergo a structural rearrangement that reinstates the compaction status observed before DNA damage. That is, EGFP accessibility is again restricted as observed by an exclusion of EGFP from the mitotic chromosome and a 5-ms delay to enter or exit this high-density environment. Analysis of the undamaged chromosome 3 μm above the damage site (Fig. 3 H) at this time continues to reveal no significant change in accessibility. These results indicate that, unlike in interphase cells, structural rearrangements of chromatin induced by DNA damage in mitotic cells are highly transient and localized to the DNA damage site, without detectable impact on adjacent regions.
Ku accessibility during cell-cycle-dependent DNA repair response
Now that we understand the changes DNA damage induces to chromatin compaction local to the damage site and adjacent chromatin regions in different cell-cycle stages, we then decided to investigate whether these dynamics modulate access of specific nuclear factors directly involved in DNA repair to the DNA template. In particular, we measured the real-time access of Ku-EGFP to DNA at the damage site in different cell-cycle stages by pair correlation analysis of Ku-EGFP molecular flow. As can be seen in Fig. 4 A, we first investigated Ku-GFP access in a G1 interphase nucleus, and as with the experiments depicted in Figs. 1–3, we selected a line scan within this nucleus that traversed a high-density chromatin region. As can be seen in Fig. 4 B, before DNA damage, Ku-EGFP is dispersed throughout the nucleus and then immediately after microirradiation of the selected line there is a significant accumulation of Ku-EGFP along the induced damage site. If we compare the vertical profile of this accumulation before and after DNA damage (Fig. 4 B),we see that Ku-EGFP recruitment is spatially restricted to the damage site, a result that is in agreement with Merkle et al. (19). It might be explained by our free EGFP results in a G1 interphase nucleus (Fig. 2), which suggest adjacent chromatin regions to be tightened and therefore serve to restrict accumulation of molecules to the loosened damage site.
Figure 4.
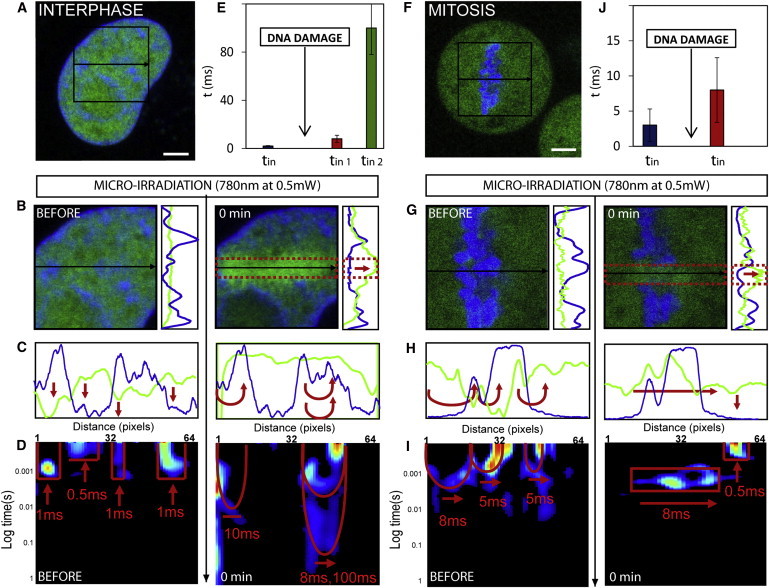
Ku-GFP kinetics in double-strand break repair of interphase and mitotic chromatin. (A) G1 interphase HeLa cell expressing Ku-EGFP with the chromatin marked by Hoechst 33342. (B) Plane in the G1 interphase nucleus across which the line scan was selected for pair correlation analysis of Ku-EGFP molecular before and after DNA damage, and the vertical intensity profiles of Ku-EGFP (green line) and DNA (blue line). (C) Intensity profile of free Ku-EGFP (green) and DNA (blue) along the line scan before and after DNA damage. (D) Pair correlation analysis along this line scan before and after DNA damage at a distance of 5 pixels (pCF(5)). (E) The average time delay for Ku-EGFP interaction with interphase chromatin before and after DNA damage (representative data shown in panel D). (F) A mitotic HeLa cell expressing Ku-EGFP with the chromatin marked by Hoechst 33342. (G) Plane in the mitotic nucleus across which the line scan was selected for pair correlation analysis of Ku-EGFP molecular before and after DNA damage, and the vertical intensity profiles of Ku-EGFP (green line) and DNA (blue line). (H) Intensity profile of free Ku-EGFP (green) and DNA (blue) along the line scan before and after DNA damage. (I) Pair correlation analysis along this line scan before and after DNA damage at a distance of 5 pixels (pCF(5)). (J) The average time delay for Ku-EGFP interaction with a mitotic chromosome before and after DNA damage (representative data shown in panel I). To see this figure in color, go online.
If we consider the intensity profile of DNA (blue line) and Ku-EGFP (green line) along the line scanned before and after DNA damage (Fig. 4 C), we see that initially Ku-EGFP is excluded from the intact chromatin, and microirradiation causes this localization to dramatically change to an accumulation of Ku-EGFP on the damaged chromatin. Pair correlation analysis of Ku-EGFP molecular flow before and after DNA damage provides explanation for this highly specific change in localization (Fig. 4 D). That is, before DNA damage, we find Ku-EGFP to undergo disconnected molecular flow inside (τ = 0.8 ± 0.4 ms) or outside (τ = 0.6 ± 0.4 ms) the area of the high-density chromatin, but not in between these two environments (N = 4 cells); this is the same mode of regulation that governed free EGFP molecular flow in the G1 interphase nucleus before damage (Fig. 2 C). Then, upon induction of DNA damage, we find Ku-EGFP molecular flow to be dramatically slowed down on two discrete timescales (τ = 8 ± 3 ms and τ = 100 ± 24 ms) in those pixel positions that measure flow onto and inside the chromatin (Fig. 4 E, N = 4 cells), a mode of regulation that is highly distinct from what was observed for free EGFP. It seems that upon activation, Ku-EGFP deviates from passive diffusion and is recruited to the damage site by a mechanism that induces two modes of Ku interaction that temporally suggest nonspecific and specific binding.
If we then perform the same experiment on Ku-EGFP in a mitotic nucleus (Fig. 4 F), we find, similarly to the localization observed in the G1 interphase nucleus, that before DNA damage the Ku-EGFP is dispersed throughout the cell. As can be seen in Fig. 4 G, immediately after microirradiation of the selected line in Fig. 4 F, an accumulation of Ku-EGFP is induced within those pixels along the damage site that traverses the mitotic chromosome. However, the accumulation is far less significant than what was observed in G1 interphase. If we compare the vertical profile of this accumulation before and after DNA damage (Fig. 4 G), we see that Ku-EGFP recruitment is spatially restricted to the damage site on the mitotic chromosome but not as specifically as was observed in G1. If we consider the intensity profile of DNA (blue line) and Ku-EGFP (green line) along the line scanned before and after DNA damage (Fig. 4 H), we see in agreement with G1 interphase chromatin that, initially, Ku-EGFP is excluded from the intact chromosome and microirradiation causes this localization to dramatically change to an accumulation of Ku-EGFP on the damaged chromosome. Pair correlation analysis of Ku-EGFP molecular flow before and after DNA damage (Fig. 4 I) reveals analogously to the G1 interphase experiment that Ku-EGFP before DNA damage is governed by the same mode of regulation that governs free EGFP molecular flow with respect to mitotic chromosomes, resulting in delayed access in and out of this high-density environment on a timescale of τ =3 ± 2.3 ms (Fig. 4 J, N = 3 cells). Upon induction of DNA damage, we find Ku-EGFP molecular flow to be dramatically slowed down on a single timescale τ = 8 ms ± 4.6 ms in those pixel positions that measure flow onto and inside the chromosome. Thus, as was observed in G1 interphase, upon activation Ku-EGFP deviates from passive diffusion and is recruited to the damage site on the chromosome. In both interphase and mitosis, Ku-EGFP interaction with chromatin is not found to be direction-dependent, as revealed by pair correlation analysis in the reverse direction (see Fig. S5).
Discussion
Here we establish a method to monitor the structural rearrangements chromatin undergoes during the DNA damage response. By pair correlation analysis of EGFP molecular flow with respect to chromatin before and after induction of DNA damage, this method detects changes in accessibility to condensed chromatin. By comparing two molecules with and without affinity to DNA double-strand breaks (Ku-EGFP and EGFP), we monitored, to our knowledge for the first time, the real-time molecular flow at damage sites and nearby undamaged sites in different cell-cycle stage of human cells. We find from analysis of free EGFP molecular flow that post-DNA damage chromatin becomes more accessible at the damage site, and in the case of interphase chromatin, more compact in adjacent regions.
From analysis of Ku-EGFP molecular flow, we find that these detected changes in chromatin compaction are likely critical for DNA repair factor recruitment to the naked DNA template with high spatial specificity, and could explain why histone modifications and factors associated with open chromatin and heterochromatin were both detected in the vicinity of the damage sites (10,28–30). However, the structural rearrangements responsible for increased access at the DNA damage site are transient, and chromatin compaction is reinstated by a cell-cycle-dependent mechanism. Interestingly, chromatin rearrangements in response to damage are much more localized and transient in mitosis as compared to G1. This result is consistent with the attenuated DNA damage response and repair in mitosis (31,32). That is, the inability of the mitotic chromosome to maintain an open state of chromatin may reflect the truncation of damage signaling against mitotic DNA damage.
Comparison of different cell-cycle stages before damage induction revealed in agreement with previous studies that there are distinct EGFP movements in and out of chromatin in interphase and mitosis, reflecting the differences in chromatin organization states. The distinct modes of regulation that govern free EGFP diffusion also govern the molecular flow of EGFP-Ku. It is only upon induction of DNA damage, and therefore activation of Ku’s role in the DNA damage response, that deviation from the detected free EGFP molecular flow pattern is observed. In both cell-cycle stages tested we find DNA damage to cause an accumulation of Ku-EGFP at the damage site (in agreement with the detected decrease in chromatin compaction). However, in G1 phase, the accumulation is much higher and more spatially controlled.
The higher accumulation of Ku-EGFP to a G1 phase damage site is a consequence of this protein’s affinity for chromatin at this cell-cycle stage. That is, we observe a molecular flow pattern that is an order-of-magnitude slower through G1 interphase chromatin than what is observed in mitosis and this cannot be explained based on the compaction status revealed by EGFP molecular flow. However, the increased spatial control of Ku-EGFP at a damage site on G1 interphase chromatin as compared to a mitotic chromosome we propose is facilitated by the tightening of adjacent chromatin regions to the damage site that was detected by analysis of free EGFP and not a specific dynamic of the protein, thus demonstrating the importance of understanding protein dynamics and how their dynamics are indirectly modulated by intracellular structure. Taken together, our believed-novel strategy provides a valuable tool to effectively identify the cell-cycle-specific changes of the molecular flow in and out of chromatin of different densities in response to DNA damage.
Acknowledgments
We thank Milka Stakic for cultivating and transfecting the cells, and Dr. Francesco Cardarelli for useful discussions.
This work is supported in part by grant No. NIH-P41 P41-GM103540 (to E.G. and E.H.), grant No. NIH P50-GM076516 (to E.G., E.H. and X.K.), and Cell Migration Consortium grant No. U54 GM064346 (to E.G.).
Contributor Information
Elizabeth Hinde, Email: e.hinde@unsw.edu.au.
Kyoko Yokomori, Email: kyokomor@uci.edu.
Supporting Material
References
- 1.Lindahl T. Instability and decay of the primary structure of DNA. Nature. 1993;362:709–715. doi: 10.1038/362709a0. [DOI] [PubMed] [Google Scholar]
- 2.Jackson S.P., Bartek J. The DNA-damage response in human biology and disease. Nature. 2009;461:1071–1078. doi: 10.1038/nature08467. [DOI] [PMC free article] [PubMed] [Google Scholar]
- 3.Ciccia A., Elledge S.J. The DNA damage response: making it safe to play with knives. Mol. Cell. 2010;40:179–204. doi: 10.1016/j.molcel.2010.09.019. [DOI] [PMC free article] [PubMed] [Google Scholar]
- 4.Karanam K., Loewer A., Lahav G. Dynamics of the DNA damage response: insights from live-cell imaging. Brief Funct. Genomics. 2013;12:109–117. doi: 10.1093/bfgp/els059. [DOI] [PMC free article] [PubMed] [Google Scholar]
- 5.Polo S.E., Jackson S.P. Dynamics of DNA damage response proteins at DNA breaks: a focus on protein modifications. Genes Dev. 2011;25:409–433. doi: 10.1101/gad.2021311. [DOI] [PMC free article] [PubMed] [Google Scholar]
- 6.Campos E.I., Reinberg D. Histones: annotating chromatin. Annu. Rev. Genet. 2009;43:559–599. doi: 10.1146/annurev.genet.032608.103928. [DOI] [PubMed] [Google Scholar]
- 7.Cann K.L., Dellaire G. Heterochromatin and the DNA damage response: the need to relax. Biochem. Cell Biol. 2011;89:45–60. doi: 10.1139/O10-113. [DOI] [PubMed] [Google Scholar]
- 8.Kruhlak M.J., Celeste A., Nussenzweig A. Changes in chromatin structure and mobility in living cells at sites of DNA double-strand breaks. J. Cell Biol. 2006;172:823–834. doi: 10.1083/jcb.200510015. [DOI] [PMC free article] [PubMed] [Google Scholar]
- 9.Goodarzi A.A., Noon A.T., Jeggo P.A. ATM signaling facilitates repair of DNA double-strand breaks associated with heterochromatin. Mol. Cell. 2008;31:167–177. doi: 10.1016/j.molcel.2008.05.017. [DOI] [PubMed] [Google Scholar]
- 10.Ball A.R., Jr., Yokomori K. Damage site chromatin: open or closed? Curr. Opin. Cell Biol. 2011;23:277–283. doi: 10.1016/j.ceb.2011.03.012. [DOI] [PMC free article] [PubMed] [Google Scholar]
- 11.Hamilton C., Hayward R.L., Gilbert N. Global chromatin fiber compaction in response to DNA damage. Biochem. Biophys. Res. Commun. 2011;414:820–825. doi: 10.1016/j.bbrc.2011.10.021. [DOI] [PMC free article] [PubMed] [Google Scholar]
- 12.Zhang R., Liu S.T., Adams P.D. HP1 proteins are essential for a dynamic nuclear response that rescues the function of perturbed heterochromatin in primary human cells. Mol. Cell. Biol. 2007;27:949–962. doi: 10.1128/MCB.01639-06. [DOI] [PMC free article] [PubMed] [Google Scholar]
- 13.Essers J., Houtsmuller A.B., Kanaar R. Nuclear dynamics of RAD52 group homologous recombination proteins in response to DNA damage. EMBO J. 2002;21:2030–2037. doi: 10.1093/emboj/21.8.2030. [DOI] [PMC free article] [PubMed] [Google Scholar]
- 14.Lukas C., Falck J., Lukas J. Distinct spatiotemporal dynamics of mammalian checkpoint regulators induced by DNA damage. Nat. Cell Biol. 2003;5:255–260. doi: 10.1038/ncb945. [DOI] [PubMed] [Google Scholar]
- 15.Bekker-Jensen S., Lukas C., Lukas J. Dynamic assembly and sustained retention of 53BP1 at the sites of DNA damage are controlled by Mdc1/NFBD1. J. Cell Biol. 2005;170:201–211. doi: 10.1083/jcb.200503043. [DOI] [PMC free article] [PubMed] [Google Scholar]
- 16.Wachsmuth M., Caudron-Herger M., Rippe K. Genome organization: balancing stability and plasticity. Biochim. Biophys. Acta. 2008;1783:2061–2079. doi: 10.1016/j.bbamcr.2008.07.022. [DOI] [PubMed] [Google Scholar]
- 17.Girst S., Hable V., Dollinger G. Subdiffusion supports joining of correct ends during repair of DNA double-strand breaks. Sci. Rep. 2013;3:2511. doi: 10.1038/srep02511. [DOI] [PMC free article] [PubMed] [Google Scholar]
- 18.Jeyasekharan A.D., Ayoub N., Venkitaraman A.R. DNA damage regulates the mobility of Brca2 within the nucleoplasm of living cells. Proc. Natl. Acad. Sci. USA. 2010;107:21937–21942. doi: 10.1073/pnas.1009577107. [DOI] [PMC free article] [PubMed] [Google Scholar]
- 19.Merkle D., Zheng D., Schwille P. Cellular dynamics of Ku: characterization and purification of Ku-eGFP. ChemBioChem. 2008;9:1251–1259. doi: 10.1002/cbic.200700750. [DOI] [PubMed] [Google Scholar]
- 20.Erdel F., Müller-Ott K., Rippe K. Dissecting chromatin interactions in living cells from protein mobility maps. Chromosome Res. 2011;19:99–115. doi: 10.1007/s10577-010-9155-6. [DOI] [PubMed] [Google Scholar]
- 21.Hinde E., Cardarelli F., Gratton E. In vivo pair correlation analysis of EGFP intranuclear diffusion reveals DNA-dependent molecular flow. Proc. Natl. Acad. Sci. USA. 2010;107:16560–16565. doi: 10.1073/pnas.1006731107. [DOI] [PMC free article] [PubMed] [Google Scholar]
- 22.Digman M.A., Gratton E. Imaging barriers to diffusion by pair correlation functions. Biophys. J. 2009;97:665–673. doi: 10.1016/j.bpj.2009.04.048. [DOI] [PMC free article] [PubMed] [Google Scholar]
- 23.Hinde E., Cardarelli F., Gratton E. Changes in chromatin compaction during the cell cycle revealed by micrometer-scale measurement of molecular flow in the nucleus. Biophys. J. 2012;102:691–697. doi: 10.1016/j.bpj.2011.11.4026. [DOI] [PMC free article] [PubMed] [Google Scholar]
- 24.Hinde E., Cardarelli F., Gratton E. The impact of mitotic versus interphase chromatin architecture on the molecular flow of EGFP by pair correlation analysis. Biophys. J. 2011;100:1829–1836. doi: 10.1016/j.bpj.2011.02.024. [DOI] [PMC free article] [PubMed] [Google Scholar]
- 25.Kong X., Stephens J., Yokomori K. Condensin I recruitment to base damage-enriched DNA lesions is modulated by PARP1. PLoS ONE. 2011;6:e23548. doi: 10.1371/journal.pone.0023548. [DOI] [PMC free article] [PubMed] [Google Scholar]
- 26.Gregson H.C., Schmiesing J.A., Yokomori K. A potential role for human cohesin in mitotic spindle aster assembly. J. Biol. Chem. 2001;276:47575–47582. doi: 10.1074/jbc.M103364200. [DOI] [PubMed] [Google Scholar]
- 27.Cardarelli F., Gratton E. In vivo imaging of single-molecule translocation through nuclear pore complexes by pair correlation functions. PLoS ONE. 2010;5:e10475. doi: 10.1371/journal.pone.0010475. [DOI] [PMC free article] [PubMed] [Google Scholar]
- 28.Timinszky G., Till S., Ladurner A.G. A macrodomain-containing histone rearranges chromatin upon sensing PARP1 activation. Nat. Struct. Mol. Biol. 2009;16:923–929. doi: 10.1038/nsmb.1664. [DOI] [PubMed] [Google Scholar]
- 29.Murr R., Loizou J.I., Herceg Z. Histone acetylation by Trrap-Tip60 modulates loading of repair proteins and repair of DNA double-strand breaks. Nat. Cell Biol. 2006;8:91–99. doi: 10.1038/ncb1343. [DOI] [PubMed] [Google Scholar]
- 30.Chou D.M., Adamson B., Elledge S.J. A chromatin localization screen reveals poly (ADP ribose)-regulated recruitment of the repressive polycomb and NuRD complexes to sites of DNA damage. Proc. Natl. Acad. Sci. USA. 2010;107:18475–18480. doi: 10.1073/pnas.1012946107. [DOI] [PMC free article] [PubMed] [Google Scholar]
- 31.Giunta S., Belotserkovskaya R., Jackson S.P. DNA damage signaling in response to double-strand breaks during mitosis. J. Cell Biol. 2010;190:197–207. doi: 10.1083/jcb.200911156. [DOI] [PMC free article] [PubMed] [Google Scholar]
- 32.Orthwein A., Fradet-Turcotte A., Durocher D. Mitosis inhibits DNA double-strand break repair to guard against telomere fusions. Science. 2014;344:189–193. doi: 10.1126/science.1248024. [DOI] [PubMed] [Google Scholar]
Associated Data
This section collects any data citations, data availability statements, or supplementary materials included in this article.