

Abstract
The role of protein-bound water molecules in protein function and catalysis is an emerging topic. Here, we studied the solvation of an excess proton by protein-bound water molecules and the contribution of the surrounding amino acid residues at the proton release site of the membrane protein bacteriorhodopsin. It hosts an excess proton within a protein-bound water cluster, which is hydrogen bonded to several surrounding amino acids. Indicative of delocalization is a broad continuum absorbance experimentally observed by time-resolved Fourier transform infrared spectroscopy. In combination with site-directed mutagenesis, the involvement of several amino acids (especially Glu-194 and Glu-204) in the delocalization was elaborated. Details regarding the contributions of the glutamates and water molecules to the delocalization mode in biomolecular simulations are controversial. We carried out quantum mechanics/molecular mechanics (QM/MM) self-consistent charge density functional tight-binding simulations for all amino acids that have been experimentally shown to be involved in solvation of the excess proton, and systematically investigated the influence of the quantum box size. We compared calculated theoretical infrared spectra with experimental ones as a measure for the correct description of excess proton delocalization. A continuum absorbance can only be observed for small quantum boxes containing few amino acids and/or water molecules. Larger quantum boxes, including all experimentally shown involved amino acids, resulted in narrow absorbance bands, indicating protonation of a single binding site in contradiction to experimental results. We conclude that small quantum boxes seem to reproduce representative extreme cases of proton delocalization modes: proton delocalization only on water molecules or only between Glu-194 and Glu-204. Extending the experimental spectral region to lower wave numbers, a water-delocalized proton reproduces the observed continuum absorbance better than a glutamate-shared delocalized proton. However, a full agreement between QM simulations and experimental results on the delocalized excess proton will require a larger quantum box as well as more sophisticated QM/MM methods.
Introduction
Vectorial proton transfer by membrane proteins is essential to sustain living cells. A detailed understanding of how protons are transferred by membrane proteins is a long-standing goal. Proton transfer in such biological systems usually takes place along protonable amino acid residues. Recent studies showed that protein-bound water molecules also take an active part in this transfer (1,2). Controlled proton transfer via water molecules spanning a transient Grotthus chain (3,4) in an intermediate protein state was also revealed in detail (5). These studies also showed the role of protein-bound water molecules using the light-driven proton pump bacteriorhodopsin (bR), which is a member of the heptahelical membrane protein family of microbial rhodopsins (6,7). Like all microbial rhodopsins, bR contains a retinal chromophore, which undergoes an all-trans/13-cis isomerization upon light activation. The isomerization drives bR through a cycle of well-defined intermediates, resulting in one net proton transfer per photocycle through the protein. At the proton release site, a delocalized excess proton was experimentally identified in a membrane protein for the first time (1,2,8–10) by its characteristic broad, so-called continuum absorbance (11,12) (hereafter referred to as the continuum band). The excess proton is delocalized on protein-bound water molecules and on the hydrogen-bonded amino acid residues Tyr-57, Arg-82, Tyr-83, Ser-193, Glu-194, and Glu-204 (1,9). This conclusion was drawn from site-directed mutation experiments involving these surrounding amino acids. Such mutations affect the continuum band and thus indicate the involvement of these residues in proton solvation (2,9). We want to point out that in this article, we use the term “delocalization” in the sense of fast-changing, multiple proton-binding sites exchanging protons in a Grotthus transfer mechanism. Thus, it is not a single physical excess proton but the information of an excess proton that is delocalized over the full release site. The model of a protonated water cluster at the proton release site was experimentally confirmed by other research groups (11,13,14). However, to understand the molecular details of this delocalization, we performed ab initio quantum mechanics/molecular mechanics (QM/MM) simulations.
There is a consensus among both experimental and theoretical studies that the proton is delocalized at the release site (2,9,10,15–18), but regarding the molecular details of the delocalization in the protein ground state, two controversial models have been proposed. Car-Parrinello QM/MM simulations with the excess proton exclusively delocalized on the water molecules in the investigated QM box (15,19) reproduced the experimentally observed infrared (IR) continuum band. Further QM/MM simulations using the self-consistent charge density functional tight-binding (SCC-DFTB) method (20,21), which included the Glu-194 and Glu-204 side chains together with the water molecules in the QM box, were also able to reproduce the continuum band (16,17). In this case, the excess proton became exclusively delocalized between the two negatively charged Glu-194 and Glu-204 side chains. However, the simulations carried out so far have not included all residues known from the experiments to participate in proton solvation. pKa calculations on the release site are controversial as well, favoring a delocalized proton on the water molecules (18) or between the glutamates (17) depending on the algorithm used. The small QM boxes suffer from an artificial symmetry of included chemical functionalities: treating only the water molecules by QM will allow the proton to only delocalize on them, which inevitably will lead to a Zundel and/or an Eigen cation (3,4). Including only the two negatively charged glutamates together with the water molecules in the QM box provides a deep, symmetric potential minimum between the glutamates and traps the proton within.
Here, to gain a better understanding of the proton distribution over multiple binding sites, we extended the former SCC-DFTB simulations by including all residues that have been experimentally identified to contribute to the fine-tuning of proton solvation into the QM box. This will especially disturb the aforementioned artificial system symmetry within the respective QM boxes. To assess the correctness of the described proton delocalization distributions, we analyzed the agreement between experimental and theoretically calculated continuum bands. In agreement with earlier simulations (15–17,19), we observed a continuum band for both a proton delocalized on the protein-bound water molecules (in the so-called protonated water cluster QM box) and a proton symmetrically delocalized between Glu-194 and Glu-204 (in the so-called Glu-shared proton QM box and the small QM box). However, when we included further amino acids in a stepwise manner, yielding QM boxes of increasing size and asymmetry, narrow artificial absorbance bands appeared in the calculated IR spectra, and the continuum band finally disappeared when all residues of interest were included.
These results are in contradiction to the experimentally observed continuum absorbance. Consequently, the current SCC-DFTB calculations are only in agreement with experimental data for the small QM boxes. Therefore, instead of focusing on increasing the quantum box size, we extended the experimentally accessible frequency range of the continuum band down to 1700 cm−1 and compared the resulting spectral line shapes with the ones calculated from small QM boxes. Here, the extended continuum band agrees better with the one calculated for a water-delocalized proton than with the one calculated for a glutamate-delocalized proton. Furthermore, the involvement of water in proton delocalization is experimentally supported, as the continuum band is shifted by H218O labeling (13). This shift is not expected for a proton that is exclusively delocalized between Glu-194/Glu-204. In agreement with our earlier proposal (2,9,10), we conclude that the proton is delocalized on both the protein-bound water molecules and all surrounding amino acids, including Glu-194 and Glu-204, in the ground state. This includes a transiently shared proton between Glu-194 and Glu-204, but not exclusively.
In addition, we simulated the E194D and E204D mutations at the release site in small QM boxes. In these mutants, the structure at the release site is slightly changed, becomes asymmetric, and results in the experimentally observed protonation of Glu-204 and Asp-204, respectively (9,10), as also observed for the large asymmetric QM box in wild-type (WT) protein simulations. QM/MM simulations of these mutants with glutamates/aspartates together with water molecules only in the QM box, containing a mutation-induced asymmetry, were able to reproduce the experimentally observed IR signatures for localized binding sites and predict a protonation of Glu-204, respectively, which indeed was found experimentally in the E194D mutant (9).
Therefore, it seems that SCC-DFTB QM/MM simulations adequately describe localized binding sites. Furthermore, these results show that the degree of chemical symmetry within the quantum box plays an important role in excess proton delocalization. The introduction of a small asymmetry at the release site shifts the delocalized proton to a localized binding site and protonates a glutamic acid. Actually, in the bR photocycle, upon proton release to the external medium, the delocalized proton becomes transiently localized in the M intermediate, and Glu-194 or Glu-204 becomes protonated before the proton is released to the external medium (10). This protonation is important for the gate opening at Ser-193 in the proton diode mechanism (10). We therefore distinguish between a proton release site in the ground state with a delocalized proton, and a transient proton exit site with a localized proton in the M intermediate at Glu-194/204.
Materials and Methods
A detailed description of our structure preparation, QM/MM calculation, IR spectra calculation, and PMF calculation procedures can be found in the Supporting Material. In short, all calculations were performed with Chemistry at HARvard Molecular Mechanics (CHARMM) (22) and used the simulation and IR spectra calculation protocol of Phatak et al. (16) and the potential of mean force (PMF) calculation protocol of Goyal et al. (17). WT bR simulations were based on a membrane equilibrated structure from our earlier simulations with a protonated water cluster model at the release site (10) or the 1.55 Å ground-state bR structure of Luecke et al. (23). E194D and E204D mutant simulations were based on the respective crystal structures (Protein Data Bank (PDB) IDs 2WJK and 2WJL) (10). All simulations were calculated for a trajectory length of 1.1 ns. For calculations on the influence of different QM box sizes on IR spectra, three independent sample runs were carried out and their spectra were averaged. For the calculation of glutamate mutations, only one simulation each was carried out. To facilitate spectral comparisons and enhance the signal/noise ratio, we smoothed all spectra by calculating their running averages with a window size of 16 cm−1. Analysis of oxygen-hydrogen distances in QM boxes with glutamate-bound protons was carried out according to the following criteria: distances between 0.9 Å and 1.1 Å were considered as covalent bonds, distances between 1.1 Å and 1.5 Å were considered as glutamate-delocalized (shared) proton (16), and distances between 1.5 Å and 2.5 Å were considered as hydrogen bonds. All molecular figures were prepared with PyMOL (Schrödinger, LLC).
Results and Discussion
We first investigated the impact of the QM box size on proton position and the corresponding changes of the continuum band. We increased the size of the QM box at the release site in a stepwise manner and compared the corresponding IR spectra with experimental ones. Point mutation experiments showed that the delocalized proton is solvated by Tyr-57, Arg-82, Tyr-83, Ser-193, Glu-194, and Glu-204 side chains (2,9). Also the backbones of Tyr-79 and Thr-205 contribute significantly to the solvation (9). Our initial assumption was that an increase in QM box size by subsequent addition of more amino acid side chains should lead to a better description of the release-site structure, dynamics, and bond networks, which should further result in calculated IR spectra agreeing better with experimental ones. To enhance the spectral comparison by reducing the noise level in our calculated spectra, we calculated their running averages (see Materials and Methods section). Fig. 1 B shows the resulting theoretical IR spectra of the different QM boxes in the continuum band range in comparison with the experimental continuum band. Due to the overlap with the absorbance of protonated Asp-85 at 1762 cm−1 (26), the experimental continuum band can only be directly compared with theoretical spectra at wavenumbers higher than 1780 cm−1. The calculated continuum bands of the protonated water cluster QM box, the QM box with the two Glu-194 and Glu-204 side chains and an excess proton (Glu-shared proton QM box), and the QM box with both glutamates, excess proton, and water molecules (small QM box) agree with the experimental continuum band between 2000 cm−1 and 1800 cm−1. The small QM box, which includes the water molecules and the glutamic acid side chains, exhibits an artificial signature above 2250 cm−1 (see Fig. S1) and small artificial bands at 1863 cm−1 and 1819 cm−1, which do not agree with the experimental results. In all simulations in which the glutamates were included in the QM box, the proton was attracted by the negative charges and moved between the two glutamate carboxylic acid side chains within a few picoseconds. This indicates a very deep potential minimum between the two negatively charged glutamic acid residues. Including more residues in the QM box does not seem to flatten this deep potential minimum enough that the proton is able to escape to multiple binding sites, which is the result obtained in Fourier transform IR (FTIR) experiments on bR mutants (9,10). The intermediate QM box, which includes additional residues, shows strong bands at 1830 cm−1 and 1793 cm−1, which are also not observed in experimental FTIR spectra. A continuum absorption is still observed, pointing to an existing fraction of delocalized proton. The large QM box lacks this continuum band completely, but also exhibits the two prominent artificial bands mentioned above. The disappearance of the continuum band when the QM box size was increased in the simulations seems to indicate an increasing localization of the excess proton on one glutamate.
Figure 1.
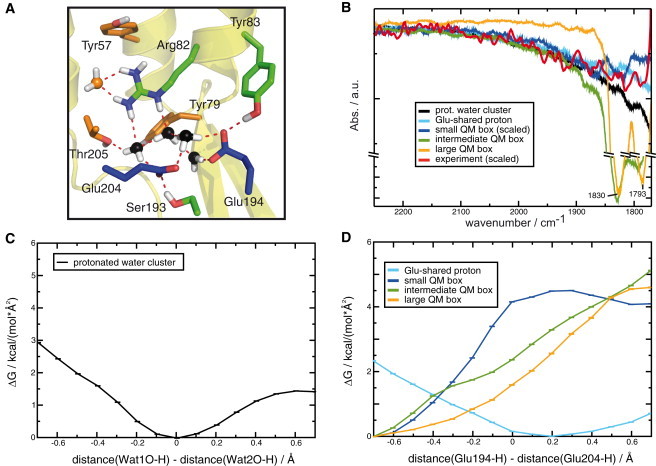
(A) Different sizes of the bR release site QM box: protonated water cluster (black), small QM box residues (blue), intermediate QM box residues (green), and large QM box residues (orange). Each listed QM box includes the residues of the respective smaller box listed before, except the Glu-shared proton QM box, which just includes the two glutamates and an excess proton. (B) Simulated spectra calculated from the different QM boxes in comparison with experimentally obtained spectra (red). The color code is the same as in A. The protonated water cluster QM box, the Glu-shared proton QM box, and the small QM box agree with the experimentally observed continuum band. The intermediate QM box shows two sharp bands with peaks at 1830 cm−1 and 1793 cm−1. These bands are not observed in experimental spectra and seem to be an artifact of the simulation. For the large QM box, the continuum band disappears completely and only the two sharp bands mentioned above remain. This narrowing of the continuum band into two sharp bands seems to indicate localization of the excess proton on one of the two glutamates, as observed experimentally in the ground state of E204D and E194D bR mutants, and in the M intermediate of the WT (10). (C) Free-energy profile of the excess proton between water oxygen atoms as found in PMF calculations (black). Error bars depict the calculated standard deviation (SD). The protonated water cluster shows a clear minimum in the middle between two water molecules, indicating a Zundel ion (12,24,25). (D) Free-energy profile of the excess proton between glutamate oxygen atoms, as found in PMF calculations. Error bars depict the calculated SD. The color code is the same as in A. Values < 0.5 Å indicate a protonation of Glu-194, and values > 0.5 Å indicate a protonation of Glu-204. The glutamate-shared proton QM box shows a similar energy dependence, with the minimum moved slightly toward Glu-204. Both systems therefore should be capable of producing a continuum band. In all systems containing water molecules and glutamates, the energy curves clearly indicate a preference for the protonation of Glu-194.
In summary, both the protonated water cluster and the glutamate-shared proton system agree with the experimentally observed continuum band and indicate a delocalized proton. Contrary to intuition and earlier QM/MM calculation-based IR spectra calculations of water molecules in contact with the retinal Schiff base, Asp-85, and Asp-212, forming the so-called pentamer (27), increasing the QM box size does not improve the calculated spectra. An increase in QM box size does not lead to a delocalization across the whole release site, which was deduced from FTIR measurements in combination with point mutation experiments (9,10). Instead, we observe the disappearance of the continuum band and the appearance of protonation bands of glutamic acids, reflecting a localized proton that contradicts the experimental results for the BR resting state. The glutamate-shared proton QM box and the small QM box show a high level of symmetry with respect to the arrangement of chemical functionalities within the QM boxes themselves. This is an artificial situation in these size-reduced systems because the protein surroundings are asymmetric, and this asymmetry is not transferred via QM interactions but only by charge interactions across the QM/MM border. Increasing the size by including additional amino acid side chains, which form the first layer of residues surrounding and interacting with the two glutamates induces asymmetry and leads to a localization of the proton on Glu-194. This is in contradiction to experimental results. It seems that in SCC-DFTB, the coupling of the QM box and the MM surroundings is not strong enough to perform this transfer of asymmetry in small QM boxes and thus leads to a glutamate-shared proton only. So far, QM/MM investigations have focused mainly on analyzing small QM systems (15–17,19). The newly appearing (to our knowledge) two sharp bands indicate a protonation of one of the glutamate, and were not discussed specifically in previous studies by Goyal et al. (17) with calculations on a large QM box (see above). However, their results also show a narrowing of the continuum band. We think that Goyal et al. actually computed the same collapse of the continuum band as we did for a larger QM box, and yielded a similar pattern of fast-exchanging fully protonated glutamates (see Supplemental Data Analysis, section 1, for details). However, they might have overlooked this because it is only observable if the large noise level appearing in the computed IR spectra is reduced—a problem we were able to overcome by using the line-smoothing method presented here.
To elucidate the reason for the observed proton localization in larger QM boxes in detail, we plotted the glutamate oxygen to excess proton distances and the minimal glutamate oxygen/oxygen distances observed during the simulations, and calculated the respective free-energy profile of the proton on water molecules and between the glutamates in the different QM box sizes as a PMF. A comparison of calculated glutamate-glutamate distances with high-resolution bR crystal structures (see Supplemental Data Analysis, section 2, and Fig. S3) indicates a mixture between the protonated water cluster and glutamate-shared proton. Concerning the PMF, the protonated water cluster shows a clear and broad minimum in the middle between two water molecules (Fig. 1 C), indicating a Zundel ion (4,12,25). The Glu-shared proton QM box (Fig. 1 D) shows a similar energy curve, with the minimum being moved slightly toward Glu-204. The observed broad symmetric energy minimum is a prerequisite for the appearance of a continuum band (25). For the QM boxes containing Glu-194/204, the PMF analysis confirms our assumption that small QM boxes are artificially symmetric: in all systems with more amino acid side chains in the QM box (intermediate and large QM boxes), which lead to an increasing asymmetry in chemical composition and reactivity, the energy curves clearly indicate a preference for a localized proton by protonation of Glu-194, with an energy difference of ∼5 kcal/mol over the protonation of Glu-204. Such a protonation explains the collapse of the continuum band into two sharp bands: they can be interpreted as strongly red-shifted O-H stretch vibrations within the glutamate pair. To elucidate the possible reason for the strong effect of the QM box size, we carried out further PMF calculations on the Ser-193/Glu-204 proton release gate (10,17,28), and performed mechanical-embedding calculations to assess the influence of MM charges on the QM environment (see Supplemental Data Analysis, section 3, and Figs. S4 and S5). This gate is located at the border of the different QM boxes. We found a strong dependence of the respective Ser-193/Glu-204 gate PMFs on the QM box size. The mechanical-embedding simulations showed that the interaction with the MM surroundings is strong enough in the small QM box to keep the two glutamates in a position to form a hydrogen bond and a shared proton to a certain extent. However, this interaction is not strong enough to introduce the asymmetry in proton distribution seen for the larger QM boxes. To summarize, we can now confirm our assumption from PMF calculations that the QM/MM border interaction in the current SCC-DFTB setup is not sufficient to correctly reproduce QM interactions and thus strongly affects side-chain orientations and oxygen–oxygen distances between proton donors, and hence the proton distribution within the QM box. Because proton transfer barriers increase by several kcal/mol per 0.1 Å distance between transferring oxygen atoms (29,30), even small geometrical changes at the release site could lead to the observed proton localization.
A major point raised by Goyal et al. (17) in support of a glutamate-shared proton and against a protonated water cluster is their observation that in SCC-DFTB QM/MM calculations, the protonated water cluster is intrinsically ∼20 kcal/mol higher in free enthalpy than the glutamate-shared proton, which we observe as well. However, in their QM/MM setup, which we used as well, only amino acid side chains are placed into the QM box, and the protein backbone is not treated by QM. Both amino acid side chains and water molecules at the release site exhibit important hydrogen bonds with the protein backbone at several sites, which are the carbonyl groups of Tyr-79 and Thr-205 (9), and the amido group hydrogen atoms of Ser-193 and Glu-194 (17). Including only the Ser-193/Glu-194 backbone contacts in MP2 calculations on vacuum models of the release site already lowered the proton affinity difference between protonated water cluster and glutamate-shared proton considerably from 15.1 kcal/mol to only 7.7 kcal/mol (see Table 1 in Goyal et al. (17)). This is close to the average error range (2–4 kcal/mol) of comparable QM/MM methods and well below their maximal error range (14 kcal/mol) (see Electrostatic Embedding methods in Hu et al. (31)), so the QM/MM calculations might actually result in a wrong description of the release-site excess proton distribution. The Tyr-79 and Thr-205 backbones were elaborated experimentally as important hydrogen bonding partners of the protonated water cluster (9). Therefore, a full QM treatment of the release site, especially together with all backbone groups involved in hydrogen bonds, surrounded by a full layer of QM residues, would be necessary to correctly describe the underlying proton distribution. The neglected backbone interactions seem to shift the excess proton toward the two glutamates. However, including the backbone in QM boxes together with the necessary additional layer of QM residues around the release site was beyond the range of this study and will be analyzed in further work.
To analyze whether the localization effects of a size-increased QM box depend on the starting structure (see Supplemental Data Analysis, section 4), i.e., whether using our simulation-based structure and dynamics input yields different results than using a crystal structure and the respective B factors, we performed additional calculations with the ground-state crystal structure 1C3W (23) using the structure preparation steps described by Goyal et al. (17), and analyzed the proton distributions and continuum bands that appeared. The resulting distance plots and IR spectra are displayed in Fig. S6. Comparing these results with those shown in Figs. 1 and S3, we observe the same pattern of proton localization: whereas the Glu-shared proton QM box clearly shows glutamate–excess-proton distances indicative of a shared proton, such distances are seldom present in the larger QM boxes. Furthermore, the glutamate–glutamate distances found in the protonated water cluster box fit better to the ones observed in high-resolution crystal structures than all other QM boxes, as observed in our simulations with a membrane/solvent-equilibrated structure (see Fig. 1). Finally, the calculated IR spectra of both intermediate and large QM boxes show the same narrowing of the continuum band into two single peaks as in our membrane/solvent-equilibrated system. We have to state that in simulations of 1C3W, the three water molecules in the protonated water cluster QM box (which is the number observed in the crystal structure) do not produce a continuum band; therefore, more than three water molecules must be present at the release site in bR. In conclusion, since we observe similar localization effects and IR spectra artifacts in both simulation- and crystal-structure-based simulations, it appears that the localization effect does not depend on the starting structure used, the preparation of the structure, or the amount of water molecules at the release site, and instead is a feature of the SCC-DFTB itself.
In summary, our results show that only the two minimal QM box sizes (protonated water cluster and Glu-shared proton) reproduce the experimentally observed continuum absorbance, and the larger QM boxes do not. As soon as water molecules and both glutamates are included in the QM box, the continuum band starts to disappear and the excess proton becomes localized by a protonation of a single glutamate. This trend continues as additional amino acids are included, increasing the chemical asymmetry in the QM box: Glu-194 becomes fully protonated and the continuum band vanishes. The reason for this effect seems to be an insufficient interaction of the Glu-shared proton QM box and the small QM box systems with their MM surroundings, and a missing QM treatment of hydrogen bonds with the protein backbone. As a result, it seems that with increasing QM box size, the chemical potentials, especially the proton affinities, at the release site become more and more imbalanced. We can definitively exclude the theoretically observed protonation of a single glutamate at the release site in the ground state, or even a partial protonation, based on the experimental results (2,9,10,28). We need to point out that the zero-point vibration energy for the bands observed in the larger QM systems at ∼1800 cm−1 is 2.16 kcal/mol (32,33). This might allow the proton on Glu-194 to sample a broader range of distances between the glutamates; therefore, for a correct calculation of IR spectra of the release site, core quantum effects need to be included. However, we have to stress that as the main result, the currently applied SCC-DFTB calculation method with QM boxes including amino acid side chains, but not backbone atoms, results in calculated IR spectra that are not in agreement with experimental ones. We therefore cannot discriminate between the presence of a protonated water cluster and a glutamate-shared proton based on the data given so far.
Because we cannot distinguish between a protonated water cluster and a proton shared by the two glutamates based solely on the calculated continuum band in the spectral window above 1800 cm−1, we extended the observable spectral range of the continuum band down to 1700 cm−1. Experimentally, this is difficult because the continuum band overlaps with bands of the carbonyl vibrations of Asp-85 at 1762 cm−1, Asp-96 at 1742 cm−1, and Asp-115 at 1738 cm−1 (2,9,10,13,14). As the continuum band region between 2300 cm−1 and 1800 cm−1 follows the shape of an exponential function, we can fit the continuum band in this spectral region by such an exponential function, as shown in Figs. 2 B and S7. With the help of this function, we can extrapolate the form of the continuum band to 1700 cm−1 as well (see Figs. 2 B and S7 for details). Because of the problems described above, we cannot use large QM boxes for the molecular analysis of experimentally observed spectral features. We therefore need to define smaller QM boxes, which serve as representatives for possible proton distribution modes at the release site, and can be used for such an analysis. Even though we find problems with the proton distribution energetics, SCC-DFTB calculations provide correct spectral information about the investigated QM systems (34). Since only the protonated water cluster QM box, the glutamate-shared proton QM box, and the small QM box exhibited a continuum band, we use them as such representatives. Given the observed QM/MM border problems, we do not aim to give an exact description of excess proton distribution at the full release site; rather, we view the different QM boxes as representatives of the above-discussed extreme cases of delocalization distributions: an exclusive water delocalization and an exclusive glutamate-based delocalization. We define the first two above-mentioned QM boxes as minimal QM boxes, and use the small QM box as an extension of these minimal boxes. Fig. 2, B and C, show the resulting calculated continuum bands for the two minimal model QM boxes and the small QM box. The continuum band of the protonated water cluster forms a continuous slope downward from large to small wave numbers until a minimum is reached at 1650 cm−1. The Glu-shared proton exhibits a minimum at ∼1775 cm−1. The small QM box results in a spectral line shape comparable to that of the Glu-shared proton, but it does not exhibit a clear minimum due to an overlap with a band at ∼1620 cm−1 (see Fig. S1), most likely resulting from water-bending vibrations. The fit of the continuum band exhibits a slope from large to small wave numbers, which is in good agreement with the overall line shape of the protonated water cluster signature, but disagrees with the results from the Glu-shared proton QM box and the small QM box. A comparison of experimental and theoretical data on the continuum-band line shape in the extended spectral region favors a protonated water cluster.
Figure 2.
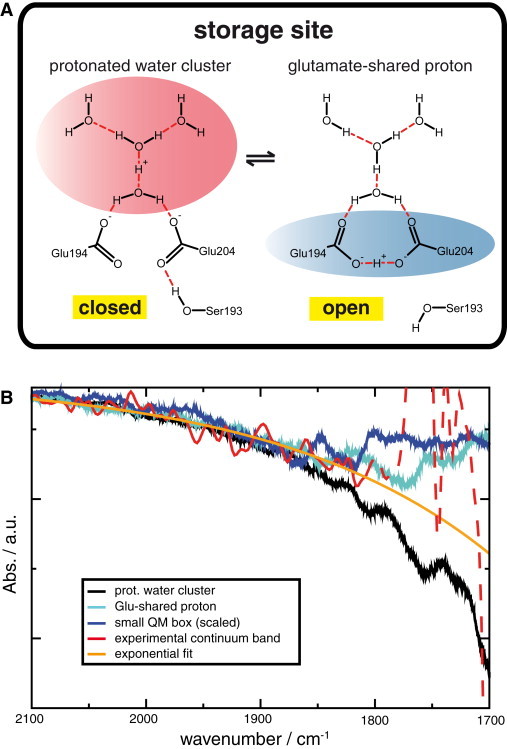
Analysis of the contribution of different delocalization modes to delocalization at the bR release site. (A) Schematics of the two minimal model QM systems resulting in a calculated continuum band: glutamate-shared proton and protonated water cluster. (B) Exponential fit of the continuum band between 2300 cm−1 and 1800 cm−1 (orange) in comparison with the calculated spectra for protonated water cluster QM box (black), Glu-shared proton QM box (cyan), and the small QM box (blue). See Fig. S7 for details. Over this spectral range, the continuum band exhibits the form of an exponential function. Below 1800 cm−1, the experimentally observed continuum band (red) overlaps with the carbonyl vibrations of Asp-85, Asp-96, and Asp-115 between 1765 cm−1 and 1715 cm−1. Therefore, the experimental curve is upshifted as compared with the fit. Between 1715 cm−1 and 1705 cm−1, where no other bands are observed, the fitted curve again matches the experimental curve. The overall shape of the exponential fit is in best agreement with the line shape from simulations with a protonated water cluster QM box.
In summary, current experimental and theoretical approaches favor an excess proton being distributed over the full release site, including all amino acids, especially Glu-194 and Glu-204, and protein-bound water molecules at the release site (2,9). To the best of our knowledge, the continuum band of a single symmetrically carboxylate delocalized excess proton, as proposed for Glu-194/204, has only been seen in simulations of artificially small QM systems (16,17), and has never been observed experimentally at all. In contrast, protonated water clusters are well characterized experimentally (11) and nicely reproduce the continuum band observed in bR (2). H218O labeling experiments resulted in an isotopic shift of the continuum band (13). The straightforward explanation for this result is that water molecules, which carry the excess proton, cause the continuum band. A Glu-shared proton only would not cause a downshift of the continuum band by H218O labeling. We learned that proton delocalization is strongly dependent on the electrostatics and electronic interactions at the release site. Due to the observed limits of QM/MM coupling, QM/MM simulations would need to include all amino acids at the release site with both side chains and backbone groups in the QM box for a correct description. Because of these very large QM systems, simulating the delocalization still poses a benchmark problem for QM/MM calculations today. Furthermore, nuclear quantum effects need to be included to correctly account for zero-point energy contributions. We further recommend the use of more sophisticated theoretical methods, as benchmark simulations with both second-order (35) and third-order SCC-DFTB (36) on bulk water with or without excess proton, as well as third-order SCC-DFTB calculations on an excess proton solvated by protein-internal water molecules in a LS2 protein water channel (37) showed that this method exhibits certain inaccuracies in describing hydrogen-bond lengths, hydration-shell structures, and the PMF of the excess proton between water molecules. In particular, Grotthuss transfer rates are underestimated, implying that SCC-DFTB in general tends to prefer localized protons even on water molecules. However, we observed that the proton release to the extracellular medium is induced by protonation of Glu-204 (10). In the following, we will analyze whether SCC-DFTB is able to reproduce these full protonations in bR.
Localized binding of protons at the release site can be observed experimentally in bR in the ground state upon mutation of Glu-194 or Glu-204 to aspartates (9,10). In E204D, the continuum band is decreased and Asp-204 becomes partly protonated. In E194D, the continuum band disappears and Glu-204 is protonated. Due to the combination of an aspartate with a glutamate, these mutants contain a small chemical asymmetry at the release site already in the smaller QM boxes, though the charge distribution remains unchanged. We investigated the extent to which SCC-DFTB QM/MM calculations can correctly predict these experimentally observed protonations in the mutant protein structures (PDB IDs 2WJL and 2WJK) (10). The resulting spectra are shown in Fig. 3. The theoretical spectrum of the E204D mutant has a decreased continuum band, in agreement with experimental results, and shows a weak band at 1727 cm−1, which may originate from a protonated carboxylate. The theoretical spectrum of the E194D mutant lacks the continuum band, which is also in agreement with experiments, and shows a very weak possible glutamate protonation signal at 1733 cm−1. As can be seen in the inset of Fig. 3, both carbonyl signals agree reasonably well with the experimentally observed signals at 1712 and 1709 cm−1 (10). Concerning the experimentally observed continuum band changes, the results from the SCC-DFTB calculations therefore are in line with the experimental results.
Figure 3.
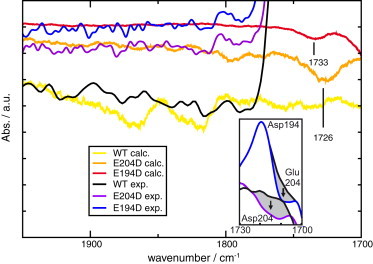
Calculated continuum band and carbonyl band development upon introduction of mutations to Glu-194 and Glu-204 (quantum box: excess proton, water molecules, Glu-194, Glu-204 (small QM box)). Between 2000 and 1800 cm−1, the WT shows a prominent continuum band in both calculations (yellow) and experiment (black), the E204D mutant has a weak continuum band-like shape in calculations (orange) and experiment (purple), and the E194D mutant lacks the continuum band-like feature in calculations (red) and experiment (blue). This is in agreement with experimental findings on the continuum bands in these mutants (9,10). In the regime between 1800 cm−1 and 1700 cm−1, no carbonyl bands can be observed for WT protein, and small carbonyl bands can be observed at 1726 cm−1 for E204D and at 1733 cm−1 for E194D. Compared with the respective spectra, the intensity of these bands is much smaller than the corresponding measured bands. Inset: experimentally observed carboxylic residue deprotonations in Glu-194/204 mutants (10). In E204D (purple), deprotonation of Asp-204 can be observed at 1712 cm−1 (gray). In E194D (blue), deprotonation of Glu-204 can be observed at 1709 cm−1 (gray). These carbonyl bands correspond well with the calculated bands at 1726 cm−1 and 1733 cm−1, respectively.
To analyze whether the calculated signatures of protonations in E204D and E194D really result from the experimentally observed protonation of Glu/Asp-204 in both mutants (9), we performed an oxygen–oxygen and oxygen–excess-hydrogen distance analysis for amino acids 194 and 204 in WT bR and Glu-194/204 mutants. The results are presented in Fig. S8. From WT over E204D to E194D, the amount of Glu-shared/delocalized proton decreases stepwise and finally disappears (Fig. S8 A). The same trend can be observed for the minimal amino acid 194/204 oxygen–oxygen distance distribution. The glutamate/aspartate-shared proton system is found at a distance of ∼2.3–2.8 Å. Similarly for the oxygen–hydrogen distances, the amount of Glu-shared/delocalized proton decreases in a stepwise manner and finally disappears from WT over E204D to E194D. Both results are in agreement with the stepwise loss in intensity of the continuum band (see Fig. 2 A). However, a detailed analysis of the distance distribution between amino acids 194 and 204, and the appearance of an excess proton during simulation, separately resolved for positions 194 and 204 (Fig. S8 B), reveals that in E204D the proton is partially localized. This is in agreement with the experimental data but in contrast to the notion that this localization takes place at Glu-194 and not Asp-204, which is the experimentally determined binding position in this mutant (9). In E194D, Glu-204 becomes fully protonated. This again is in agreement with experimental observations (9,10). In benchmark calculations with both second-order (38) and third-order (21) SCC-DFTB, carboxylic acids exhibited an increasing proton affinity with increasing side-chain length, which is in agreement with the known experimental proton affinities of isolated carboxylic acids in water. Therefore, we assume that the simulated aspartate protonates the glutamate due to these resulting affinities, which is in agreement with the idea of treating them as isolated compounds, but not with the experimentally observed situation in bR. In our simulations, we find that in each system with a mix of one aspartate and one glutamate, the glutamate becomes protonated and the aspartate remains deprotonated. As a result, the proton distribution in partially or fully delocalized/shared systems (e.g., WT and E204D) is not in agreement with conclusions drawn from FTIR investigations, although the proton distribution is in agreement with experimentally derived protonation states in localized systems with full protonations. Therefore, it seems that the proton distribution at the release site observed in SCC-DFTB simulations in bR is in line with models based on experimental FTIR results if only localized protons are involved. Furthermore, it shows that induction of a small structural and/or chemical asymmetry in the protein surroundings already in the form of a glutamate-to-aspartate mutation shifts the delocalized proton at the release site to a localized binding site at one amino acid residue. Although the structural and chemical changes induced by these mutations compared with WT protein are in the range of 0.1 Å and 0.1 kcal/mol, they determine the presence or absence of the continuum band. This highlights the high sensitivity of the continuum band as a spectral marker for such small changes, which are well below the resolution of x-ray crystallographic methods.
Although proton localization does not take place in WT bR in its ground state, a proton localized on either Glu-194 or Glu-204 has been observed experimentally during the photocycle in the M intermediate (10). Changing the pH from 7 to 5 increases the residence time of this proton on the glutamates, and the protonation of Glu-194/204 can be experimentally resolved. Fig. 4 shows the absorbance band of the interchangeable protonation of Glu-194/204 (10) compared with the spectral signatures of Asp-194 and Asp-204 in E194D and E204D mutant bR, respectively. Furthermore, this result shows that a protonation of Glu-194/204 in the BR ground state, as seen in the large QM box simulations, would have been observed and therefore can be excluded. The protonation of the Glu-194/204 pair in the early M state resembles a dynamic interplay between single protonations of Glu-194 and Glu-204. This is similar to the situation observed above in the intermediate and large QM boxes: introduction of chemical asymmetry by the surrounding amino acids causes the proton to be shifted to Glu-194. Therefore, this localization observed in our SCC-DFTB calculations for the ground state resembles the situation experimentally observed in the bR M intermediate, but not in the ground state. However, such changes in the surrounding amino acids provide a clue as to how the proton diode works in the protein (10). In water, a random change in the second hydration shell of water molecules induces proton transfer. In the protein, the transfer becomes controlled because amino acid residues substitute for the second hydration shell water molecules: the controlled movement of Arg-82 during the photocycle of bR affects the positions of the protein-internal water molecules at the release site and induces a vectorial proton transfer (10,28). The delocalized proton becomes localized on either Glu-194 or Glu-204, and this is the prerequisite to open the Ser-193 gate. In other words, a localized proton in the BR ground state would open the Ser-193 gate too early and prevent proton pumping. The internal water cluster would merge with bulk water, and the proton would be released in a classical Grotthuss proton transfer to the bulk medium, as proposed in the proton diode model. We therefore need to discriminate between a delocalized proton at the release group in the ground state and a localized proton at the exit site at Glu-194 and Glu-204 in the early M state. This interplay between a delocalized and a localized proton-binding site, as shown in Fig. 2 A, is the key of the release mechanism.
Figure 4.
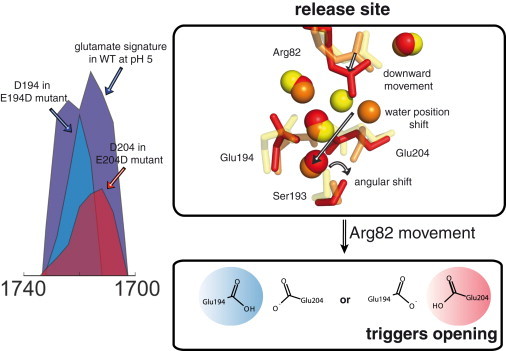
Conversion of the proton storage site into the proton release site. Left: transient glutamate protonation signature in WT bR at pH 5 (purple) in overlay with transient aspartate protonation signals from E194D (blue) and E204D (red) bR mutants (10). The signal is consistent with a full protonation of either Glu-194 and/or Glu-204 during proton release. Right: proposed molecular mechanism during proton release. Superposition of the release site structures of WT bR (yellow) (PDB ID 1C3W (23)), E204D (orange) (2WJK (10)) and E194D (red) (2WJL) (10) mutants, showing water and amino acid side-chain position changes during proton release (10). An Arg-82 movement triggers a shift in water positions, which leads to the discrete localization of the proton on Glu-194 or Glu-204. As shown in earlier simulations (10), the protonation of Glu-204 leads to opening of the release site to the bulk solvent and release of the excess proton.
Conclusions
We conclude that a combination of SCC-DFTB calculations and experimental FTIR spectroscopy by comparison of measured and calculated IR spectra points to a significant contribution of protein-internal water molecules as temporary binding sites for the excess proton at the release site of bR. Current theoretical approaches in the form of PMF calculations show a preference for a glutamate-shared proton, whereas experimental FTIR results are most in line with a delocalization over the full release site up to Tyr-57. Furthermore, in large, chemically asymmetric QM boxes that include all amino acid side chains known experimentally to participate in proton solvation, the excess proton becomes localized at Glu-194, which is not in agreement with experimental observations. As a reason for this localization, we identify geometrical changes at the release site that arise from differences in interresidual forces across the QM/MM box border in the different QM boxes. As proton transfer barriers are sensitive to distance differences on the order of 0.1 Å, even small geometrical changes can cause this localization. We assume that the two minimal size QM boxes, which result in a computed continuum band (i.e., a protonated water cluster QM box and a chemically symmetric glutamate-shared proton QM box) can be seen as two extreme cases of possible proton delocalization modes. The continuum band in the extended spectral region down to 1700 cm−1 shows a better agreement with the IR spectra calculated from the protonated water cluster QM box than with the spectra from the glutamate-shared proton QM box. This points to a proton delocalization via the protein-internal water molecules, which is in line with H218O labeling experiments (13). However, we also do not support the proposal that the proton is exclusively stored on the water molecules in the form of a classical Zundel (4) or asymmetric Eigen ion (3). Taking both experimental and theoretical results into account, we propose that the release site forms an amino acid-solvated protonated water complex, with the proton being delocalized over both amino acids and water molecules in the ground state, which is clearly different from the situation in water and ice (39). The results from calculations on different QM box sizes and glutamate/aspartate mutants show that the position of the excess proton is highly sensitive to small changes in the symmetry and chemical composition of the surrounding environment. In any case, protein-bound water molecules are essential for the proton release mechanism, as shown in Fig. 2 A, irrespective of the exact mode of excess proton distribution.
Acknowledgments
We thank Q. Cui for helpful discussions and for welcoming S.W. into his research group. We also thank M. Elstner for helpful discussions and P. Phatak for providing simulation structures for structural comparison. Calculations were performed at the CAS-MPG Partner Institute for Computational Biology High-Performance Computing Cluster.
S.W. is funded by a Chinese Academy of Sciences Fellowship for Young International Scientists. This work was supported by a grant from the National Natural Science Foundation of China (NSFC) Research Fund for International Young Scientists (grant No. 31250110070).
Supporting Material
References
- 1.Gerwert K., Freier E., Wolf S. The role of protein-bound water molecules in microbial rhodopsins. Biochim. Biophys. Acta. 2014;1837:606–613. doi: 10.1016/j.bbabio.2013.09.006. [DOI] [PubMed] [Google Scholar]
- 2.Garczarek F., Gerwert K. Functional waters in intraprotein proton transfer monitored by FTIR difference spectroscopy. Nature. 2006;439:109–112. doi: 10.1038/nature04231. [DOI] [PubMed] [Google Scholar]
- 3.Eigen M. Proton transfer, acid-base catalysis, and enzymatic hydrolysis. Part I: Elementary processes. Angew. Chem. Int. Ed. Engl. 1964;3:1–19. [Google Scholar]
- 4.Zundel G. Hydration structure and intermolecular interaction in polyelectrolytes. Angew. Chem. Int. Ed. Engl. 1969;8:499–509. [Google Scholar]
- 5.Freier E., Wolf S., Gerwert K. Proton transfer via a transient linear water-molecule chain in a membrane protein. Proc. Natl. Acad. Sci. USA. 2011;108:11435–11439. doi: 10.1073/pnas.1104735108. [DOI] [PMC free article] [PubMed] [Google Scholar]
- 6.Spudich J.L., Jung H.K. Microbial rhodopsins: phylogenetic and functional diversity. In: Briggs W.R., Spudich J.L., editors. Handbook of Photosensory Receptors. Wiley-VCH; Weinheim: 2004. pp. 1–24. [Google Scholar]
- 7.Heberle J., Deupi X., Schertler G. Retinal proteins—you can teach an old dog new tricks (special issue) Biochim. Biophys. Acta. 2014;1837:531–716. doi: 10.1016/j.bbabio.2014.02.019. [DOI] [PubMed] [Google Scholar]
- 8.Rammelsberg R., Huhn G., Gerwert K. Bacteriorhodopsin’s intramolecular proton-release pathway consists of a hydrogen-bonded network. Biochemistry. 1998;37:5001–5009. doi: 10.1021/bi971701k. [DOI] [PubMed] [Google Scholar]
- 9.Garczarek F., Brown L.S., Gerwert K. Proton binding within a membrane protein by a protonated water cluster. Proc. Natl. Acad. Sci. USA. 2005;102:3633–3638. doi: 10.1073/pnas.0500421102. [DOI] [PMC free article] [PubMed] [Google Scholar]
- 10.Wolf S., Freier E., Gerwert K. Directional proton transfer in membrane proteins achieved through protonated protein-bound water molecules: a proton diode. Angew. Chem. Int. Ed. Engl. 2010;49:6889–6893. doi: 10.1002/anie.201001243. [DOI] [PubMed] [Google Scholar]
- 11.Headrick J.M., Diken E.G., Jordan K.D. Spectral signatures of hydrated proton vibrations in water clusters. Science. 2005;308:1765–1769. doi: 10.1126/science.1113094. [DOI] [PubMed] [Google Scholar]
- 12.Kulig W., Agmon N. A ‘clusters-in-liquid’ method for calculating infrared spectra identifies the proton-transfer mode in acidic aqueous solutions. Nat. Chem. 2013;5:29–35. doi: 10.1038/nchem.1503. [DOI] [PubMed] [Google Scholar]
- 13.Lórenz-Fonfría V.A., Furutani Y., Kandori H. Active internal waters in the bacteriorhodopsin photocycle. A comparative study of the L and M intermediates at room and cryogenic temperatures by infrared spectroscopy. Biochemistry. 2008;47:4071–4081. doi: 10.1021/bi7024063. [DOI] [PubMed] [Google Scholar]
- 14.Morgan J.E., Vakkasoglu A.S., Maeda A. Structure changes upon deprotonation of the proton release group in the bacteriorhodopsin photocycle. Biophys. J. 2012;103:444–452. doi: 10.1016/j.bpj.2012.06.022. [DOI] [PMC free article] [PubMed] [Google Scholar]
- 15.Mathias G., Marx D. Structures and spectral signatures of protonated water networks in bacteriorhodopsin. Proc. Natl. Acad. Sci. USA. 2007;104:6980–6985. doi: 10.1073/pnas.0609229104. [DOI] [PMC free article] [PubMed] [Google Scholar]
- 16.Phatak P., Ghosh N., Elstner M. Amino acids with an intermolecular proton bond as proton storage site in bacteriorhodopsin. Proc. Natl. Acad. Sci. USA. 2008;105:19672–19677. doi: 10.1073/pnas.0810712105. [DOI] [PMC free article] [PubMed] [Google Scholar]
- 17.Goyal P., Ghosh N., Cui Q. Proton storage site in bacteriorhodopsin: new insights from quantum mechanics/molecular mechanics simulations of microscopic pK(a) and infrared spectra. J. Am. Chem. Soc. 2011;133:14981–14997. doi: 10.1021/ja201568s. [DOI] [PMC free article] [PubMed] [Google Scholar]
- 18.Spassov V.Z., Luecke H., Bashford D. pK(a) Calculations suggest storage of an excess proton in a hydrogen-bonded water network in bacteriorhodopsin. J. Mol. Biol. 2001;312:203–219. doi: 10.1006/jmbi.2001.4902. [DOI] [PubMed] [Google Scholar]
- 19.Rousseau R., Kleinschmidt V., Marx D. Assigning protonation patterns in water networks in bacteriorhodopsin based on computed IR spectra. Angew. Chem. Int. Ed. Engl. 2004;43:4804–4807. doi: 10.1002/anie.200453857. [DOI] [PubMed] [Google Scholar]
- 20.Elstner M., Porezag D., Seifert G. Self-consistent-charge density-functional tight-binding method for simulations of complex materials properties. Phys. Rev. B. 1998;58:7260. [Google Scholar]
- 21.Yang Y., Yu H., Elstner M. Extension of the self-consistent-charge density-functional tight-binding method: third-order expansion of the density functional theory total energy and introduction of a modified effective coulomb interaction. J. Phys. Chem. A. 2007;111:10861–10873. doi: 10.1021/jp074167r. [DOI] [PubMed] [Google Scholar]
- 22.Brooks B.R., Brooks C.L., third, Karplus M. CHARMM: the biomolecular simulation program. J. Comput. Chem. 2009;30:1545–1614. doi: 10.1002/jcc.21287. [DOI] [PMC free article] [PubMed] [Google Scholar]
- 23.Luecke H., Schobert B., Lanyi J.K. Structure of bacteriorhodopsin at 1.55 A resolution. J. Mol. Biol. 1999;291:899–911. doi: 10.1006/jmbi.1999.3027. [DOI] [PubMed] [Google Scholar]
- 24.Agmon N. The Grotthuss mechanism. Chem. Phys. Lett. 1995;244:456–462. [Google Scholar]
- 25.Marx D. Proton transfer 200 years after von Grotthuss: insights from ab initio simulations. ChemPhysChem. 2006;7:1848–1870. doi: 10.1002/cphc.200600128. [DOI] [PubMed] [Google Scholar]
- 26.Gerwert K., Souvignier G., Hess B. Simultaneous monitoring of light-induced changes in protein side-group protonation, chromophore isomerization, and backbone motion of bacteriorhodopsin by time-resolved Fourier-transform infrared spectroscopy. Proc. Natl. Acad. Sci. USA. 1990;87:9774–9778. doi: 10.1073/pnas.87.24.9774. [DOI] [PMC free article] [PubMed] [Google Scholar]
- 27.Baer M., Mathias G., Marx D. Spectral signatures of the pentagonal water cluster in bacteriorhodopsin. ChemPhysChem. 2008;9:2703–2707. doi: 10.1002/cphc.200800473. [DOI] [PubMed] [Google Scholar]
- 28.Wolf S., Freier E., Gerwert K. How does a membrane protein achieve a vectorial proton transfer via water molecules? ChemPhysChem. 2008;9:2772–2778. doi: 10.1002/cphc.200800703. [DOI] [PubMed] [Google Scholar]
- 29.Sadhukhan S., Muñoz D., Scuseria G.E. Predicting proton transfer barriers with density functional methods. Chem. Phys. Lett. 1999;306:83–87. [Google Scholar]
- 30.Gaus M., Goez A., Elstner M. Parametrization and benchmark of DFTB3 for organic molecules. J. Chem. Theory Comput. 2013;9:338–354. doi: 10.1021/ct300849w. [DOI] [PubMed] [Google Scholar]
- 31.Hu L., Söderhjelm P., Ryde U. On the convergence of QM/MM energies. J. Chem. Theory Comput. 2011;7:761–777. doi: 10.1021/ct100530r. [DOI] [PubMed] [Google Scholar]
- 32.Pu J., Gao J., Truhlar D.G. Multidimensional tunneling, recrossing, and the transmission coefficient for enzymatic reactions. Chem. Rev. 2006;106:3140–3169. doi: 10.1021/cr050308e. [DOI] [PMC free article] [PubMed] [Google Scholar]
- 33.Elstner M. The SCC-DFTB method and its application to biological systems. Theor. Chem. Acc. 2005;116:316–325. [Google Scholar]
- 34.Yu H., Cui Q. The vibrational spectra of protonated water clusters: a benchmark for self-consistent-charge density-functional tight binding. J. Chem. Phys. 2007;127:234504. doi: 10.1063/1.2806992. [DOI] [PubMed] [Google Scholar]
- 35.Maupin C.M., Aradi B., Voth G.A. The self-consistent charge density functional tight binding method applied to liquid water and the hydrated excess proton: benchmark simulations. J. Phys. Chem. B. 2010;114:6922–6931. doi: 10.1021/jp1010555. [DOI] [PubMed] [Google Scholar]
- 36.Goyal P., Elstner M., Cui Q. Application of the SCC-DFTB method to neutral and protonated water clusters and bulk water. J. Phys. Chem. B. 2011;115:6790–6805. doi: 10.1021/jp202259c. [DOI] [PMC free article] [PubMed] [Google Scholar]
- 37.Liang R., Swanson J.M.J., Voth G.A. Benchmark study of the SCC-DFTB approach for a biomolecular proton channel. J. Chem. Theory Comput. 2014;10:451–462. doi: 10.1021/ct400832r. [DOI] [PMC free article] [PubMed] [Google Scholar]
- 38.König P.H., Hoffmann M., Cui Q. A critical evaluation of different QM/MM frontier treatments with SCC-DFTB as the QM method. J. Phys. Chem. B. 2005;109:9082–9095. doi: 10.1021/jp0442347. [DOI] [PubMed] [Google Scholar]
- 39.Ball P. Water as an active constituent in cell biology. Chem. Rev. 2008;108:74–108. doi: 10.1021/cr068037a. [DOI] [PubMed] [Google Scholar]
- 40.Mackerell A.D., Bashford D., Karplus M. All-atom empirical potential for molecular modeling and dynamics studies of proteins. J. Phys. Chem. B. 1998;102:3586–3616. doi: 10.1021/jp973084f. [DOI] [PubMed] [Google Scholar]
- 41.Jorgensen W.L., Chandrasekhar J., Klein M.L. Comparison of simple potential functions for simulating liquid water. J. Chem. Phys. 1983;79:926–935. [Google Scholar]
- 42.Brünger A.T., Karplus M. Polar hydrogen positions in proteins: empirical energy placement and neutron diffraction comparison. Proteins. 1988;4:148–156. doi: 10.1002/prot.340040208. [DOI] [PubMed] [Google Scholar]
- 43.Balashov S.P. Protonation reactions and their coupling in bacteriorhodopsin. Biochim. Biophys. Acta. 2000;1460:75–94. doi: 10.1016/s0005-2728(00)00131-6. [DOI] [PubMed] [Google Scholar]
- 44.Tajkhorshid E., Suhai S. Influence of the methyl groups on the structure, charge distribution, and proton affinity of the retinal Schiff base. J. Phys. Chem. B. 1999;103:5581–5590. [Google Scholar]
- 45.Tajkhorshid E., Paizs B., Suhai S. Role of isomerization barriers in the pKa control of the retinal Schiff base: a density functional study. J. Phys. Chem. B. 1999;103:4518–4527. [Google Scholar]
- 46.Im W., Bernèche S., Roux B. Generalized solvent boundary potential for computer simulations. J. Chem. Phys. 2001;114:2924. [Google Scholar]
- 47.Brooks C.L., third, Karplus M. Solvent effects on protein motion and protein effects on solvent motion. Dynamics of the active site region of lysozyme. J. Mol. Biol. 1989;208:159–181. doi: 10.1016/0022-2836(89)90093-4. [DOI] [PubMed] [Google Scholar]
- 48.Hess B., Kutzner C., Lindahl E. GROMACS 4: algorithms for highly efficient, load-balanced, and scalable molecular simulation. J. Chem. Theory Comput. 2008;4:435–447. doi: 10.1021/ct700301q. [DOI] [PubMed] [Google Scholar]
- 49.Steinbach P.J., Brooks B.R. New spherical-cutoff methods for long-range forces in macromolecular simulation. J. Comput. Chem. 1994;15:667–683. [Google Scholar]
- 50.Gordon R.G. Molecular motion in infrared and raman spectra. J. Chem. Phys. 1965;43:1307–1312. [Google Scholar]
- 51.McQuarrie D.A. Harper and Row; New York: 1976. Statistical Mechanics. [Google Scholar]
- 52.Ryckaert J.-P., Ciccotti G., Berendsen H.J.C. Numerical integration of the cartesian equations of motion of a system with constraints: molecular dynamics of n-alkanes. J. Comput. Phys. 1977;23:327–341. [Google Scholar]
- 53.Torrie G.M., Valleau J.P. Nonphysical sampling distributions in Monte Carlo free-energy estimation: umbrella sampling. J. Comput. Phys. 1977;23:187–199. [Google Scholar]
- 54.Kumar S., Rosenberg J.M., Kollman P.A. The weighted histogram analysis method for free-energy calculations on biomolecules. I. The method. J. Comput. Chem. 1992;13:1011–1021. [Google Scholar]
- 55.Schobert B., Cupp-Vickery J., Lanyi J. Crystallographic structure of the K intermediate of bacteriorhodopsin: conservation of free energy after photoisomerization of the retinal. J. Mol. Biol. 2002;321:715–726. doi: 10.1016/s0022-2836(02)00681-2. [DOI] [PubMed] [Google Scholar]
- 56.Lanyi J.K., Schobert B. Structural changes in the L photointermediate of bacteriorhodopsin. J. Mol. Biol. 2007;365:1379–1392. doi: 10.1016/j.jmb.2006.11.016. [DOI] [PMC free article] [PubMed] [Google Scholar]
- 57.Facciotti M.T., Rouhani S., Glaeser R.M. Structure of an early intermediate in the M-state phase of the bacteriorhodopsin photocycle. Biophys. J. 2001;81:3442–3455. doi: 10.1016/S0006-3495(01)75976-0. [DOI] [PMC free article] [PubMed] [Google Scholar]
- 58.Borshchevskiy V.I., Round E.S., Gordeliy V.I. X-ray-radiation-induced changes in bacteriorhodopsin structure. J. Mol. Biol. 2011;409:813–825. doi: 10.1016/j.jmb.2011.04.038. [DOI] [PubMed] [Google Scholar]
- 59.Faham S., Yang D., Bowie J.U. Side-chain contributions to membrane protein structure and stability. J. Mol. Biol. 2004;335:297–305. doi: 10.1016/j.jmb.2003.10.041. [DOI] [PubMed] [Google Scholar]
- 60.Belrhali H., Nollert P., Pebay-Peyroula E. Protein, lipid and water organization in bacteriorhodopsin crystals: a molecular view of the purple membrane at 1.9 A resolution. Structure. 1999;7:909–917. doi: 10.1016/s0969-2126(99)80118-x. [DOI] [PubMed] [Google Scholar]
- 61.Lee S.C., Bennett B.C., Zhang Q. Steroid-based facial amphiphiles for stabilization and crystallization of membrane proteins. Proc. Natl. Acad. Sci. USA. 2013;110:E1203–E1211. doi: 10.1073/pnas.1221442110. [DOI] [PMC free article] [PubMed] [Google Scholar]
- 62.Kouyama T., Nishikawa T., Okumura H. Crystal structure of the L intermediate of bacteriorhodopsin: evidence for vertical translocation of a water molecule during the proton pumping cycle. J. Mol. Biol. 2004;335:531–546. doi: 10.1016/j.jmb.2003.10.068. [DOI] [PubMed] [Google Scholar]
Associated Data
This section collects any data citations, data availability statements, or supplementary materials included in this article.