

Abstract
The C36 CHARMM lipid force field has been extended to include sphingolipids, via a combination of high-level quantum mechanical calculations on small molecule fragments, and validation by extensive molecular dynamics simulations on N-palmitoyl and N-stearoyl sphingomyelin. NMR data on these two molecules from several studies in bilayers and micelles played a strong role in the development and testing of the force field parameters. Most previous force fields for sphingomyelins were developed before the availability of the detailed NMR data and relied on x-ray diffraction of bilayers alone for the validation; these are shown to be too dense in the bilayer plane based on published chain order parameter data from simulations and experiments. The present simulations reveal O-H:::O-P intralipid hydrogen bonding occurs 99% of the time, and interlipid N-H:::O=C (26-29%, depending on the lipid) and N-H:::O-H (17–19%). The interlipid hydrogen bonds are long lived, showing decay times of 50 ns, and forming strings of lipids, and leading to reorientational correlation time of nearly 100 ns. The spontaneous radius of curvature for pure N-palmitoyl sphingomyelin bilayers is estimated to be 43–100 Å, depending on the assumptions made in assigning a bending constant; this unusual positive curvature for a two-tailed neutral lipid is likely associated with hydrogen bond networks involving the NH of the sphingosine group.
Introduction
Biological membranes are complicated systems that are made up of thousands of different lipid components (1). These lipid components are classified into several different types, with glycerophospholipids, sterols, and sphingolipids the most important (1). Sphingolipids are a diverse class of lipids, encapsulating numerous distinct structures that stem from a sphingoid base (2). Structurally, sphingolipids share many similarities with glycerophospholipids but contain key differences at the interfacial region, i.e., the γ-chain (sn-1) carbonyl group that is found on glycerophospholipids is replaced by a set of trans double bonded carbons, whereas the ester group of the β-chain (sn-2) is replaced by an amide bond (Fig. 1). Certain sphingolipids are thought to be sorted along with sterols into microdomains known as lipid rafts, and transported down the vesicular pathway toward the plasma membrane where they are enriched in the noncytosolic (outer) leaflet (1). A variety of sphingolipids hold important signaling roles within the cell. For example, ceramides are inhibitors of cell proliferation and a promoter of apoptosis, whereas sphingosine-1-phosphate has the opposite affect (3). Lipid rafts may act as platforms concentrating signaling molecules or proteins (3).
Figure 1.
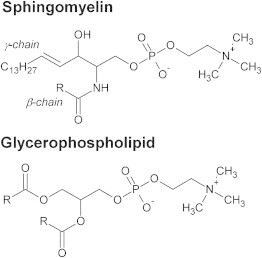
Structural differences between sphingolipids and glycerophospholipids.
Despite the widespread biological presence of these lipids, there is far less structural information available for pure bilayers of sphingolipids than their glycerolipid counterparts. X-ray scattering was used to study the bilayer density profiles of N-acyl sphingomyelins (SM) with fully saturated acyl chain lengths of 16, 18, 20, 22, and 24 at 50°C (4). The bilayer thickness (peak-to-peak distances, dP-P) of the 16:0 and 18:0 chains were estimated to be 36.5 and 38.5 Å, respectively. A later x-ray study (5) by the same group indicated that SM with a 16:0 chain has a dP-P = 40.0–44.5 Å at 55°C, in conflict with previous measurements. The synthesis of SM results in a mix of D-erythro-SM and L-threo isomers (5), which may be at different concentrations for these two studies. Although surface areas per lipid were reported in the x-ray studies, the lipid volume assumptions are likely to introduce errors that prevent an accurate estimate this parameter (6). In more recent studies, deuterium NMR was used to study chain order of fully deuterated β-chains of N-palmitoyl sphingomyelin (PSM) bilayers at several temperatures (7–9). The average deuterium order parameter (SCD) of PSM (7) for carbons 4–6 was higher (0.25) than DPPC (10) (0.21) indicating more chain order with PSM bilayers.
Molecular dynamics simulations of lipid membranes require the use of force fields to describe interactions between particles, which can be represented as all-atom, united-atom (hydrogens are implicitly included on the heavy atom), or coarse-grained (3–4 heavy atoms are grouped together). Although parameters for coarse-grained sphingolipids been limited (11), parameters have been developed for united-atom and all-atom SM lipids by several groups associated with GROMOS (12,13), OPLS (14), CHARMM (15,16), and recently the Slipids (17) force fields, targeting both PSM and N-stearoyl sphingomyelin (SSM). The preceding GROMOS, OPLS, and CHARMM force fields were tested against only the x-ray data because this was the only experimental data available. For PSM, the dP-P values from simulations were all in the range of 42–44 Å (Table 1). Although these appeared to be in good agreement with the latter Maulik and Shipley x-ray experiments (5), the area per lipid from molecular dynamics (MD) simulations with the GROMOS and CHARMM force fields suggest that these values may not be at equilibrium over the relatively short (5–50 ns) simulations. The trend based on reported time series is for a decrease in the area and thus an increase in dP-P. The area per lipid for these previous PSM simulations is similar (51–53 Å2) even though these were run at different temperatures, whereas Slipids yields a value of 54.1 Å2. Simulations using the second set of SM parameters (16) developed in the context of CHARMM focused on SSM/cholesterol mixtures, and did not report dP-P or area data for the pure SSM bilayer. However, as shown in Table 1, more recent NMR SCD values for plateau carbons (0.25) are lower than those obtained from GROMOS and CHARMM (∼0.30), indicating a significantly higher order in those simulations compared to experiment (7). The Slipids force field results in a better agreement with experiment with an average SCD of ∼0.27 (17). Because order is inversely related to area (18), this implies that SM force fields before Slipids produce SM bilayers that are laterally too dense. MD studies with the GROMOS force fields have used these parameters to investigate raft-forming lipid mixtures, and, if the area per lipid is too small, may incorrectly describe the subtle lipid-lipid and lipid-water interactions for SM bilayers. Thus, to date simulations do not present a consistent picture of SM bilayer properties. This is largely associated with issues regarding the lack of stereochemically pure SM samples in the previous x-ray studies (4,5), such that available x-ray scattering results do not provide optimal primary target data for force field parameterization.
Table 1.
Comparison of PSM fluid phase properties at ∼50°C from experiment (x-ray and NMR) and from MD simulations with sphingomyelin force fields
| Source | dP-P, Å | Area/lipid, Å2 | |SCD| plateaua |
|---|---|---|---|
| CHARMM (15) | 44.2 | 51.5 | 0.319 |
| GROMOS (13,22) | 43.8 | 53.3 | 0.301 |
| GROMOS (12) | 43.4 | 52.0 | 0.299 |
| Slipids (17) | 42.2 | 54.1 | 0.274 |
| This work | 40.7 | 55.4 | 0.257 |
| X-ray (5) | 42 | 47b | – |
| NMR (7) | – | – | 0.253 |
The plateau region was taken as the average over the range of C5 to C9 on β-chains.
This value is subject to a number of assumptions; see the text for details.
This work presents a systematic development of an all-atom additive SM bilayer force field (FF) that agrees with NMR data for SM bilayers, including both the d-31 PSM studies cited previously, as well as more recent studies on SSM bilayers (19,20). It is developed in a manner consistent with the additive CHARMM FF and extends the C36 lipid FF (21) to include sphingomyelins. The following sections describe the methods used to optimize the FF, including the quantum mechanical (QM) calculations that form the basis of this FF. Simulations of SSM and PSM bilayers using the FF are then compared to experiment. The types and lifetimes of hydrogen bonds for PSM are evaluated, and the reorientational relaxation of PSM and DPPC are compared. The last subsection of the Results considers mechanical properties, including the spontaneous curvature. The Discussion section first considers the impact of newer experimental data and the area/lipid on the force field development for sphingomyelin, and related simulation issues. It then focuses on the relationship between the long lived hydrogen bonding at the branch point of PSM and its slow rotational relaxation and unusual positive spontaneous curvature.
Methods
QM calculations
The Gaussian03 suite of programs (23) was used to perform all QM calculations. Because high-level QM calculations on the conformational space of a full lipid are prohibitive, model compounds were used to represent regions of the lipid that required development and adjustment of parameters from C36 lipid (21) and protein (24) force fields. All QM calculations were performed with MP2/cc-pVDZ model chemistry. Larger basis sets and higher treatment of electron correlation with a hybrid method (25) had a minimal effect on conformational energies and thus the lower level calculations were used to allow for more efficient computations on a wider range of conformations. Conformations were optimized using the Opt = Tight option in Gaussian for all model compounds.
Various model compounds were used to calculate dihedral potential energy scans (PES) for several torsion angles (Fig. 2). For these calculations, the torsion angle of interest was fixed to the desired value and other degrees of freedom were allowed to relax. However, for CER4 the scans on t1 and t2 were based on additional torsional constraints in the trans state for the last two carbon dihedrals on the γ-chain. Dihedral parameters were fit to reproduce the MP2/cc-pVDZ PES with the Monte Carlo simulated annealing approach (26) maintaining identical torsion constraints as applied in the QM calculations.
Figure 2.
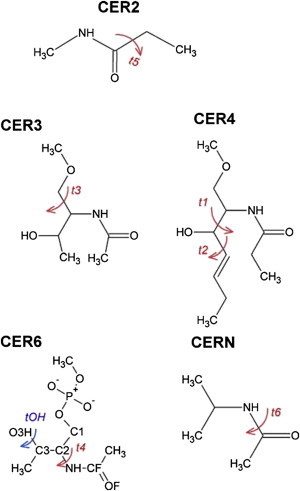
Model compounds used in charge and dihedral optimization. The dihedrals calculated with QM are shown in red and blue. To see this figure in color, go online.
Partial atomic charges were developed from CHelpG (27) based on the MP2/cc-pVDZ density from various optimized conformations of a model compound that contained the amide, phosphate, and alcohol moieties (CER6 in Fig. 2).
Model building and simulations with CHARMM
The C36b and C37b Fortran95 versions of CHARMM (28) were used for all model building, MD simulations, and analyses. For optimum performance, the MD simulations used the newly added (C37b) domain decomposition (DOMDEC) code (29). Bilayer models were built de novo for PSM (SM16:0), SSM (SM18:0), and DOPE, first generating a library of single lipid conformations via restrained Langevin dynamics, and then packing the lipids into a bilayer configuration via random conformation selection and headgroup placement on a two-dimensional hexagonal lattice followed by hydration, with the cleavage plane at z = 0 (21). After energy minimization and MD equilibration, the same coordinate set was used repeatedly for evaluating parameter set variations. Minimization and dynamics of solvated systems employed particle mesh Ewald (PME) for electrostatics (30), and a force-switched Lennard-Jones (L-J) term to represent the van der Waals contribution. A potential and force cutoff of 12 Å was used for the L-J term, and for the boundary between real-space and k-space for PME; the force switching function began at 10 Å for the L-J term. The PME calculations used a κ value of 0.32, a grid spacing of ∼1 Å, and interpolation from a 5th order spline for the complementary error function. The SHAKE constraint with a tolerance of 1 × 10⁻¹⁰ was applied to all bonds involving a hydrogen atom. A simulation time step of 1.0 fs was used, and the PME grid was updated on every integration step. A fully anisotropic extended system NPT ensemble (31) was used for the MD simulations, with a tetragonal lattice for the periodic boundary conditions. Pressure was computed via the internal virial, coupled to frictionless pistons with masses of 1000 amu. A Hoover thermostat was used to regulate temperature, with a coupling constant of 5000 kcal mol−1 ps−2, with the target temperatures indicated in Table 2. Coordinate sets were stored at 1.0 ps intervals for subsequent analysis. The DPPC simulation was a continuation of the one used to validate the C36 lipid parameters (21).
Table 2.
Summary of simulation systems, and the observed area/lipid, lateral compressibilities (KA), and the distance across the bilayer between the planes of P atoms in each leaflet (dP-P)
| Lipid, T°C | Program | Nlipids | tRun, ns | Area/lipid, Å2 | KA, dyn/cm | dP-P, Å |
|---|---|---|---|---|---|---|
| PSM, 48 | CHARMM | 72 | 420 | 55.4 (0.2) | 350 (50) | 40.7 (0.1) |
| PSM, 48 | Anton | 288 | 1000 | 56.5 (0.1) | 290 (40) | 39.6 (0.2) |
| SSM, 45 | CHARMM | 72 | 520 | 54.5 (0.2) | 290 (40) | 43.0 (0.1) |
| SSM, 50 | CHARMM | 72 | 420 | 55.4 (0.2) | 440 (60) | 42.7 (0.1) |
| DPPC, 50 | CHARMM | 72 | 420 | 63.0 (0.1) | 230 (20) | 39.1 (0.1) |
| DOPE, 45 | CHARMM | 72 | 120 | 63.9 (0.2) | 280 (30) | 40.3 (0.1) |
Standard errors are indicated in parentheses.
Estimates for the free energy of solvation (ΔGsolv) for N-methyl-acetamide (NMA) were obtained using the protocol employed by Harder et al. (32).
Validation simulations with Anton
A PSM bilayer snapshot after 200 ns MD simulation with CHARMM with three of its neighboring images centered at (45 Å, 0, 0), (0, 45 Å, 0), and (45 Å, 45 Å, 0) was taken to initiate a 1-μs long simulation with Anton, a special-purpose supercomputer designed for long timescale MD simulations (33). This system had a total of 288 PSM molecules and its dimension in XYZ was 90 × 90 × 73 Å3. Because of the elongated shape of the original system, it had to be expanded in the XY dimension to satisfy the simulation criteria on Anton, which requires the simulated systems to be closer to cubic than the 45 × 45 × 73 Å3 system used for the CHARMM simulations. The new system was then equilibrated for 240 ps with CHARMM and simulated for 1 μs with Anton. The simulation was performed with constant pressure (1 atm along the membrane normal) and temperature (48°C). This was made possible on Anton with the Multigrator scheme. The Martyna-Tuckerman-Klein (MTK) barostat (34) and the Nosé-Hoover thermostat (35) were employed to hold the pressure and temperature at the desired levels. The lengths of all bonds involving hydrogen atoms were constrained using M-SHAKE (36). The van der Waals and short-range electrostatic interactions were truncated after 9.13 Å, a value suggested by the Anton guesser scripts based on the system chemistry. A separate 200-ns test run was performed with a larger Rcutoff (10 Å) to investigate how the choice of cutoff distance affects the simulation results. As the two simulations showed very similar bilayer properties including the per lipid area (Fig. S1 in the Supporting Material), the 1-μs long simulation used the cutoff scheme suggested by Anton. The long-range electrostatic interactions were treated differently from the short-range interactions; they were evaluated with a 64 × 64 × 64 mesh using the k-space Gaussian split Ewald method (37). The integration time step was 2 fs. The r-RESPA integration method (38) was used and this allowed different updating schedules of the bonded, short-range, and long-range interactions. In the simulation, the first two types of interactions were evaluated per time step and the more time consuming long-range electrostatic interactions were evaluated every three time steps. The coordinates were saved every 10 ps for the subsequent analyses.
Simulation data analysis
Area/lipid was computed as the planar projection, i.e., the unit cell a × b cross section divided by the number of lipids per leaflet. Averages were computed using data from every integration step for CHARMM, and from periodic snapshot values for Anton. The area compressibility, KA, was computed from
| (1) |
where kb is the Boltzmann constant, T is the absolute temperature, N is the number of lipids per leaflet, and 〈δA2〉 is the average of the squared fluctuation of the area per lipid. Standard error estimates for 〈A〉 were computed using 20ns blocks, and 50ns blocks were used to compute the standard error for KA.
The trans-bilayer distance dP-P was computed as a time series of 〈z〉upper – 〈z〉lower for the P atoms in the indicated bilayer leaflet, and reported as the average of the time series. Standard error estimates for dP-P were computed using 20ns blocks.
Hydrogen bonding was evaluated with CHARMM (COOR HBOND), and used the default distance cutoff of 2.4 Å between the donor H atoms and the acceptor O atoms, with no angle cutoff. The results were reported as the fraction of snapshots that had the particular H-bond pairings being considered; standard errors were computed from 50ns blocks (125 ns for Anton).
NMR order parameters, SCD, were computed as described previously (21). Average interproton distances were computed for comparison to nuclear Overhauser effect (NOE) measurements as 〈r−6〉−1/6. 〈J-couplings〉 for the H3-C3-C4-H4 dihedral involving the C4 = C5 vinyl group of the sphingosine molecule were calculated from the expression provided in the Supplemental Material of (19).
Spontaneous curvature and bending constants
The spontaneous radius of curvature R0 was obtained for PSM from the first moment of the symmetrized pressure profile:
| (2) |
where is the derivative of the bending free energy per lipid at zero curvature for the upper leaflet, pT(z) and pN(z) are the tangential and normal components of the z-dependent pressure tensor, is the monolayer bending constant, and is the spontaneous curvature; the limits extend from the bilayer midplane (z = 0) to the upper box length (Lz/2). The constants and c0 are the force constant and minimum, respectively, of the Helfrich Hamiltonian, a second order expansion of the leaflet free energy with respect to curvature (39). The computer code for calculating pressure profile (40) has not yet been incorporated into the much faster DOMDEC version of CHARMM because of incompatibility with the PME evaluations. Consequently, the pressure profiles were calculated here by generating 100ps trajectories from the restart files saved at 1 ns intervals of the primary trajectory. Profiles calculated with this technique, denoted resampling, are nearly equivalent to those calculated using all steps (see Fig. S2). This is because the fast motions contributing to the pressure average out on the 100ps timescale, and the slower ones are captured by spacing the trajectories at ns intervals. Resampling can be used to generate pressure profiles from previously run trajectories as long as the trajectories are sufficiently long (at least 100 ns for pure bilayers is recommended) and restart files are saved at ∼1ns intervals.
It is evident from Eq. 2 that a value of is required to extract R0, and this is not experimentally available for PSM. The monolayer bending modulus may reasonably be assumed to be half the bilayer bending modulus, , but this is also not available. Furthermore, there is currently considerable controversy regarding bilayer bending constants, with values for the same lipid differing by a factor of two depending on the experimental method, even though there is relatively little variation among bilayers for a particular method (41–43). For example, for DPPC at 50°C is 33.7 kbT as measured from shape fluctuations of vesicles (44) and 15 kbT from x-ray of multilamellar stacks (45); results for pipette aspiration (43,46) are not available for DPPC, though are generally similar to those from x-ray for other lipids (42). The monolayer bending constant of DOPE has been particularly well studied, as it is the primary matrix for determining the preferred curvature of lipids using the inverse hexagonal phase. Its value has been reported to be 11–12 kbT (47).
The preceding values of provide a starting point for estimating a plausible range of of PSM. The estimate may be refined by invoking the so-called polymer brush theory (46), which relates the bending constant, compressibility, and hydrocarbon thickness of a bilayer using the following logic: Bending a membrane produces a local lateral material deformation proportional to the distance (i.e., h) from the neutral surface. The bending energy depends on the square of the curvature, and thus the square of the magnitude of the deformation. Meanwhile, KA and are both proportional to the same interfacial tension, leading to where h is the bilayer thickness. Therefore, for a particular lipid can be estimated by scaling by the ratio of KA and squared lipid heights (both of which are easily calculated) of the target lipid and a lipid of known bending modulus. From the computed values of dP-P – 10 Å (as a surrogate for h) and KA from simulations of SM and DOPE (Table 2), kc (SM)/kc (DOPE) = 1.28. Assuming that this ratio holds for the monolayer bending constants, then = 14–15 kbT for PSM. Similarly, kc (SM)/kc (DPPC) =1.69. From the low (x-ray) to high (vesicle fluctuations) range of for DPPC, one obtains 12–29 kbT for for PSM. The preceding brackets the range from DOPE, and is used to subsequent estimates. These are listed in units of kcal/mol (see Table 5).
Table 5.
Monolayer bending constants (kcal/mol), derivative of the bending free energy (kcal/mol/Å), spontaneous curvature c0 (Å−1), and radius of spontaneous curvature R0 (Å) for PSM, DOPE, and DPPC
| Lipid | c0 | R0 | ||
|---|---|---|---|---|
| PSM | (8.1,18) | −0.186 | (0.0100,0.0247) | (43,100) |
| DOPE | (6.5,7.1) | 0.231 | (−0.0336,−0.0300) | (−33,−29) |
| DPPC | (4.8,11) | −0.0039 | (0.0001,0.0004) | >700 |
Values of the monolayer bending constant for DOPE are directly from experiment (47); those for DPPC are from the experimental range of bilayer bending constants divided by 2; those for PSM are from the range of DPPC, scaled using the polymer brush theory (see Methods for details).
Standard errors for are all 0.003; this error and the ranges of ranges in are factored into the ranges listed for c0 and R0.
Results
Developing force field parameters
The procedure used to develop CHARMM-compatible force field parameters for sphingolipids was similar to that adopted for the C36 FF (21). The approach for optimizing charges in CHARMM (48) is that these should reproduce QM-based interaction profiles of water with model compounds, approximate solution-based dipole moments, and free energies of solvation. Our past experience with the development of the C36 lipid force field (21) required an iterative and empirical approach for optimizing the charges. The supramolecule method (QM calculations on model molecule-water interactions) to optimize charges was not used, and instead the solvation free energy of NMA was used as the main target for charge optimization. Because fixed charges are an approximation to a polarizable lipid that depends on its environment and conformation, several sets of charges were validated on model compounds and lipid bilayers to determine the optimal parameters. Although many sets were tested, only two sets are to be compared in this work: 1), an unoptimized (u) charge set (C36u) based on the C36 lipid FF, but with missing charges and L-J terms taken from the protein force field (C22) (49); and 2), an optimal charge set (described below) that will be referred to here as C36. The torsional terms for C36u and C36 were both optimized to dihedral QM PES described below.
The charge distribution on atoms was based on studies of the CER6 model compound (Fig. 2), which contains the amide, alcohol, and phosphate moieties. This large model compound has at least six minima (Fig. S3) with largely varying conformations. The CHelpG MP2/cc-pVDZ charge distributions on the amide and alcohol region presented in Table S1 indicate significant variations among these conformations. For C36, the optimal parameters were those that matched the lowest energy conformations C5 and C6 (Fig. S3). The carbonyl, as with C36u optimization, was empirically adjusted to reduce the dipole and better match with the solvation free energies of NMA. The charges for C36u and C36 are also listed in Table S1.
The large differences between sphingo- and glycerophospholipids and the changes in charge distributions required a detailed investigation of the torsion profiles of several dihedral angles. Seven different torsion profiles were calculated with model compounds at the MP2/cc-pVDZ level. Fig. 2 shows the model compounds and their associated torsions. These were optimized for C36u and C36 and their fits are plotted in Fig. 3 and Fig. S4. The torsional energies are comparable between C36u and C36, suggesting any difference between bilayer properties is not influenced by these torsional profiles. The hydroxyl torsion (Fig. S4) was found to be important to include in the optimization, as shown previously (50), and is important in internal hydrogen bond formation. The values for the bonded and nonbonded terms for the C36 force field can be found in the Supporting Material and also downloaded (51).
Figure 3.
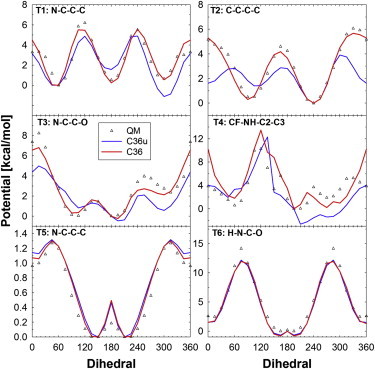
Six torsional fits to MP2/cc-pVDZ scans for C36u and C36. The model compounds for these torsion correspond to those labeled in Fig. 2. To see this figure in color, go online.
Given the presence of amides in the sphingolipid headgroups the free energy of aqueous solvation of NMA was determined, as the solvation free energy of this model compound is expected to be related to the headgroup solvation. The experimental ΔGsolv at 298K is −10.1 ± 0.2 kcal/mol (52,53). For C36u and C36, ΔGsolv = −7.9 ± 0.1, and −11.0 ± 0.1kcal/mol, respectively. Although the ΔGsolv of C36 is slightly more favorable than experiment, other values with weaker ΔGsolv failed to reproduce SM bilayer properties, indicating the significant role of solvation. This approach is similar to that used for the optimization of the ester moiety in the C36 phospholipids based on the model compound methyl acetate (21). Hence, although the combined nonbonded terms for the C36 SM model reasonably model the condensed phase energetics in the lipids, they may not represent the gas phase or other environments and should only be used for ceramide lipids.
Validation of the force field: comparison of simulated and experimental NMR J-coupling constants and order parameters for sphingomyelin bilayers
Table 2 lists the MD simulations used to validate the sphingomyelin parameters, along with an extension of a DPPC simulation originally used to validate the C36 lipid parameters, and used here for comparison purposes. The equilibrium average area/lipid, area compressibility, and bilayer thickness for each and the respective standard errors are tabulated. As noted in the Introduction, the area/lipid values are considerably larger than most previously published simulation studies (12–16) and slightly larger than that obtained with the newer Slipids (17) parameters. Time series of the area/lipid are shown in Fig. S5; the smaller apparent fluctuations for the Anton simulation (PSMA) are consistent with the larger number of lipids in that simulation (see Eq. 1). A clear difference in the timescale of area fluctuations between SM lipids and DPPC is observed in the central three panels. Molecular images of the PSM system simulated with CHARMM are shown in Fig. S6; the Anton system was four times larger, expanded twofold in the lateral x and y dimensions. Pairwise comparisons of the electron density z profiles from the SM simulations are shown in Fig. S7, and are consistent with the data given in Table 2. The x-ray form factors are plotted in Fig. S8.
Results from NMR measurements in unoriented bicelles with SSM (19) and the simulated bilayers are in good agreement. Specifically, all three NOEs observed to be strong in the experiment are similarly classified in the simulation (i.e., interproton distances are <3 Å), and both simulation and experiment indicate that the dihedrals associated with the J-couplings from H2:H3, H2:HN are trans. Some disagreement is evident for the dihedral associated with H3:H4; the inferred value from experiment is trans, although the simulation indicates approximately equal populations at +30° and 180°. Nevertheless, the experimental (7.7 Hz) and simulated (7.3–7.4 Hz) J-couplings are reasonably close, so the preceding discrepancy can be considered minor.
Fig. 4 compares measured and simulated SCD for the saturated N-linked 16 carbon chain of PSM, for an experiment (7) at 48°C and for both CHARMM and Anton simulations at the same temperature. The slightly lower SCD values from the Anton simulation are consistent with the slightly larger area/lipid (Table 2) and slightly thinner bilayer (Table 2, Fig. S7). Note that the horizontal axis in Fig. 4 is not the chain position; the simulation data have been sorted by value, identical to how the NMR data from fully labeled chain experiments is treated. The top panel of Fig. S9 shows the discrepancy between the simulation results based on chain position and the NMR assignments based on the assumption of monotonically decreasing SCD. The agreement of the three different PSM-d31 (7–9) experiments at 40 and 48°C in the bottom panel of Fig. S9 is surprising because 40°C is close to the NMR estimate of 38°C for the melting temperature of the gel-to-liquid crystal transition of perdeuterated PSM (7).
Figure 4.
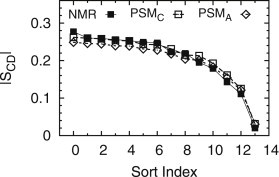
Value sorted C-D order parameters (SCD) from an NMR experiment on PSM (solid squares) with a perdeuterated N-linked chain (7) compared to those from CHARMM (open squares, PSMC) and Anton (open diamonds, PSMA) simulations.
More recently published NMR measurements (20) on selectively deuterated SSM at both 45 and 50°C are compared to SCD from the corresponding simulations in Fig. 5. It should be noted that temperature-based differences were observed in this case, unlike the PSM measurements; the SSM experiments were from the same lab, whereas the PSM studies were from three different labs. Both chains were selectively labeled, including C5 of the double bond in the sphingosine chain, allowing direct comparisons as a function of chain position. The apparent discrepancies in several regions of the molecule will be discussed below.
Figure 5.
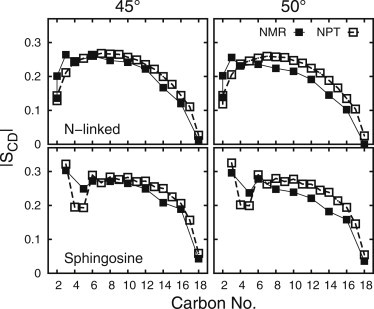
SCD from NPT simulations (open squares) compared to NMR (solid squares) of selectively labeled SSM vesicles at 45°C and at 50°C.
Hydrogen bonding and dynamics
Table 3 lists the dominant H-bonds and their probabilities observed in the simulations. There are two important motifs, neither of which exists in glycerophospholipids. In the first, the OH group at C3 is nearly always (99%) involved in an intramolecular H-bond to a phosphate O atom, with the dominant H-bond forming a stable six-membered ring. Second, the amide NH forms intermolecular H-bonds to amide carbonyl or hydroxyl O atoms ∼50% of the time. Fig. 6 shows the H-bond patterns, with a close-up view of an internal H-bond in the bottom panel. Strings of NH associated interlipid hydrogen bonds are evident in this and the top panel of Fig. 6. The pairs for the observed interlipid H-bonds with an occupancy above 0.1% from the PSM simulation are shown in Fig. S10, and a movie (Movie S1) highlighting the strings is provided in the Supporting Material. The amide and hydroxyl groups also interact with water (bottom rows of Table 3), therefore are involved in hydrogen bonds most of the time.
Table 3.
Intra- and intermolecular H-bond probabilitiesa
| H-bond | PSM | CHARMM |
Anton |
|
|---|---|---|---|---|
| SSM 45° | SSM 50° | PSM | ||
| Intramolecular | ||||
| O-H:::O-P | 0.99 | 0.99 | 0.99 | 0.98 |
| O-H:::O=P | 0.01 | 0.01 | 0.01 | 0.01 |
| Lipid:lipid | ||||
| N-H:::O=P | 0.02 (0.002) | 0.03 (0.002) | 0.02 (0.002) | 0.02 (0.03) |
| N-H:::O=C | 0.28 (0.01) | 0.29 (0.01) | 0.27 (0.01) | 0.26 (0.01) |
| N-H:::O-C | 0.18 (0.004) | 0.19 (0.007) | 0.19 (0.01) | 0.17 (0.01) |
| Lipid:water | ||||
| N-H:::OH2 | 0.36 (0.01) | 0.35 (0.01) | 0.36 (0.01) | 0.37 (0.002) |
| HOH:::O=C | 1.00 (0.02) | 0.97 (0.02) | 1.00 (0.01) | 1.04 (0.007) |
| HOH:::O-C | 0.65 (0.01) | 0.65 (0.01) | 0.66 (0.01) | 0.69 (0.003) |
Standard errors from block averages are given in parentheses for the intermolecular H-bonds; standard errors are <0.001 for the intramolecular cases. Not all totals sum to 1 because of the distance cutoff in the assignment in H-bonds. Conversely, others sum to >1 because an acceptor can H-bond with more than one water molecule.
Figure 6.
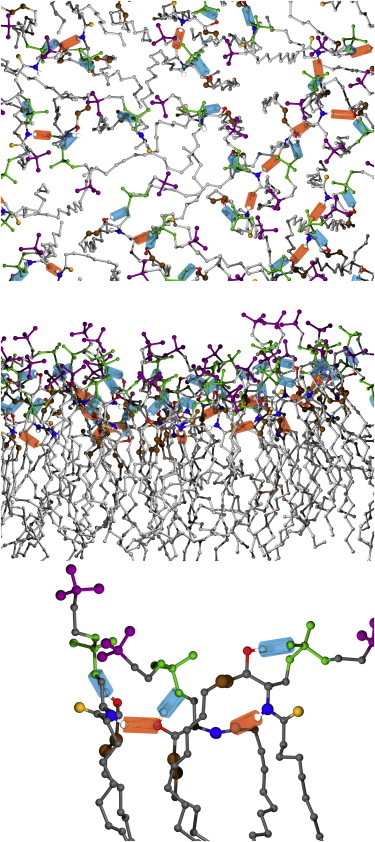
Molecular image snapshot of the upper leaflet from two viewpoints (top, middle) at ∼200 ns showing intermolecular (orange) and intramolecular (cyan) H-bonds, with a close-up view of typical PSM H-bonds in the bottom panel. Atom colors: (CH3)3N, purple; PO4, green; amide N, blue; amide O, orange; hydroxyl O, red; C=C, brown; all other C atoms, gray. To see this figure in color, go online.
The remainder of this subsection concerns the dynamics of hydrogen bonding and lipid reorientation, and a comparison with DPPC. Estimating the lifetimes of H-bonds from simulations is difficult because the distances or energies used to specify the bond frequently flicker over the arguably somewhat heuristic boundaries (or dividing surfaces). The solution to the problem for two-state processes (e.g., isomerization between states A and B) is to evaluate the number correlation function (54,55) CN(t) = 〈NA(0)NA(t)〉, where NA = if the system is in state A, and 0 otherwise. The decay of CN (t) will contain a very short time component associated with flicker over the dividing surface that can be ignored, and a longer decay, which can be simply related to the forward and backward rate constants. Because there are multiple rate constants associated with hydrogen bond formation and breakage, the number correlation must be used in a more qualitative manner. Fig. 7 (left) plots CN(t) for the amide and hydroxyl oxygen hydrogen bonds. As anticipated, they are not well described as single exponentials, though a three exponential decay (Fig. S11) provides an excellent fit; Table 4 lists fit coefficients for this and most of the other correlation functions presented in this subsection. The longest decay times are 51 ns for H:::O=C and 31 ns for H:::O-C. These long decay times are evident in Movie S1. The number correlation functions for hydrogen bonds to water for the preceding groups (Fig. S12) show much faster decays; i.e., the slow relaxation times are in the range of 200–400 ps (Table S2). The decay times for the water-hydroxyl oxygen of PSM are very similar to those of the water-ester oxygen of DPPC.
Figure 7.
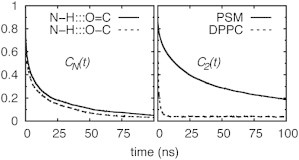
Normalized number correlation functions CN(t) for interlipid hydrogen bonds of PSM (left), and second rank reorientational correlation functions C2(t) of C-H bond vectors of the central glycerol carbon in DPPC and the amide carbon in PSM (right).
Table 4.
Fit coefficients (ai) and relaxation times (τi, ns) from three exponential fits to selected reorientational and number correlation functions, including those plotted in Fig. 7
| Decay | a1 | τ1 | a2 | τ2 | a3 | τ3 | plateaua | |
|---|---|---|---|---|---|---|---|---|
| DPPC C2(t) | P-Ogly | 0.356 | 0.011 | 0.338 | 0.170 | 0.116 | 1.397 | 0.190 |
| P-Oα | 0.346 | 0.010 | 0.436 | 0.126 | 0.181 | 0.713 | 0.037 | |
| C2-H | 0.237 | 0.016 | 0.379 | 0.289 | 0.344 | 1.557 | 0.039 | |
| PSM C2(t) | P-Ogly | 0.354 | 0.139 | 0.197 | 7.163 | 0.226 | 94.86 | 0.222 |
| P-Oα | 0.579 | 0.146 | 0.276 | 4.741 | 0.091 | 54.37 | 0.053 | |
| C2-H | 0.276 | 0.559 | 0.384 | 20.41 | 0.219 | 93.62 | 0.120 | |
| PSM CN(t) | N-H:::O=C | 0.384 | 0.212 | 0.336 | 5.816 | 0.270 | 51.44 | 0.010 |
| N-H:::O-C | 0.379 | 0.071 | 0.302 | 3.016 | 0.308 | 31.34 | 0.012 | |
For C2(t), the plateaus were computed as (3z2-1)/2 from the unit vector time series; plateaus for CN(t) were free parameters in the exponential fit. For the fitting, the constraint a1 + a2 + a3 + plateau = 1.0 was enforced.
It might be anticipated that the long-lived interlipid H-bonds in PSM would retard its rotational diffusion relative to DPPC, which has no analogous interactions. This can be assessed by the second rank reorientational correlation function , where is the unit vector of a particular bond. Fig. 7 (right) plots the results for a CH bond in comparable branch points in both lipids: the central glycerol carbon in DPPC and the amide carbon in PSM, here denoted C2-H. These correlation functions and those of two other similar bond vectors are well fit by three exponentials and a plateau (Fig. S13 and Table 4). The 1.6 ns slow relaxation time (τ3) for C2-H of DPPC is the well-known decay associated with lipid wobble (56) and leads to excellent agreement with frequency-dependent NMR 13C T1 relaxation times (21). The slow decay time for C2-H in PSM is 94 ns. Similar results are obtained for the P-O vectors to the glycerol (P-Ogly in Table 4); τ3 for the P-O vector to the choline (P-Oα) is approximately half that of the preceding vectors, but the ratio of DPPC to PSM is comparable.
Lateral pressure profiles and spontaneous curvature
Fig. 8 plots the lateral pressure profiles for PSM, DPPC, and DOPE. All three lipids show the characteristic positive pressure peak in the bilayer center, but substantial differences closer to the surface. Table 5 lists the ranges of , the monolayer bending constant (see Methods), , the derivative of the deformation free energy (evaluated from the first moment of the pressure profile), c0, the spontaneous curvature (obtained from the preceding two quantities), and R0, the radius of spontaneous curvature (the inverse of c0). (See Fig. S14 and associated discussion for more details on the evaluation of .) The most striking result of this calculation is that, with high statistical certainty, is negative for bilayers of pure PSM and therefore R0 is positive. As explained in the Methods, given the uncertainty in experimental bending constants, a plausible range of was chosen for evaluation of spontaneous curvature. The smaller bending constant for PSM yields R0 close to that of the lysolipid O-lysoPC, where R0 = 38 Å (57); the higher bending constant yields R0 comparable in absolute value but opposite in sign to DOPC, where R0 = −87.3 Å (47). is near zero for DPPC, indicating a very large R0; i.e., almost no curvature propensity. The values of R0 for DOPE bracket the experimental value, −29 Å (47), and our previously published simulation result, −32.3 ± 1.4 Å (40), both of which were obtained at room temperature.
Figure 8.
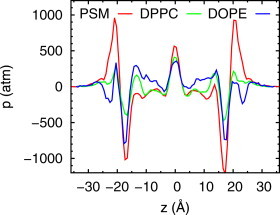
Bilayer lateral pressure profiles for PSM (red), DPPC (green), and DOPE (blue). Caution must be applied when trying to interpret the local variation of the pressure tensors (see Discussion in text), the profiles are plotted to highlight the differences for PSM and DOPE, and contrast them with DPPC. To see this figure in color, go online.
Discussion
As noted in the Introduction, the paucity of reliable target data have limited previous efforts to develop parameters for SM lipids. A number of recent NMR studies (7–9) on PSM-d31 have provided SCD data that can be used to assess the area/lipid; to the best of our knowledge, only the recently published extension of the Slipids parameters (17) used this PSM data as an optimization target. Very recently, NMR studies of the SSM headgroup conformation (19), and on selectively deuterated SSM (20) were published and provided additional target data for the parameters reported here, especially the SCD from the latter study.
Preliminary screening of candidate parameter sets used SCD for the palmitate chain of PSM (7), in conjunction with area/lipid from the simulations. Initial trials had a common failure mode: collapse of the area/lipid resulting in more ordered chains, with SCD that were significantly higher than experiment. Although this occurred fairly quickly in some cases, within <30 ns, in other cases the collapse did not occur until over 100 ns of MD simulation. To obtain an estimate of the target area/lipid, a series of NPAT simulations of PSM were performed with the area/lipid constrained to 48, 52, 56, and 60 Å2; palmitate chain SCD values were closest to NMR experiment for the 56 Å2 area simulation. The estimate of area/lipid from the x-ray study of Maulik and Shipley (5) is considerably smaller, which has been attributed to assumptions made about the molecular volume (6,13).
During this study the two NMR works from the Murata research group were published (19,20). New simulations of SSM at 45 and 50°C were added to the validation suite, and led to adjustment of the dihedral centered about the sphingosine C3-C4 bond (denoted as t2 in the QM CER4 model compound). The simulation properties were sensitive to small adjustments of the minimum at ∼90°; attempts to improve agreement for the SCD at C5 and the J-coupling for the H3-C3-C4-H4 torsion tended to raise the SCD values in the plateau region (C6-C10) of both chains. In addition to the vinyl C5, the most noticeable discrepancy between simulation and the selective labeling experiment (20) observed in Fig. 5 is the splitting for the two protons on C2 of the N-linked chain. Presently, we do not have a readily apparent cause or solution for this disagreement, although sampling issues related to the dihedrals through the C2S-NF bond (e.g., t4 in Figs. 2 and 3, θ6 in Fig. S15 and Fig. S16) will be investigated in future studies. The slightly higher SCD for the middle and lower regions of the chains are less of an issue; due to the large difference in timescale between the experimental measurement and the simulation, some additional relaxation is expected in the experiment, leading to lower values.
The Anton simulations of PSM yielded comparable results to the CHARMM simulations but with a slightly larger area/lipid, most likely due to small differences in the treatments of the L-J truncation. Consistent with the larger area, both dP-P and SCD were slightly smaller. Other metrics such as dihedral probability profiles (see Fig. S15 and Fig. S16), H-bonding, and headgroup interproton distances were essentially identical for both CHARMM and Anton simulations. There were, however, some temperature stability issues when simulations of SSM were attempted with Anton; in every instance, precipitous drops in both temperature and were observed, which appeared to be correlated (Fig. S17). The slightly higher gel-to-fluid phase transition T for SSM, with the longer N-linked chain, and the molecular thermostat algorithm used by Anton likely played a role in this problem.
A major distinction between SM and most glycerol-based lipids is the ability to form strong intra- and intermolecular H-bonds, as noted by early NMR experiments (58). As shown in Table 3 and illustrated in Fig. 6, a persistent H-bond is observed in the sphingosine fragment between the OH group at C3 and the O atom linking the PO4 group to C1. The intermolecular hydrogen bonds are also long-lived, with number correlation functions of N-H:::O=C and N-H:::O-C exhibiting slow decay times of 51 and 31 ns, respectively (Fig. 7 and Table 4). The observed intramolecular H-bond probabilities reported in Table 3 are somewhat higher than those reported in PSM simulations with the GROMOS (12,22) and SSM simulations with the OPLS (14) force fields, which range from 0.6 to 0.9, and are close to 0.5, respectively. However, the apparent headgroup rigidity implied by the J-coupling and NOE measurements on SSM bicelles (19) is consistent with the higher values reported here and the 0.9 value reported by Niemelä, et al (12). The intermolecular H-bond probabilities are in better agreement for the various SM force fields, with the GROMOS results fairly comparable to those reported in Table 3, and the OPLS results a bit lower; the latter was run at a higher temperature.
The strong hydrogen bonding lends both internal rigidity and intermolecular order to SM. Both of these features are reflected in a 50- to 100-fold increase in the decay constants of the reorientational correlation functions of selected bond vectors compared to DPPC (Table 4). In further contrast to DPPC, where modeling the reorientation as fast internal motion and wobble in a cone with diffusion constants D∥ and D⊥ is readily accomplished (56,59), fits to the correlation functions of PSM led to high residuals and were often unstable. A more general model may be necessary to describe reorientation for pure bilayers of this lipid. Nevertheless, the longer decay times should be evident experimentally, in, for example 13C or 31P T1 measurements.
Turning to curvature, from the negative sign of , the simulations indicate that PSM prefers positively curved surfaces. This is not the norm for neutral two-tailed lipids, which show varying degrees of negative spontaneous curvature. Positive curvature is observed both for lysolipids (57) and for lipids with charged headgroups (60). The former is an example of the large head/small tail mismatch that intuitively implies positive curvature. Continuum elastic modeling and MD simulation does in fact support this notion (61); i.e., that the positive curvature of lysolipids is reasonably described as arising from steric factors. In contrast, positive curvature for charged lipids is not well explained by steric factors. Rather, repulsive interactions among headgroups lead to stresses above the pivotal plane that can be reduced by forming a bulge, or positively curved surface. Sphingomyelin generates positive curvature in a third way. The pressure profile (Fig. 7) gives hints as to what interactions are responsible for the value of . For example, the very strong negative pressure below the headgroups acting to compress the leaflet laterally could be due to strong hydrogen bonding between PSM lipids. DOPE also has interlipid hydrogen bonding but prefers negative curvature; the fact that PSM-PSM hydrogen bonding is closer to the bilayer midplane would tend to favor positive curvature. That stated, the bilayer is a complex balance of stresses; if one interaction is enhanced (hydrogen bonding at the surface reducing the surface area), the other interactions must respond to maintain zero tension (headgroup-headgroup repulsion and confinement of disordered acyl chains).
The general tendency of lipids to prefer negatively curved surfaces at higher temperature has been explained in terms of the increased positive pressure of the disordered acyl chains with temperature (62). As suggested by the pressure profile the tensions near the PSM headgroup region appear to be much stronger, confining the chains (reflected in the PSM order parameters and area per lipid) and perhaps reducing the negative curvature inducing effect of disordered tails. Increased order could lead to greatly increased pressure peaks even without increased curvature stress or a larger bending constant; disorder tends to smooth out rapid oscillations in the profile. However, larger stresses would also be consistent with a larger bending modulus, for example, as seen in the pressure profile of lipid bilayer gels (63).
The preceding analysis relies on a pointwise interpretation of the pressure profile that would only be rigorous if the forces of the potential were contact forces, such that energetics of a local deformation of a leaflet could in turn be defined pointwise. Yet the forces of the CHARMM potential can span nanometers. The value of suffers from no such ambiguity. The estimate of from of PSM in this work assumes a that is similar to glycerophospholipids; if the stiffness is larger than assumed, R0 will be scaled up accordingly. Nevertheless, the sign (positive) of the curvature is not affected by the value of .
Conclusions
The SM parameters presented here are an extension of the C36 lipid force field, and are thereby compatible with the other additive C36 CHARMM force fields. Though validated with palmitoyl and stearoyl N-linked chains, based on past experience, SM with other N-linked fatty acids can be simulated with minimal testing. Extensions to gangliosides (substitution of assorted sugar moieties for the phosphocholine) and ceramides (removal of the phosphocholine) are expected to be straightforward but would require further validation.
Strong and long-lived intra- and interlipid hydrogen bonds confer rigidity to both the lipid and the bilayer. Reorientational relaxation is qualitatively slower than evaluated for DPPC.
The positive radius of spontaneous curvature of 43–100 Å calculated for pure PSM bilayers differs from the negative curvature of other neutral two-tailed lipids. A more precise estimate of the curvature awaits a more precise determination of the monolayer bending constant. This unusual positive curvature is likely associated with PSM-PSM hydrogen bond networks involving the NH of the sphingosine group, and would therefore not be anticipated when PSM is in low concentration. Hydrogen bonding involving the NH group and other membrane components including cholesterol, proteins, and peptides is possible, highlighting the versatility of this lipid and its potential ability to modulate phase behavior of cell membranes.
Acknowledgments
This research was supported by the Intramural Research Program of the National Institutes of Health (NIH), National Heart, Lung and Blood Institute (to R.W.P., R.M.V., A.J.S., and B.R.), institutional support from the University of Maryland (to B.R.), National Science Foundation (DBI-1145652 and MCB-1149187) to J.B.K. and by NIH GM070855 and GM072558 to A.D.M. The computational research was performed in part with Anton computer time, which was provided by the National Center for Multiscale Modeling of Biological Systems (MMBioS) through grant P41GM103712-S1 from the NIH and the Pittsburgh Supercomputing Center (PSC) under grant No. PSCA12035P. The Anton machine at PSC was generously made available by D. E. Shaw Research (33). Additional computational time was used on the High Performance Computing Cluster at the University of Maryland and also used the high-performance computational capabilities at the National Institutes of Health, Bethesda, MD (NHLBI LoBoS cluster).
Contributor Information
Alexander D. MacKerell, Jr., Email: alex@outerbanks.umaryland.edu.
Richard W. Pastor, Email: pastorr@nhlbi.nih.gov.
Jeffery B. Klauda, Email: jbklauda@umd.edu.
Supporting Material
References
- 1.van Meer G., Voelker D.R., Feigenson G.W. Membrane lipids: where they are and how they behave. Nat. Rev. Mol. Cell Biol. 2008;9:112–124. doi: 10.1038/nrm2330. [DOI] [PMC free article] [PubMed] [Google Scholar]
- 2.Hannich J.T., Umebayashi K., Riezman H. Distribution and functions of sterols and sphingolipids. Cold Spring Harb. Perspect. Biol. 2011;3:a004762. doi: 10.1101/cshperspect.a004762. [DOI] [PMC free article] [PubMed] [Google Scholar]
- 3.Futerman A.H., Hannun Y.A. The complex life of simple sphingolipids. EMBO Rep. 2004;5:777–782. doi: 10.1038/sj.embor.7400208. [DOI] [PMC free article] [PubMed] [Google Scholar]
- 4.Maulik P.R., Atkinson D., Shipley G.G. X-ray scattering of vesicles of N-acyl sphingomyelins. Determination of bilayer thickness. Biophys. J. 1986;50:1071–1077. doi: 10.1016/S0006-3495(86)83551-2. [DOI] [PMC free article] [PubMed] [Google Scholar]
- 5.Maulik P.R., Shipley G.G. N-palmitoyl sphingomyelin bilayers: structure and interactions with cholesterol and dipalmitoylphosphatidylcholine. Biochemistry. 1996;35:8025–8034. doi: 10.1021/bi9528356. [DOI] [PubMed] [Google Scholar]
- 6.Nagle J.F., Tristram-Nagle S. Structure of lipid bilayers. Biochim. Biophys. Acta. 2000;1469:159–195. doi: 10.1016/s0304-4157(00)00016-2. [DOI] [PMC free article] [PubMed] [Google Scholar]
- 7.Mehnert T., Jacob K., Beyer K. Structure and lipid interaction of N-palmitoylsphingomyelin in bilayer membranes as revealed by 2H-NMR spectroscopy. Biophys. J. 2006;90:939–946. doi: 10.1529/biophysj.105.063271. [DOI] [PMC free article] [PubMed] [Google Scholar]
- 8.Bunge A., Müller P., Huster D. Characterization of the ternary mixture of sphingomyelin, POPC, and cholesterol: support for an inhomogeneous lipid distribution at high temperatures. Biophys. J. 2008;94:2680–2690. doi: 10.1529/biophysj.107.112904. [DOI] [PMC free article] [PubMed] [Google Scholar]
- 9.Bartels T., Lankalapalli R.S., Brown M.F. Raftlike mixtures of sphingomyelin and cholesterol investigated by solid-state 2H NMR spectroscopy. J. Am. Chem. Soc. 2008;130:14521–14532. doi: 10.1021/ja801789t. [DOI] [PMC free article] [PubMed] [Google Scholar]
- 10.Seelig A., Seelig J. The dynamic structure of fatty acyl chains in a phospholipid bilayer measured by deuterium magnetic resonance. Biochemistry. 1974;13:4839–4845. doi: 10.1021/bi00720a024. [DOI] [PubMed] [Google Scholar]
- 11.Lopez C.A., Sovova Z., Marrink S.J. Martini force field parameters for glycolipids. J. Chem. Theory Comput. 2013;9:1694–1708. doi: 10.1021/ct3009655. [DOI] [PubMed] [Google Scholar]
- 12.Niemelä P., Hyvönen M.T., Vattulainen I. Structure and dynamics of sphingomyelin bilayer: insight gained through systematic comparison to phosphatidylcholine. Biophys. J. 2004;87:2976–2989. doi: 10.1529/biophysj.104.048702. [DOI] [PMC free article] [PubMed] [Google Scholar]
- 13.Chiu S.W., Vasudevan S., Scott H.L. Structure of sphingomyelin bilayers: a simulation study. Biophys. J. 2003;85:3624–3635. doi: 10.1016/S0006-3495(03)74780-8. [DOI] [PMC free article] [PubMed] [Google Scholar]
- 14.Róg T., Pasenkiewicz-Gierula M. Cholesterol-sphingomyelin interactions: a molecular dynamics simulation study. Biophys. J. 2006;91:3756–3767. doi: 10.1529/biophysj.106.080887. [DOI] [PMC free article] [PubMed] [Google Scholar]
- 15.Hyvonen M.T., Kovanen P.T. Molecular dynamics simulation of sphingomyelin bilayer. J. Phys. Chem. B. 2003;107:9102–9108. [Google Scholar]
- 16.Zidar J., Merzel F., Janezic D. Liquid-ordered phase formation in cholesterol/sphingomyelin bilayers: all-atom molecular dynamics simulations. J. Phys. Chem. B. 2009;113:15795–15802. doi: 10.1021/jp907138h. [DOI] [PubMed] [Google Scholar]
- 17.Jämbeck J.P.M., Lyubartsev A.P. Another piece of the membrane puzzle: extending Slipids further. J. Chem. Theory Comput. 2013;9:774–784. doi: 10.1021/ct300777p. [DOI] [PubMed] [Google Scholar]
- 18.Feller S.E., Venable R.M., Pastor R.W. Computer simulation of a DPPC phospholipid bilayer: structural changes as a function of molecular surface area. Langmuir. 1997;13:6555–6561. [Google Scholar]
- 19.Yamaguchi T., Suzuki T., Murata M. NMR-based conformational analysis of sphingomyelin in bicelles. Bioorg. Med. Chem. 2012;20:270–278. doi: 10.1016/j.bmc.2011.11.001. [DOI] [PubMed] [Google Scholar]
- 20.Matsumori N., Yasuda T., Murata M. Comprehensive molecular motion capture for sphingomyelin by site-specific deuterium labeling. Biochemistry. 2012;51:8363–8370. doi: 10.1021/bi3009399. [DOI] [PubMed] [Google Scholar]
- 21.Klauda J.B., Venable R.M., Pastor R.W. Update of the CHARMM all-atom additive force field for lipids: validation on six lipid types. J. Phys. Chem. B. 2010;114:7830–7843. doi: 10.1021/jp101759q. [DOI] [PMC free article] [PubMed] [Google Scholar]
- 22.Metcalf R., Pandit S.A. Mixing properties of sphingomyelin ceramide bilayers: a simulation study. J. Phys. Chem. B. 2012;116:4500–4509. doi: 10.1021/jp212325e. [DOI] [PMC free article] [PubMed] [Google Scholar]
- 23.Frisch M.J., Trucks G.W., Pople J.A. Gaussian; Pittsburgh, PA: 2003. Gaussian 03. [Google Scholar]
- 24.Best R.B., Zhu X., Mackerell A.D., Jr. Optimization of the additive CHARMM all-atom protein force field targeting improved sampling of the backbone φ, ψ and side-chain χ(1) and χ(2) dihedral angles. J. Chem. Theory Comput. 2012;8:3257–3273. doi: 10.1021/ct300400x. [DOI] [PMC free article] [PubMed] [Google Scholar]
- 25.Klauda J.B., Garrison S.L., Sandler S.I. HM-IE: quantum chemical hybrid methods for calculating interaction energies. J. Phys. Chem. A. 2004;108:107–112. [Google Scholar]
- 26.Guvench O., MacKerell A.D., Jr. Automated conformational energy fitting for force-field development. J. Mol. Model. 2008;14:667–679. doi: 10.1007/s00894-008-0305-0. [DOI] [PMC free article] [PubMed] [Google Scholar]
- 27.Breneman C.M., Wiberg K.B. Determining atom-centered monopoles from molecular electrostatic potentials. The need for high sampling density in formamide conformational analysis. J. Comput. Chem. 1990;11:361–373. [Google Scholar]
- 28.Brooks B.R., Brooks C.L., 3rd, Karplus M. CHARMM: the biomolecular simulation program. J. Comput. Chem. 2009;30:1545–1614. doi: 10.1002/jcc.21287. [DOI] [PMC free article] [PubMed] [Google Scholar]
- 29.Hynninen A.-P., Crowley M.F. New faster CHARMM molecular dynamics engine. J. Comput. Chem. 2014;35:406–413. doi: 10.1002/jcc.23501. [DOI] [PMC free article] [PubMed] [Google Scholar]
- 30.Darden T., York D., Pedersen L. Particle mesh Ewald - an NLog(N) method for Ewald sums in large systems. J. Chem. Phys. 1993;98:10089–10092. [Google Scholar]
- 31.Zhang Y.H., Feller S.E., Pastor R.W. Computer-simulation of liquid/liquid interfaces. I. Theory and application to octane/water. J. Chem. Phys. 1995;103:10252–10266. [Google Scholar]
- 32.Harder E., Anisimov V.M., Roux B. Understanding the dielectric properties of liquid amides from a polarizable force field. J. Phys. Chem. B. 2008;112:3509–3521. doi: 10.1021/jp709729d. [DOI] [PMC free article] [PubMed] [Google Scholar]
- 33.Shaw D.E., Deneroff M.M., Wang S.C. Anton, a special-purpose machine for molecular dynamics simulation. Commun. ACM. 2008;51:91–97. [Google Scholar]
- 34.Martyna G.J., Klein M.L., Tuckerman M. Nose-Hoover chains - the canonical ensemble via continuous dynamics. J. Chem. Phys. 1992;97:2635–2643. [Google Scholar]
- 35.Hoover W.G. Canonical dynamics: equilibrium phase-space distributions. Phys. Rev. A. 1985;31:1695–1697. doi: 10.1103/physreva.31.1695. [DOI] [PubMed] [Google Scholar]
- 36.Krautler V., Van Gunsteren W.F., Hunenberger P.H. A fast SHAKE: algorithm to solve distance constraint equations for small molecules in molecular dynamics simulations. J. Comput. Chem. 2001;22:501–508. [Google Scholar]
- 37.Shan Y., Klepeis J.L., Shaw D.E. Gaussian split Ewald: a fast Ewald mesh method for molecular simulation. J. Chem. Phys. 2005;122:54101. doi: 10.1063/1.1839571. [DOI] [PubMed] [Google Scholar]
- 38.Tuckerman M., Berne B.J., Martyna G.J. Reversible multiple time scale molecular-dynamics. J. Chem. Phys. 1992;97:1990–2001. [Google Scholar]
- 39.Helfrich W. Elastic properties of lipid bilayers: theory and possible experiments. Z. Naturforsch. C. 1973;28:693–703. doi: 10.1515/znc-1973-11-1209. [DOI] [PubMed] [Google Scholar]
- 40.Sodt A.J., Pastor R.W. Bending free energy from simulation: correspondence of planar and inverse hexagonal lipid phases. Biophys. J. 2013;104:2202–2211. doi: 10.1016/j.bpj.2013.03.048. [DOI] [PMC free article] [PubMed] [Google Scholar]
- 41.Marsh D. Elastic curvature constants of lipid monolayers and bilayers. Chem. Phys. Lipids. 2006;144:146–159. doi: 10.1016/j.chemphyslip.2006.08.004. [DOI] [PubMed] [Google Scholar]
- 42.Nagle J.F. Introductory lecture: basic quantities in model biomembranes. Faraday Discuss. 2013;161:11–29. doi: 10.1039/c2fd20121f. discussion 113–150. [DOI] [PMC free article] [PubMed] [Google Scholar]
- 43.Evans E., Rawicz W., Smith B.A. Back to the future: mechanics and thermodynamics of lipid biomembranes. Faraday Discuss. 2013;161:591–611. doi: 10.1039/c2fd20127e. [DOI] [PubMed] [Google Scholar]
- 44.Fernandezpuente L., Bivas I., Meleard P. Temperature and chain-length effects onbending elasticity of phosphatidylcholine bilayers. Europhys. Lett. 1994;28:181–186. [Google Scholar]
- 45.Guler S.D., Ghosh D.D., Tristram-Nagle S. Effects of ether vs. ester linkage on lipid bilayer structure and water permeability. Chem. Phys. Lipids. 2009;160:33–44. doi: 10.1016/j.chemphyslip.2009.04.003. [DOI] [PMC free article] [PubMed] [Google Scholar]
- 46.Rawicz W., Olbrich K.C., Evans E. Effect of chain length and unsaturation on elasticity of lipid bilayers. Biophys. J. 2000;79:328–339. doi: 10.1016/S0006-3495(00)76295-3. [DOI] [PMC free article] [PubMed] [Google Scholar]
- 47.Chen Z., Rand R.P. The influence of cholesterol on phospholipid membrane curvature and bending elasticity. Biophys. J. 1997;73:267–276. doi: 10.1016/S0006-3495(97)78067-6. [DOI] [PMC free article] [PubMed] [Google Scholar]
- 48.Klauda J.B., Venable R.M., Pastor R.W. Considerations for lipid force field development. In: Feller S.E., editor. Current Topics in Membranes: Computer Modeling of Membrane Bilayers. Elsevier; Amsterdam: 2008. pp. 1–48. [Google Scholar]
- 49.MacKerell A.D., Jr., Bashford D., Karplus M. All-atom empirical potential for molecular modeling and dynamics studies of proteins. J. Phys. Chem. B. 1998;102:3586–3616. doi: 10.1021/jp973084f. [DOI] [PubMed] [Google Scholar]
- 50.Denning E.J., Priyakumar U.D., Mackerell A.D., Jr. Impact of 2′-hydroxyl sampling on the conformational properties of RNA: update of the CHARMM all-atom additive force field for RNA. J. Comput. Chem. 2011;32:1929–1943. doi: 10.1002/jcc.21777. [DOI] [PMC free article] [PubMed] [Google Scholar]
- 51.Klauda, J. B. 2014. Free Programs, Molecular Coordinates, & Files. Univ. of Maryland. http://terpconnect.umd.edu/∼jbklauda/research/download.html. Accessed February, 2014.
- 52.Ding Y., Bernardo D.N., Levy R.M. Solvation free energies of small amides and amines from molecular dynamics/free energy perturbation simulations using pairwise additive and many-body polarizable potentials. J. Phys. Chem. 1995;99:11575–11583. [Google Scholar]
- 53.Wolfenden R. Interaction of the peptide bond with solvent water: a vapor phase analysis. Biochemistry. 1978;17:201–204. doi: 10.1021/bi00594a030. [DOI] [PubMed] [Google Scholar]
- 54.Chandler D. Statistical-mechanics of isomerization dynamics in liquids and transition-state approximation. J. Chem. Phys. 1978;68:2959–2970. [Google Scholar]
- 55.Loncharich R.J., Brooks B.R., Pastor R.W. Langevin dynamics of peptides: the frictional dependence of isomerization rates of N-acetylalanyl-N′-methylamide. Biopolymers. 1992;32:523–535. doi: 10.1002/bip.360320508. [DOI] [PubMed] [Google Scholar]
- 56.Klauda J.B., Eldho N.V., Pastor R.W. Collective and noncollective models of NMR relaxation in lipid vesicles and multilayers. J. Phys. Chem. B. 2008;112:5924–5929. doi: 10.1021/jp075641w. [DOI] [PubMed] [Google Scholar]
- 57.Fuller N., Rand R.P. The influence of lysolipids on the spontaneous curvature and bending elasticity of phospholipid membranes. Biophys. J. 2001;81:243–254. doi: 10.1016/S0006-3495(01)75695-0. [DOI] [PMC free article] [PubMed] [Google Scholar]
- 58.Schmidt C.F., Barenholz Y., Thompson T.E. A nuclear magnetic resonance study of sphingomyelin in bilayer systems. Biochemistry. 1977;16:2649–2656. doi: 10.1021/bi00631a011. [DOI] [PubMed] [Google Scholar]
- 59.Klauda J.B., Roberts M.F., Pastor R.W. Rotation of lipids in membranes: molecular dynamics simulation, 31P spin-lattice relaxation, and rigid-body dynamics. Biophys. J. 2008;94:3074–3083. doi: 10.1529/biophysj.107.121806. [DOI] [PMC free article] [PubMed] [Google Scholar]
- 60.Fuller N., Benatti C.R., Rand R.P. Curvature and bending constants for phosphatidylserine-containing membranes. Biophys. J. 2003;85:1667–1674. doi: 10.1016/s0006-3495(03)74596-2. [DOI] [PMC free article] [PubMed] [Google Scholar]
- 61.Sodt A.J., Pastor R.W. Molecular modeling of lipid membrane curvature induction by a Peptide: more than simply shape. Biophys. J. 2014;106:1958–1969. doi: 10.1016/j.bpj.2014.02.037. [DOI] [PMC free article] [PubMed] [Google Scholar]
- 62.Lafleur M., Bloom M., Cullis P.R. Correlation between lipid plane curvature and lipid chain order. Biophys. J. 1996;70:2747–2757. doi: 10.1016/S0006-3495(96)79844-2. [DOI] [PMC free article] [PubMed] [Google Scholar]
- 63.Vanegas J.M., Longo M.L., Faller R. Crystalline, ordered and disordered lipid membranes: convergence of stress profiles due to ergosterol. J. Am. Chem. Soc. 2011;133:3720–3723. doi: 10.1021/ja110327r. [DOI] [PubMed] [Google Scholar]
Associated Data
This section collects any data citations, data availability statements, or supplementary materials included in this article.