

Abstract
To globally survey the changes in transcriptional landscape during terminal erythroid differentiation, we performed RNA sequencing (RNA-seq) on primary human CD34+ cells after ex vivo differentiation from the earliest into the most mature erythroid cell stages. This analysis identified thousands of novel intergenic and intronic transcripts as well as novel alternative transcript isoforms. After rigorous data filtering, 51 (presumptive) novel protein-coding transcripts, 5326 long and 679 small non-coding RNA candidates remained. The analysis also revealed two clear transcriptional trends during terminal erythroid differentiation: first, the complexity of transcript diversity was predominantly achieved by alternative splicing, and second, splicing junctional diversity diminished during erythroid differentiation. Finally, 404 genes that were not known previously to be differentially expressed in erythroid cells were annotated. Analysis of the most extremely differentially expressed transcripts revealed that these gene products were all closely associated with hematopoietic lineage differentiation. Taken together, this study will serve as a comprehensive platform for future in-depth investigation of human erythroid development that, in turn, may reveal new insights into multiple layers of the transcriptional regulatory hierarchy that controls erythropoiesis.
INTRODUCTION
Erythropoiesis is a dynamic process during which immature hematopoietic cells progressively mature into proerythroblasts, erythroblasts (basophilic, polychromatic and orthochromatic), reticulocytes and erythrocytes. These maturational stages can be recapitulated in ex vivo differentiation cultures that are accompanied by changes in cell morphology (cell size reduction and chromatin condensation, ultimately leading to enucleation) and in transcription (through the differential induction of erythroid-specific genes). Therefore, a comprehensive knowledge of the dynamically changing transcriptome of erythroid cells at different stages of maturation may provide meaningful insights into the transcriptional networks governing erythropoiesis, and this in turn could lead to the identification of novel molecular targets that could be exploited for the treatment of erythroid dysfunction caused by inherited (e.g. sickle cell disease and β-thalassemia) and acquired (e.g. myelodysplasia and aplastic anemia) deficiencies.
Most human erythroid transcriptome studies were previously performed using microarrays (1–6) that are, by design, limited to the detection of known transcripts. The ascendancy of unbiased deep RNA sequencing (RNA-seq) overcomes this limitation by identifying novel transcripts regardless of prior knowledge or genome annotation (7,8). Novel transcripts that can be identified by RNA-seq include novel alternative RNA isoforms of annotated genes (hereafter referred to as ‘novel isoforms’) (7–9) and intergenic and intronic transcripts. The latter are a valuable resource for future investigation of protein-coding and non-coding RNAs (ncRNAs) (10–12). There is increasing evidence that ncRNAs play a more prominent role than previously appreciated in gene regulation (13,14), genomic imprinting (15), cancer metastasis (16), stem cell pluripotency and cellular differentiation (17). RNA-seq methodology has also been reported to measure transcript abundance with superior dynamic range (over five orders of magnitude) (7,18,19) when compared with microarray studies, resulting in significantly improved sensitivity and accuracy in transcriptome analysis [e.g. RNA-seq analyses have been reported to detect up to 25% more expressed genes than do microarrays (20)]. Thus, a greater number of differentially expressed transcripts involved in erythropoiesis might be identified using RNA-seq than have been previously reported from microarray studies.
Alternative transcript isoforms have been reported for >92% of multi-exon human genes (21) and are believed to be a principal driving force for the evolution of the complex transcriptome of mammals. Increased transcript isoform diversity is attained through alternative transcription and alternative splicing. In alternative transcription, distinct pre-mRNAs are generated through both alternative transcriptional initiation and termination (ATI and ATT, respectively), whereas for alternative splicing, one pre-mRNA isoform becomes differentially spliced to produce multiple post-transcriptional RNAs. A previous study reported that alternative transcription exceeded alternative splicing during mouse cerebellar development (22), which was contrary to an even earlier conclusion that alternative splicing occurred more frequently in 15 diverse human tissues and cell lines (21). Further, splicing junctional complexity was found to diminish during neuronal differentiation (23). It is thus currently unclear whether alternative transcription or splicing is the primary contributor to whole transcriptome diversity, and whether or not junctional complexity changes during human erythropoiesis.
In this study, we performed RNA-seq on primary human erythroid cells expanded in differentiation cultures ex vivo from purified CD34+ cells for 4, 8, 11 or 14 days; by the final time point, >85% of the cells expressed high levels of hemoglobin and 25% of the cells had enucleated. We identified and characterized transcripts that were localized in intergenic and intronic regions of previously annotated genes as potential novel protein-coding transcripts and small or long non-coding RNAs during the course of erythroid differentiation. We also compared the frequency of alternative transcription and alternative splicing events during erythropoiesis, and, additionally, analyzed developmentally regulated splicing dynamics. Finally, we identified differentially expressed transcripts between each pairwise differentiation stages and compared all of these results to previous microarray datasets. We suggest that these data may serve as a comprehensive resource for a variety of investigators interested in erythroid cell development.
RESULTS
Induction of human erythroid differentiation ex vivo
Purified human CD34+ hematopoietic progenitor cells were differentiated ex vivo as previously reported (24,25). After 4 days in culture, no hemoglobin was detected in these immature cells by neutral benzidine staining, which monitors hemoglobin synthesis in erythroid cells (Fig. 1A, top panel). By Day 8 in culture, ∼90% of the cells resemble proerythroblasts. By Day 11, the cells were at an intermediate differentiation stage, comprised primarily of basophilic and polychromatic erythroblasts (∼30%). By Day 14, ∼25% of the cells had undergone enucleation, the ultimate hallmark of terminal erythroid maturation. Benzidine-positive cells increased from initially undetectable to typically >85% by Day 14 (Fig. 1A, bottom panel). Additionally, erythroid maturation was also confirmed by flow cytometry (Supplementary Material, Fig. S1). Taken together, these data show that human CD34+ cells underwent almost complete terminal erythroid differentiation during the 14-day culture period.
Figure 1.

Adult β-type globin (HBB) RNA is robustly induced as erythroid cells mature. (A) Primary human erythroid cells differentiated ex vivo from purified CD34+ hematopoietic progenitor cells. Morphological changes and hemoglobin accumulation were examined by Wright-Giemsa (top panels; scale bar: 10 μm) and neutral benzidine (bottom panels; scale bar: 50 μm) staining before (Day 0) and after 4, 8, 11 or 14 days of erythroid differentiation. Enucleated terminally differentiated erythrocytes (arrowhead, top) and the percentages of benzidine-positive cells (bottom) are indicated. (B) As a representative example, shown here is the accumulated RNA-seq reads at the human β-globin locus during erythroid differentiation. The y-axis represents the number of reads mapped to each genomic location and ranges from 0 to 1 336 084 for all differentiation stages. The relative positions of the five genes within the β-globin locus as well as the positions of the DNase I hypersensitive sites (HS) that comprise the locus control region are shown at the bottom.
Generation and quality of RNA-seq data
Cells were harvested after 4, 8, 11 and 14 days of differentiation; RNA-seq was performed on two biological replicates at each stage using a paired-end 72 bp sequencing format on an Illumina Genome Analyzer IIx (Supplementary Material, Table S1). Strong correlation [Pearson's correlation coefficient (r) = 0.97–0.98] was observed between the two biological replicates collected at each stage (Supplementary Material, Fig. S2A). To further verify the accuracy of RNA quantification using RNA-seq, 37 genes expressed during the four differentiation stages were randomly selected for qRT-PCR analysis, and again, a strong correlation (r = 0.946) was observed between the qRT-PCR and RNA-seq assays (Supplementary Material, Fig. S2B). As a representative example, the compilation of reads that mapped to the human β-globin locus illustrated that adult β-globin (HBB) transcript abundance peaked after Day 8, and was far more abundant than any other globin transcript generated from these differentiated adult bone marrow CD34+ cells, as anticipated (Fig. 1B).
Characterization of previously known and novel transcripts
To identify novel transcript isoforms as well as new intergenic and intronic transcripts from the RNA-seq datasets, we performed de novo assembly of the transcripts using TopHat and Cufflinks (26). Of the total transcripts assembled, 32 453 represented new splicing isoforms that could be generated from previously annotated genes, while 9038 appeared to be completely novel (Table 1).
Table 1.
Numbers of known and previously unannotated transcripts identified in primary human erythroid cells
| Transcripts from annotated genes |
Intergenic and intronic transcripts | Total | ||
|---|---|---|---|---|
| Known transcripts | Novel isoforms | |||
| Day 4 | 8704 | 14 993 | 8799 | 32 496 |
| Day 8 | 8608 | 14 316 | 8252 | 31 176 |
| Day 11 | 7986 | 14 283 | 8625 | 30 894 |
| Day 14 | 7668 | 14 154 | 7873 | 29 695 |
| Union | 9876 | 32 453 | 9038 | 51 367 |
To gain insights into the nature and possible functional significance of these transcripts, they were further subdivided by parameters such as transcript length, open reading frame (ORF) length, exon number, phylogenetic conservation score, repeat element content and expression level. Perhaps most significantly, while most known transcripts and novel isoforms (94 and 89%, respectively) generated from all previously annotated genes were longer than 1 kb, the novel transcripts identified here were significantly shorter, with only 30% of intergenic and 32% of intronic transcripts being longer than 1 kb (Fig. 2A and Table 2). One criterion that is commonly used to distinguish protein-coding transcripts from non-coding transcripts is the presence of an ORF longer than 300 nt (27,28). While most of the known transcripts and novel isoforms of previously annotated genes (93–96%) obeyed this criterion, only 32% of intergenic and 23% of intronic transcripts fell into this category (Fig. 2B and Table 2). We surmise that this smaller subset of intergenic and intronic transcripts (with ORFs >300 nt) may have protein-coding potential, whereas the majority of them probably represent non-coding (nc) RNAs. To further support this contention, we found that only 7% of intergenic and 1% of intronic transcripts encoded more than one possible exon, while 94–95% of known transcripts or novel isoforms from annotated genes have multiple exons (Fig. 2C and Table 2). Additionally, as judged by PhastCons conservation score (29), intergenic and intronic transcripts were less well conserved than were the known transcripts and novel isoforms of annotated genes (Fig. 2D and Table 2). Moreover, the average transcript abundance of the novel isoforms and the intergenic and intronic transcripts were generally lower than the previously annotated transcripts (Fig. 2E and Table 2). Finally, although repetitive elements are frequently found in intergenic regions of human genome (30), their content within the novel intergenic and intronic transcript category did not differ significantly from their relative frequency in all previously annotated transcripts (Fig. 2F and Table 2). In summary, the novel intergenic and intronic transcripts identified here generally had shorter transcript and ORF lengths, fewer exons, lower sequence conservation and were of lower abundance than the corresponding known transcripts from previously annotated genes.
Figure 2.

Characterization of transcripts identified by RNA-seq. (A–F) In these histograms four categories of transcripts are presented: (1) known transcripts representing those previously annotated by RefSeq databases (black lines); (2) novel isoforms representing transcripts that display novel alternative splicing or alternative transcription from previously annotated genes (green lines); (3) intergenic transcripts representing transcripts arising from intergenic regions (blue lines); and 4) intronic transcripts which represent transcripts identified within previously annotated introns (red lines). The histogram in A identifies the frequency of transcripts in each of the four categories against transcript length with the x-axis on a logarithmic scale (log10). (B) The frequency of each category of transcripts against ORF length (log10). The yellow vertical line indicates an arbitrary ORF cutoff of 300 nt. In (C), the frequency of transcripts is plotted against exon number. The arrow points to the inset that enlarges the range of genes containing 1–10 exons. (D) The frequency of transcripts against the average PhastCons score for each transcript (see Materials and Methods). (E) The frequency of transcripts plotted against their expression level (FPKM; log2). The expression level indicates the arithmetic average of the four differentiation stages (Days 4, 8, 11 and 14) for each transcript. (F) The frequency of transcripts against the percentage of each sequence constituted by repetitive elements. (G) A representative example of one intergenic transcript, denoted TCONS_00053011, located on chr7: 127958594–128091061 between the genes METTL2B and FAM71F2, and shows its expression levels at the four stages of erythroid differentiation. The y-axis represents the number of reads mapped to each genomic location, and ranges from 0 to 520 for all four differentiation stages. The red arches indicate the exon junctions that were identified in Day 11 transcripts. The UCSC genome browser indicates that this transcript is not annotated by the UCSC or RefSeq databases. The existence of this novel transcript is supported by data from the human EST database. Cross-species comparisons show that the genomic segment bearing this unannotated, potentially protein-coding transcript is highly conserved among different vertebrate species.
Table 2.
Putative protein-coding, long and short non-coding RNAs identified in differentiating erythroid cells
| Criteria and cutoffs |
Categorization by criteria |
||||||||||||
|---|---|---|---|---|---|---|---|---|---|---|---|---|---|
| Phast-Cons1 | Repeat element2 | Expression level3a | Exon Number4 | ORF (nt) | Transcript length (nt) | Protein-codingb | lnc RNAc | snc RNAd | |||||
| Number | >0.1 | <0.3 | ≥2 | >3005 | ≤3006 | >1000 | >2007 | 20–2008 | |||||
| Known transcripts | 9876 | 96% | 94% | 89% | 94% | 96% | 4% | 94% | 100.0% | 0.01% | 7371 75% |
249 3% |
0 0% |
| Novel isoforms | 32 453 | 94% | 95% | 62% | 95% | 93% | 7% | 89% | 99.9% | 0.09% | 16 707 51% |
2108 6% |
28 0.09% |
| Intergenic | 5546 | 47% | 77% | 89% | 7% | 32% | 68% | 30% | 89% | 10% | 50 1% |
3008 54% |
581 10% |
| Intronic | 3492 | 29% | 74% | 93% | 1% | 23% | 77% | 32% | 97% | 3% | 1 0.03% |
2318 66% |
98 3% |
aCriteria for ‘Expression level’ are defined for each stage so that the lowest 5% of the known transcripts are excluded (Day 4 = 3 × 10⁻⁴ FPKM; Day 8 = 7 × 10⁻⁵ FPKM; Day 11 <1 × 10⁻⁹ FPKM; Day 14 <1 × 10⁻⁹ FPKM). The percentages of transcripts of each type with expression levels higher than the threshold criteria at all stages are presented.
bCriteria 1–5 (superscripts) were applied.
clncRNA = long non-coding RNA; Criteria 6 and 7 were applied.
dsncRNA = short non-coding RNA; Criterion 8 was applied.
Identification of putative protein-coding and non-coding RNAs
To identify the most probable novel protein-coding candidates among the transcripts, we applied combinations of multiple logical criteria that were discussed previously; ORF length (>300 nt), exon number (>2), which are the two most conventional and conservative criteria for protein-coding potential; additional criteria that increase the stringency were PhastCons score (>0.1), repeat element content (<30%), and expression level (excluding the lowest 5% of transcripts at each maturation stage). Ultimately, 50 intergenic and one intronic transcripts successfully passed the most stringent tests (Table 2). Among them, only three represented products of conceivably unique protein-coding genes, while the remaining 48 appeared to be transcripts from genes with high similarity to known genes and were therefore presumed to have arisen by gene duplication.
We describe TCONS_00053011 as a detailed example of the three putative novel protein-coding transcripts (Fig. 2G). Although a BLAST search of this ORF (using the most recent genome updates) returned no matches, this transcript is found in the human EST database (Fig. 2G), indicating that it likely represents a novel human RNA with protein-coding potential. A second example, TCONS_00040131, taken from the 48 transcripts that display high similarity to transcripts of known genes (in this case, to FANCD2) is depicted in Supplementary Material, Figure S3. We randomly selected 9 (out of the 51 recovered) filtered transcripts and confirmed their existence by RT-PCR (Supplementary Material, Fig. S4).
In this study, we also identified putative non-coding RNAs based on their transcript and ORF lengths. Transcripts longer than 200 nt with ORFs shorter than 300 nt were classified as putative long non-coding RNAs (lncRNAs) (27), and only 249 (3%) of all known transcripts and 2108 (6%) of the novel isoforms fulfilled both criteria, while 3008 (54%) intergenic and 2318 (66%) intronic transcripts obeyed both criteria (Table 2). Transcripts from 20 to 200 nt were categorized as putative small non-coding RNAs (sncRNAs) (31,32); however, none of the known transcripts and only 28 (0.09%) of the novel isoforms obeyed this criterion, while 581(10%) intergenic and 98 (3%) of the intronic transcripts obeyed the criterion (Table 2). We note that these sncRNAs might be underrepresented in datasets presented here because only cDNA fragments of ∼200 nt in length were selected for the RNA-seq library constructions.
In summary, after rigorous data filtering, 51 novel RNAs were discovered as potential protein-coding transcripts. Further analyses revealed that only 3 (out of 51) transcripts may have protein-coding potential while the remaining 48 transcripts may have been generated by gene duplication. Additionally, we also found 5326 long and 679 small non-coding RNA candidates in the present study.
Changes in transcriptional and splicing isoform diversity during erythropoiesis
Transcript isoforms can be generated either at the level of transcription by alternative transcriptional initiation (ATI) and/or termination (ATT), or post-transcriptionally by alternative splicing. Alternative splicing events can range from exclusion of one or more exons (exon skipping, ES) to inclusion of an entire or partial (5′ or 3′) intron (intron retention, IR; alternative 5′ splicing, A5′S; alternative 3′ splicing, A3′S, respectively) from the mature mRNA (Fig. 3A) (21,22).
Figure 3.
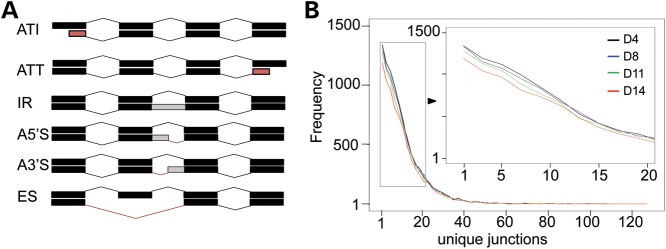
Reduction of alternative isoform diversity during erythropoiesis. (A) A schematic diagram for alternative transcriptional or splicing events is presented. Transcript isoform diversity can be generated either by transcriptional regulation or by alternative splicing of the same pre-mRNA (see Materials and Methods) (B) The frequency of previously annotated genes is plotted in the histogram against number of unique exon junctions per gene, which represents splice junctional complexity, of both known transcripts and novel isoforms at each differentiation stage. The inset, as indicated by the arrow, shows an expanded view of the range of unique junctions between 1 and 20.
We next investigated the contributions of alternative transcription and splicing to transcript isoform diversity during erythroid differentiation. For all known transcripts, alternative transcription collectively comprised 22.6% (15.9% ATI and 6.7% ATT) of total events, while alternative splicing made up 77.4% of the total events during erythroid differentiation (Table 3). When we combined the known and novel isoforms from the annotated genes together, we also observed that alternative splicing was far more prevalent than alternative transcription starts and stops in total alternative events (Table 3).
Table 3.
The percentage of each alternative event type in known or known/novel isoforms at each differentiation stage
| D4 | D8 | D11 | D14 | Union | |
|---|---|---|---|---|---|
| Known transcripts | |||||
| Total events | 18 620 | 18 398 | 16 726 | 16 372 | 22 678 |
| Gene # | 7974 | 7972 | 7938 | 7871 | 8112 |
| Event/gene | 2.34 | 2.31 | 2.11 | 2.08 | 2.80 |
| Events type (%) | |||||
| ATI | 16.1 | 16.2 | 16.2 | 15.9 | 15.9 |
| ATT | 6.9 | 6.7 | 6.7 | 6.6 | 6.7 |
| IR | 1.2 | 1.1 | 1.0 | 1.0 | 1.0 |
| A5′S | 31.1 | 31.4 | 31.4 | 31.5 | 31.1 |
| A3′S | 22.1 | 22.2 | 22.2 | 22.5 | 22.3 |
| ES | 22.6 | 22.4 | 22.5 | 22.4 | 23.0 |
| Known + novel isoforms | |||||
| Total events | 28 955 | 28 016 | 26 238 | 25 532 | 33 865 |
| Gene # | 11 745 | 11 734 | 11 688 | 11 636 | 11 787 |
| Event/gene | 2.47 | 2.39 | 2.24 | 2.19 | 2.87 |
| Events type (%) | |||||
| ATI | 15.6 | 15.4 | 15.5 | 15.4 | 15.5 |
| ATT | 6.6 | 6.6 | 6.6 | 6.5 | 6.5 |
| IR | 2.0 | 1.7 | 1.9 | 1.8 | 1.7 |
| A5′S | 28.9 | 29.3 | 28.8 | 29.0 | 29.1 |
| A3′S | 21.9 | 22.0 | 21.8 | 21.8 | 22.2 |
| ES | 25.1 | 25.0 | 25.3 | 25.6 | 25.1 |
Although a similar number of genes generate transcript variants during differentiation, for all known transcripts the total frequency of alternative events diminished as differentiation progressed (Table 3), hence the average frequency of alternative events per gene gradually decreased (from 2.34 to 2.08) between Days 4 and 14, respectively (Table 3). The same trend occurred when the known and novel isoforms were combined, in that the average frequency of events per gene also diminished from 2.47 on Day 4 to 2.19 by Day 14 (Table 3), suggesting that isoform diversity is more prominent during more immature erythroid differentiation stages. Further, although a decrease in the overall number of alternative events occurred as differentiation progressed, none of the specific alternative event categories was differentially affected (Table 3).
We also examined splicing junctional complexity during erythropoiesis. As shown in Figure 3B, the number of unique junctions generated from all annotated genes (including known transcripts and novel isoforms) diminished with progressing differentiation, consistent with the alternative splicing event quantification. In summary, the complexity of transcript diversity throughout differentiation was predominantly achieved by alternative splicing, while splicing junctional diversity diminished during erythroid differentiation.
Highly expressed transcripts during erythropoiesis
Hereafter we used an alternative protocol entitled ‘Quantification of reference annotation only’ (26), in which no novel gene or transcript discovery algorithm was applied, to measure the expression abundance (FPKM) of transcripts annotated by the RefSeq database. Using this method we found that 66–70% of all known human transcripts were expressed in erythroid cells (Supplementary Material, Table S2). A histogram depicting the frequencies of transcripts plotted against their abundance at each differentiation stage is shown in Figure 4A.
Figure 4.

Identification and functional analysis of the most highly expressed transcripts during erythroid differentiation. (A) In the histogram, the frequency of previously annotated transcripts expressed at each differentiation stage is plotted against their expression level (in FPKM; log10). The inset enlarges the domain lying between 100.5 and 102.5. The arrowhead indicates the cutoff criterion of 128 FPKM, which was arbitrarily selected to define only the most abundantly expressed transcripts. (B) The 815 previously annotated transcripts with expression levels >128 FPKM at one or more of the four erythroid differentiation stages examined here (at Days 4, 8, 11 or 14) are presented in the heatmap, sorted by expression level in temporal order from Day 4 to Day 14. (C) The significantly, over-represented TFBSs (FDR <0.05) from the highly expressed transcripts at each discrete erythroid differentiation stage are shown for each differentiation time point on a logarithmic scale (log10).
We next examined the most abundantly expressed transcripts at each differentiation stage, which might provide insights into essential physiological functions that may be required at different stages. A total of 815 transcripts with an FPKM >128 were identified at one or more of the four stages (with 652, 620, 535 and 446 such transcripts detected at Days 4, 8, 11 and 14, respectively) (Fig. 4B and Supplementary Material, Table S3). Gene Ontology (GO) analysis (33) revealed that transcripts that were highly expressed on Day 4 were enriched for basic metabolic functions (e.g. generation of precursor metabolites, nucleotide metabolic processes and DNA metabolism etc.) and basic biological processes (e.g. regulation of apoptosis, RNA processing and splicing etc.), while highly expressed transcripts at later maturation stages were enriched for erythroid-specific functions (e.g. hemoglobin complex formation and erythrocyte differentiation) (Supplementary Material, Fig. S5A). Of these 815 transcripts, 308 (∼40%) were highly expressed throughout erythroid differentiation and were strongly associated with ribosome-related functions such as protein synthesis (Supplementary Material, Fig. S5B and C).
In order to shed light on the potential transcriptional regulation of these highly expressed transcripts at each differentiation stage, we performed transcription factor binding site analysis (UCSC_TFBS) using the DAVID database with default settings (see Materials and Methods). After applying a cutoff of false discovery rate (FDR) <0.05 to the enriched transcription factors at each stage, we observed that some transcription factors displayed a unique, stage-specific regulatory pattern (e.g. YY1 at Day 4, NFY and PAX5 at Day 8 and TAX/CREB at Day 11), while we also saw enrichment of NRF2 throughout erythroid differentiation (Fig. 4C).
Taken together, the consistently highly expressed transcripts during differentiation were strongly associated with ribosome-related functions. The highly expressed transcripts on Day 4 were predominantly concerned with basic metabolic functions and basic biological processes, while the highly expressed transcripts at later differentiation stages (e.g. Day 14) were enriched in erythroid-specific functions.
Differentially expressed transcripts during erythroid differentiation
We identified 11 402 differentially expressed transcripts after applying double cutoffs of a fold change >2.5 between any pairwise comparisons (of Days 4, 8, 11 or 14) and an FPKM >0.01 in at least three of the differentiation stages examined (Fig. 5A). The analyses were further refined by hierarchical clustering based on the temporal expression patterns of the transcripts normalized to Day 4 (Fig. 5A and B), resulting in the identification of seven distinct gene expression clusters.
Figure 5.

Identification and characterization of differentially expressed transcripts during erythropoiesis. (A) The heatmap shows a global view of stage-dependent differential expression of previously annotated transcripts that exhibited a >2.5-fold change in any pairwise comparison between the four differentiation stages (Days 4, 8, 11 or 14) and an expression level (FPKM) >0.01 in at least three separate differentiation stages. Expression levels of the transcripts were normalized to those on Day 4, and then binary logarithmic transformations of fold-change values were plotted to generate the heatmap by hierarchical clustering. (B) The line plots depict the expression pattern of each gene cluster during erythroid differentiation on a binary logarithmic scale. The minimum of −20 in the plots represents an artifact of data analysis. [To avoid an infinite fold-change of transcripts that did not express at certain stages, all transcripts were augmented with an extremely small FPKM (10−6) prior to binary logarithmic transformation to thereby generate the −20 value.] (C) The uniquely and significantly over-represented TFBS in transcripts of Clusters 1 and 7 are shown.
GO analysis revealed that transcripts in Cluster 1 (predominantly up-regulated) were enriched for erythroid-specific functions such as hemoglobin complex (i.e. mRNAs for α- and β-globins), nucleosome assembly, oxygen transport, cell death and heme metabolic processes (Supplementary Material, Table S4). Not surprisingly, Cluster 7 (consisting entirely of down-regulated transcripts) was enriched for non-erythroid functions such as immune system processes and leukocyte activation (Supplementary Material, Table S4). Interestingly, another major population of transcripts (described as Cluster 4) was specifically enriched in metabolic processes. These transcripts were initially induced from Day 4 to Day 8, and subsequently repressed at Days 11 and 14, of erythropoiesis (Supplementary Material, Table S4), suggesting that the most active metabolic and energy-consuming processes occurred while the progenitor cells were undergoing rapid proliferation prior to commitment to the erythroid lineage.
Since RNA-seq has been reported to significantly improve sensitivity and accuracy in transcriptome analysis (7,18–20), we might have expected to identify many differentially expressed genes that were previously overlooked in microarray studies during erythropoiesis. We found 1322 more differentially expressed genes (using fold change >2.5 between any pairwise stage comparisons) that were not identified in previous microarray studies (1–5), which included two studies that most closely mimic the serum-free culture conditions employed in this study (2,4). After removing low abundance transcripts by applying an additional criterion requiring an FPKM >1 in at least three differentiation stages, this finally yielded 404 genes that were differentially expressed, including 80 (20%) non-coding RNAs (Supplementary Material, Table S5).
We next examined significantly enriched TFBSs in the vicinity of hierarchically clustered genes. By applying an FDR <0.05, we discovered 42, 28 and 73 transcription factors that are possible modulators of transcription in Clusters 1, 4 and 7, respectively (Supplementary Material, Table S6). As shown in Figure 5C, we found that the binding sites for, among others, HNF4, LMO2COM and HEN1 were significantly and uniquely enriched in the genes encoding induced transcripts (Cluster 1), while sites for NMYC, MYOD, IK3, ELK1 and PAX2 were similarly enriched among the genes encoding transcripts that diminished during progressive differentiation (Cluster 7). However, in Cluster 4, there were only 5 (of 28) TFBSs that were uniquely and significantly enriched, including RORA2 and STAT1 (both TFs which interestingly execute differentiation programs in response to extracellular signals), while the remainder either overlapped those of Clusters 1 or 7 (Supplementary Material, Table S6).
We also applied a second algorithm called DESeq (34) to identify differentially expressed genes. DESeq is based on the negative binomial distribution of raw gene read counts to identify the differentially expressed genes rather than normalized FPKM values. It also employs a size factor estimation step for normalization that is robust to outlier high read transcripts, thereby avoiding any possible negative effect of simpler normalization based on total reads that might be influenced by very highly expressed genes (e.g. globin genes) in erythroid cells. Using an FDR <0.05, we identified 4185 differentially expressed genes by DESeq (Supplementary Material, Fig. S6 and Supplementary Material, Table S7) and 68% (2870) of them overlapped with the differentially expressed genes identified using an FPKM fold change >2.5 and an FPKM >0.01 in at least three differentiation stages by Cuffdiff. We also enriched similar GO terms from the up- and down-regulated transcripts/genes identified by Cuffdiff (Clusters 1 and 7) and DESeq (Clusters 1 and 2), respectively (Supplementary Material, Tables S4 and S7)
In summary, differentially expressed transcripts during erythropoiesis (identified by a fold change >2.5 and an FPKM >0.01 in at least three differentiation stages) were classified into seven clusters by hierarchical clustering. Cluster 1 (primarily consisting of up-regulated transcripts) was enriched in erythroid-specific functions, Cluster 4 (up-regulated from Day 4 to Day 8, then down-regulated thereafter) was related to metabolic processes, and Cluster 7 (mainly containing progressively down-regulated transcripts) was associated with other non-erythroid hematopoietic lineage functions. For each of the major clusters, we predicted potential transcription modulators based on TFBS analysis. We also identified 404 genes that were not previously known to be differentially expressed in erythroid cells.
Abundant transcripts with extreme differential expression profiles are enriched in lineage-specific functions
To gain insights into the physiological functions associated with the most extreme differential expression patterns during erythropoiesis, we examined genes after applying criteria of a fold change >10 and expression levels of FPKM >0.1 for at least three differentiation stages. These doubly stringent criteria yielded a group of 1287 transcripts that were subjected to more detailed analysis (Fig. 6A). Using hierarchical clustering, six groups of transcripts were identified; their expression patterns are shown in Figure 6B. GO term analysis revealed that the transcripts in Clusters 1 and 6 were significantly enriched in hematopoietic lineage-specific functions (Supplementary Material, Table S8). The most significantly up-regulated transcripts (Cluster 1) were highly related to erythroid lineage development, while the most significantly down-regulated ones (Cluster 6) were strongly associated with lymphocyte and leukocyte lineages (Supplementary Material, Table S8). Other fluctuating, expressed clusters were also enriched for specific functions; for example: the transcripts in Cluster 2 were enriched in protein binding and signal transduction functions (Supplementary Material, Table S8), while those in Cluster 4 were most highly enriched in functions related to lumen formation and protein transport. When we applied TFBS analysis as before, only one transcription factor—TCF11 (also known as NFE2L1, NRF1 or LCR-F1), enriched in Cluster 6—passed our stringent cutoff of FDR <0.05 (the corresponding P-value for this enrichment is 1.84 × 10⁻⁵). The enrichment of TCF11 might have been predicted given its well-established roles in megakaryocyte differentiation (35) and T-cell development (36). In brief, abundant transcripts with extreme differential expression profiles were specifically enriched in lineage-specific functions.
Figure 6.

Identification and functional analysis of transcripts exhibiting extreme differential expression during erythropoiesis. (A) The heatmaps characterize transcripts that display the most significant differential expression, with a fold change >10 between any two pairwise comparisons among the four differentiation stages examined and having an expression level of FPKM >0.1 in at least three differentiation stages. Expression levels (in FPKM) of transcripts were normalized to those on day 4, and then a binary logarithmic transformation of fold-change values were plotted to generate the heatmap by hierarchical clustering. (B) The line plots depict the expression pattern of each gene cluster during erythroid differentiation on a binary logarithmic scale. The minimum of −20 in the plots represents an artifact of data analysis, as performed in Figure 5B.
DISCUSSION
Massive parallel sequencing of experimentally derived short RNA sequences (RNA-seq) has revolutionized our understanding of the complexity, plasticity and regulation of gene expression, and has highlighted that the human transcriptome is far more complex and dynamic than initially anticipated (21,37). Here, we provide the most comprehensive transcriptional inventory of human erythropoiesis described to date using RNA-seq. In this study, the identification of thousands of novel transcripts that mapped to intergenic and intronic regions, delineation and analysis of thousands of known and novel alternative splicing variants as well as assessments of transcript accumulation profiles and abundances in differentiating erythroid cells are reported.
Accumulating evidence supports the notion that a large fraction of the non-coding genome is actively transcribed: while only 2% of the human genome encodes proteins (38), perhaps surprisingly, primary and processed transcripts are derived from nearly 75 or 62% of the genome, respectively (39–41). In this study, we similarly identified thousands of intergenic and intronic transcripts in non-coding genomic regions. We categorized most of these novel transcripts (54% intergenic and 66% intronic transcripts) as lncRNAs using generally accepted criteria. Further characterization revealed that these transcripts were significantly shorter than their protein-coding equivalents because of lower exon content. This finding is consistent with the observation from a recent comprehensive survey demonstrating that lncRNAs are principally composed of one or two exons, leading to generally shorter transcripts than their protein-coding counterparts (39). The fact that these putative lncRNAs were less highly conserved than protein-coding transcripts further supports this assumption, since lncRNAs are generally thought to be under less selective pressure than protein-coding genes (39,42–45). Moreover, the abundance of these putative lncRNA transcripts was on average significantly lower than known transcripts, also consistent with previous observations (39,46).
Although the expression of the lncRNAs is generally lower than their protein-coding counterparts, they were expressed in a more lineage- and tissue-specific manner (39,47), suggesting that they may play important roles in tissue-specific development and differentiation (48). In support of this hypothesis, erythroid-specific lncRNAs have been reported to play key roles in the regulation of red cell maturation during mouse erythropoiesis (49–51). However, since lncRNAs display poor conservation across species, erythroid-specific lncRNAs identified in the mouse might not help us to glean new insights into human erythropoiesis (51). Therefore, the present data provide an important platform for revealing the identity of human erythroid lineage-specific lncRNAs and for exploring their physiological functions in the future. Since it has been speculated that lineage-specific ncRNAs may constitute potential therapeutic targets for hematological malignancies (52), investigation of novel human erythroid-specific lncRNAs could lead to new approaches for the treatment of erythroid-related disorders.
As revealed recently, extensive and dynamic alternative transcription or splicing is one of the hallmarks of erythropoiesis (53,54). The data described here revealed that the diversity and dynamics of the erythroid transcriptome stem from the combinatorial effects of alternative splicing and alternative transcription, with the former predominating as the primary mechanism to generate alternative RNA isoforms. A similar conclusion was reached in an earlier study that calculated the frequency of each specific alternative event in 15 diverse human tissues and cell lines (21). However, additional studies have more recently proposed that alternative transcription was the primary driving force for transcriptome diversity in mouse cerebellar development as well as in the human genome without regard to tissue preference (22,55). Whether this is due to the cell type specificity (erythroid versus neuronal cells) or the application of different gene annotation resources (RefSeq versus UCSC/RefSeq or UCSC/RefSeq/Ensemble/MGI/Vega), the answer awaits more detailed analyses of differentiated cell types and the continued development of even more sophisticated analytical tools.
We observed progressively fewer overall alternative events, either transcriptional or splicing, as erythroid differentiation progressed. This is consistent with a previously observed phenomenon referred to as ‘isoform specialization’ in which splicing complexity is higher in immature, undifferentiated stem cells than in more committed cells such as neurons (23) or human lung fibroblasts (56). To account for this, it was postulated that the higher isoform diversity is required to maintain the pluripotency/multipotency of stem/progenitor cells, while more specialized isoforms in differentiating cells may ensure proper differentiation (23).
A comprehensive catalog of differentially expressed transcripts between each erythroid developmental stage was also generated here. As anticipated, Cluster 1 (successively more induced transcripts at each erythroid maturation stage) was enriched in erythroid lineage-specific physiological functions (2,57). At the same time, the transcription factors that were predicted to be uniquely and significantly associated with those genes also supported their erythroid-relevant functions. For example, LMO2, TAL1 and GATA1 can form a stable protein complex that promotes erythroid differentiation (58), and the enrichment of HEN1 may be related to its potential interaction with LMO2 (59). In a similar manner, Cluster 7 (uniformly repressed down-regulated transcripts in successive differentiation stages) was enriched in lymphocyte lineage-related functions (57). The transcription factors predicted from these down-regulated transcripts include NMYC, which is exclusively expressed in hematopoietic stem cells as a fingerprint gene (60), MYOD, a tissue-specific expression marker for muscle (61,62), and PAX2, a specific expression marker of the kidney (63), all suggesting that non-erythroid lineage-specific genes are the most significantly down-regulated. However, some of the predicted factors may have currently unrecognized roles during erythropoiesis, and therefore, further validation of their erythroid-specific functions would be vital for continued expansion of our understanding of the transcription regulatory networks that control erythroid differentiation. The ability of RNA-seq technology to accurately measure the dynamic range of transcript abundance (7,18–20) could result in the discovery of even more differentially expressed genes. In this RNA-seq study, we have identified 404 differentially expressed genes that were undetected in all previous microarray studies (1–5). For example, DYRK1B, which belongs to the subfamily of dual-specificity tyrosine phosphorylation-regulated kinases, was reported to be expressed in heart, muscle and testes (64); however, we observed that DYRK1B was induced during late erythroid differentiation, suggesting that it might play some physiological roles there like its related family member DYRK3 (65). Another potentially interesting candidate is ACAT2 (acetyl-CoA acetyltransferase 2). It was shown that during lymphocytic choriomeningitis virus (LCMV) infection, ACAT2 was up-regulated and accompanied by an erythroid differentiation block (66). In the current study, we observed ACAT2 down-regulation during erythroid differentiation, suggesting that the attenuation of ACAT2 might be required for normal erythroid maturation.
In addition to the protein-coding genes identified here, we also discovered 80 non-coding RNAs. Since non-coding RNAs lie outside the coverage of normal microarray expression studies, these 80 genes further contribute to the 404 previously overlooked differentially expressed genes. Of these, 13 (out of 80) were miRNAs, and it is now abundantly clear that the roles for miRNAs in the regulation of erythropoiesis are well established (67–72). In the present study, we found that miR223 expression remains high until Day 11 (FPKM = 16, 86 and 102 at Days 4, 8 and 11, respectively) but is undetectable by Day 14 (FPKM = 0); this suggests that miR223 might play important functions in immature erythroblast cells, but is not required for enucleation prior to the reticulocyte stage. In contrast, the expression levels of miR210, miR3661 and miR3665 peaked on Day 14, suggesting they might be involved in steps required for erythroid terminal maturation. The identification of these novel differentially expressed genes in the current study provides substantial new information to the developmental stage-specific erythroid transcriptome profile.
Microarrays are known to be less sensitive than qRT-PCR (1,2). Thus any discrepancies between the results reported here and earlier studies may be due either to the technological limitations inherent in microarray quantification or to the distinct cell differentiation conditions employed. We conclude that the improved methodology of RNA-seq should lead to more precise estimation of the dynamic changes in transcriptome profiles that occur as a consequence of differentiation. The present data should serve as a useful resource for future investigations into the molecular dynamics of transcriptional regulation during human erythropoiesis and perhaps an initial platform for the identification of novel biomarkers that can be used to predict the severity, or for detection, of human erythroid disorders.
MATERIALS AND METHODS
Ex vivo differentiation of purified human CD34+ cells
Cryopreserved vials of purified human CD34+ hematopoietic progenitor cells were purchased from the Fred Hutchinson Cancer Research Center. The cells were collected from healthy volunteers in full compliance with federal and institutional regulations on informed consent and confidentiality. The CD34+ cells were isolated from the peripheral blood after mobilization by granulocyte colony-stimulating factor (G-CSF). The cells were grown and differentiated ex vivo into erythroid cells by a two-phase culture method described previously (24,25). Cell morphology was examined by Wright-Giemsa staining (Sigma-Aldrich) of cytospins. Hemoglobin content was monitored by neutral benzidine staining as described previously (73).
Flow cytometry
For cell surface marker analysis, cells were collected, washed and re-suspended in ice-cold phosphate-buffered saline with 2% fetal bovine serum (PBS–FBS). For each assay, 106 cells in 100 μl PBS–FBS were stained with phycoerythrin (PE)-Cy7-conjugated anti-CD34 (eBioscience), PE-conjugated anti-CD71 (eBioscience), fluorescein isothiocyanate (FITC)-conjugated anti-CD36 (eBioscience), or PE-Cy5-conjugated anti-glycophorin A (BD Biosciences) antibodies for 30 min on ice. Cells were then washed twice, re-suspended in 500 μl ice-cold PBS–FBS, and subjected to flow-cytometric analysis on a FACS Canto II instrument (BD Biosciences).
RNA purification
Total RNA was purified with an ISOGEN (Nippon Gene) reagent from primary human erythroid cells after 4, 8, 11 or 14 days of ex vivo differentiation of CD34+ cells. The integrity and quality of RNA were assessed by the RNA integrity number (RIN) determined with an Agilent 2100 Bioanalyzer (Agilent Technologies). RINs of all the RNA samples used in this study were 10, indicating RNA of the highest integrity.
RNA sequencing
The construction of the RNA-seq libraries was performed according to standard instructions from Illumina. In brief, poly-A+ RNA was purified by poly-dT oligo-attached magnetic beads from 10 μg total RNA extracted from primary human erythroid cells after 4, 8, 11 or 14 days of ex vivo differentiation, and then sheared into short fragments of 200–300 bp in length by heating in the presence of divalent Zn2+ cations. These RNA fragments were reverse-transcribed using random primers into double-stranded cDNA fragments, which were end-repaired and then subjected to addition of a single adenine followed by ligation with an Illumina adapter to both ends. After PCR amplification, cDNA fragments ∼200 bp in length were selected to generate a library to be sequenced in a paired-end 72-bp sequencing format using the Illumina Genome Analyzer IIx system in the DNA sequencing core facility of the University of Michigan. Two replicate RNA samples at each differentiation stage (Days 4, 8, 11 and 14) were prepared from independent CD34+-cell cultures to generate two biological replicates of RNA-seq libraries and data sets.
Identification and quantification of previously annotated transcripts
For RNA-seq data analysis, we aligned the raw reads from ELAND to the human genome (build hg18) using TopHat (version 1.3.3) at the default settings (74). We then used Cufflinks (version 1.2.1) to identify previously annotated transcripts, and then to determine gene- and isoform-specific expression levels of those transcripts in units of fragments per kilobase of exon per million fragments mapped (FPKM). The results from two biological replicates were merged using Cuffmerge, and then Cuffdiff was used to identify differentially expressed transcripts at the different stages (Days 4, 8, 11 or 14). The RNA-seq data at distinct differentiation stages have been deposited in the NCBI Gene Expression Omnibus [accession number GSE54602]. The abundance of all annotated isoforms for each gene was summed for gene-based expression level comparisons with qPCR assays.
Identification of novel transcript isoforms and intergenic or intronic transcripts
To identify novel transcript isoforms as well as intergenic or intronic transcripts from the RNA-seq data sets, we performed de novo assembly of the transcripts (without supplying gene model annotations) by using Cufflinks to processes output BAM files from TopHat. The results from replicates were then merged using Cuffmerge, and then Cuffdiff was used to perform differential expression analysis as described above.
Analysis of cross-species conservation of transcripts
To estimate the sequence conservation of transcripts from previously annotated genes and for intergenic or intragenic transcripts, we used PhastCons conservation scores derived from an alignment of 17 vertebrate genomes (29). For each transcript, we first summed the PhastCons score of individual nucleotides in all exon sequences, and then normalized to the transcript size to achieve an average PhastCons score. Thus, transcripts with higher conservation scores are better conserved across all vertebrates.
Definition and classification of alternative transcriptional and splicing events
(1) Alternative transcription initiation (ATI) and termination (ATT). For each isoform, the 5′ end of the first exon was compared with all other isoforms derived from the same gene. If any pair of 5′ ends was more than 5 nt apart, it was counted as an independent ATI event. A similar definition was applied to ATT. (2) Intron retention (IR). For each isoform, each intron position was compared with the exon positions of all other isoforms derived from the same gene. If the intron was entirely contained in an exon of another isoform, it was scored as an independent intron retention event. (3). Alternative 5′ splicing (A5′S) and 3′ splicing (A3′S). For each isoform, the 5′ splice sites of introns were compared with those of all other isoforms derived from the same gene. If a particular 5′ splice site was not present within 5 nt of 5′ splice sites of other isoforms, and yet the exons preceding the 5′ splice sites of the two isoforms shared a common genomic segment, it was counted as an independent A5′S event. If no part of the exons preceding the differential 5′ splice sites of the two isoforms was shared, it was rather considered as an ES event (described below). A similar definition was applied to A3′S. (4) For each isoform, the start and end positions of each exon were compared with the exon positions of all other isoforms derived from the same gene. If no part of a given exon (except the first or last) was shared by another isoform, it was counted as an independent ES event.
RNA quantification by qRT-PCR
qRT-PCR (reverse transcription and quantitative real-time PCR) assays were performed to quantify 37 transcripts that displayed broad expression ranges during erythroid differentiation in RNA-seq assays, as described previously (75). The same RNA samples that were used for RNA-seq library construction were used as templates for qRT-PCR. The relative abundance of the mRNAs was determined using 18S rRNA as an internal control, based on threshold cycle (Ct) values and the experimentally determined amplification efficiency for each primer pair. All the primer pairs except for 18S rRNA were designed to span introns (Supplementary Material, Table S9). The 37 transcripts examined (Supplementary Material, Fig. S2B) were comprised of three groups: (1) transcripts that are abundantly expressed during erythroid differentiation, such as α- and β-globin mRNAs (with expression levels up to 316 119 FPKM); (2) transcripts whose expression level fluctuated the most during erythroid differentiation; (3) erythroid-biased transcription factors, which were all expressed at low abundance levels (<1 FPKM).
Validation of intergenic transcripts by RT-PCR and amplicon sequencing
Potential novel protein-coding transcripts identified in intergenic regions were validated by RT-PCR (reverse transcription and PCR) using primers that spanned predicted exon junctions (Supplementary Material, Table S10). cDNA was synthesized from RNA extracted from differentiating primary human erythroid cells on Days 4, 8, 11 and 14, and then pooled as templates for PCR, essentially as described previously (75). The authenticity of PCR amplicons was confirmed by size determination on agarose gel electrophoresis and Sanger sequencing using the same PCR primers.
Heatmap generation
Java Treeview software was used to generate the heatmaps that represent differentially expressed or highly expressed transcripts, where the hierarchical clustering method (average or complete linkage clustering) was used to identify groups of transcripts with similar expression patterns.
Analysis of functional characteristics of transcript sets
We used the web-based implementation of the enrichment testing and concept mapping tool, ConceptGen (http://conceptgen.ncibi.org) (76) to identify biological categories that were enriched in each transcript set of interest, setting the P-value to <0.05 (by modified Fisher’'s exact test) as a significance level. Web-based implementations of the database for annotation, visualization, and integrated discovery (DAVID; http://david.abcc.ncifcrf.gov/) (33), the Kyoto Encyclopedia of Genes and Genomes (KEGG) pathway database (http://www.genome.jp/kegg/) (77) and the UCSC_TFBS database were used to identify over-represented pathways and TFBS lying near or within the genes specifying each transcript set. For the UCSC_TFBS analysis, the DNA sequence used for identification of potential regulatory TFBSs was from 10 kb 5′ to the transcriptional start site to 3 kb 3′ of the TES, which are conversed among human, mouse and rat species. The set of all transcripts in the Entrez Gene database was used as a control to determine the statistical significance of any over-represented characteristics of each transcript set.
Web-accessible database
We generated a web interface using MySQL database for querying gene expression during human erythroid differentiation (including differentiation Days 4, 8, 11 and 14) from the data presented here. In this database, the transcript abundance can be queried both in FPKM, which was measured by the protocol entitled ‘Quantification of reference annotation only’ in Cufflinks (26), or in reads count, which was measured using DESeq (34). The database is available at http://guanlab.ccmb.med.umich.edu/data/Shi_L_Developmental/index.php.
Statistical analysis
For evaluation of reproducibility of RNA-seq data, or overall changes in transcriptomes during erythroid differentiation, we determined Pearson's correlation coefficients for logarithmic transformations of each transcript abundance in two biological replicate RNA samples, or at two different differentiation stages, respectively.
SUPPLEMENTARY MATERIAL
FUNDING
This work was supported by National Institute of Health Grants [DK086956 (to O.T. and J.D.E.), HL24415 and HL114368 (to J.D.E.), R21NS082212-01 (to Y.G.)]; American Heart Association postdoctoral fellowship (to L.S); and an American Heart Association National Scientist Development Grant 13SDG16950062 to S.C.
Supplementary Material
ACKNOWLEDGEMENTS
We thank Robert Lyons and the DNA sequencing core at the University of Michigan for their expertise with the Illumina sequencing platform and technical support. We also thank T. Hosoya, S. Hosoya-Ohmura and C.J. Ku for lively discussions and advice and C. Yu for technical assistance.
Conflict of Interest statement. The authors declare no conflict of interest or financial interests with regard to this work.
REFERENCES
- 1.Merryweather-Clarke A.T., Atzberger A., Soneji S., Gray N., Clark K., Waugh C., McGowan S.J., Taylor S., Nandi A.K., Wood W.G., et al. Global gene expression analysis of human erythroid progenitors. Blood. 2011;117:e96–108. doi: 10.1182/blood-2010-07-290825. [DOI] [PubMed] [Google Scholar]
- 2.Keller M.A., Addya S., Vadigepalli R., Banini B., Delgrosso K., Huang H., Surrey S. Transcriptional regulatory network analysis of developing human erythroid progenitors reveals patterns of coregulation and potential transcriptional regulators. Physiol. Genomics. 2006;28:114–128. doi: 10.1152/physiolgenomics.00055.2006. [DOI] [PubMed] [Google Scholar]
- 3.Peller S., Tabach Y., Rotschild M., Garach-Joshua O., Cohen Y., Goldfinger N., Rotter V. Identification of gene networks associated with erythroid differentiation. Blood Cells Mol. Dis. 2009;43:74–80. doi: 10.1016/j.bcmd.2009.01.020. [DOI] [PubMed] [Google Scholar]
- 4.Singleton B.K., Burton N.M., Green C., Brady R.L., Anstee D.J. Mutations in EKLF/KLF1 form the molecular basis of the rare blood group In(Lu) phenotype. Blood. 2008;112:2081–2088. doi: 10.1182/blood-2008-03-145672. [DOI] [PubMed] [Google Scholar]
- 5.Sripichai O., Kiefer C.M., Bhanu N.V., Tanno T., Noh S.J., Goh S.H., Russell J.E., Rognerud C.L., Ou C.N., Oneal P.A., et al. Cytokine-mediated increases in fetal hemoglobin are associated with globin gene histone modification and transcription factor reprogramming. Blood. 2009;114:2299–2306. doi: 10.1182/blood-2009-05-219386. [DOI] [PMC free article] [PubMed] [Google Scholar]
- 6.Yamamoto M.L., Clark T.A., Gee S.L., Kang J.A., Schweitzer A.C., Wickrema A., Conboy J.G. Alternative pre-mRNA splicing switches modulate gene expression in late erythropoiesis. Blood. 2009;113:3363–3370. doi: 10.1182/blood-2008-05-160325. [DOI] [PMC free article] [PubMed] [Google Scholar]
- 7.Mortazavi A., Williams B.A., McCue K., Schaeffer L., Wold B. Mapping and quantifying mammalian transcriptomes by RNA-Seq. Nat. Methods. 2008;5:621–628. doi: 10.1038/nmeth.1226. [DOI] [PubMed] [Google Scholar]
- 8.Agarwal A., Koppstein D., Rozowsky J., Sboner A., Habegger L., Hillier L.W., Sasidharan R., Reinke V., Waterston R.H., Gerstein M. Comparison and calibration of transcriptome data from RNA-Seq and tiling arrays. BMC Genomics. 2010;11:383. doi: 10.1186/1471-2164-11-383. [DOI] [PMC free article] [PubMed] [Google Scholar]
- 9.Clarke J., Wilhelm F.K. Superconducting quantum bits. Nature. 2008;453:1031–1042. doi: 10.1038/nature07128. [DOI] [PubMed] [Google Scholar]
- 10.Xu A.G., He L., Li Z., Xu Y., Li M., Fu X., Yan Z., Yuan Y., Menzel C., Li N., et al. Intergenic and repeat transcription in human, chimpanzee and macaque brains measured by RNA-Seq. PLoS Comput. Biol. 2010;6:e1000843. doi: 10.1371/journal.pcbi.1000843. [DOI] [PMC free article] [PubMed] [Google Scholar]
- 11.Cabili M.N., Trapnell C., Goff L., Koziol M., Tazon-Vega B., Regev A., Rinn J.L. Integrative annotation of human large intergenic noncoding RNAs reveals global properties and specific subclasses. Genes Dev. 2011;25:1915–1927. doi: 10.1101/gad.17446611. [DOI] [PMC free article] [PubMed] [Google Scholar]
- 12.Liu W., Zhao Y., Cui P., Lin Q., Ding F., Xin C., Tan X., Song S., Yu J., Hu S. Thousands of Novel Transcripts Identified in Mouse Cerebrum, Testis, and ES Cells Based on ribo-minus RNA Sequencing. Front. Genet. 2011;2:93. doi: 10.3389/fgene.2011.00093. [DOI] [PMC free article] [PubMed] [Google Scholar]
- 13.Djuranovic S., Nahvi A., Green R. A parsimonious model for gene regulation by miRNAs. Science. 2011;331:550–553. doi: 10.1126/science.1191138. [DOI] [PMC free article] [PubMed] [Google Scholar]
- 14.Geisler S., Lojek L., Khalil A.M., Baker K.E., Coller J. Decapping of long noncoding RNAs regulates inducible genes. Mol. Cell. 2012;45:279–291. doi: 10.1016/j.molcel.2011.11.025. [DOI] [PMC free article] [PubMed] [Google Scholar]
- 15.Koerner M.V., Pauler F.M., Huang R., Barlow D.P. The function of non-coding RNAs in genomic imprinting. Development. 2009;136:1771–1783. doi: 10.1242/dev.030403. [DOI] [PMC free article] [PubMed] [Google Scholar]
- 16.Gupta R.A., Shah N., Wang K.C., Kim J., Horlings H.M., Wong D.J., Tsai M.C., Hung T., Argani P., Rinn J.L., et al. Long non-coding RNA HOTAIR reprograms chromatin state to promote cancer metastasis. Nature. 2010;464:1071–1076. doi: 10.1038/nature08975. [DOI] [PMC free article] [PubMed] [Google Scholar]
- 17.Guttman M., Donaghey J., Carey B.W., Garber M., Grenier J.K., Munson G., Young G., Lucas A.B., Ach R., Bruhn L., et al. lincRNAs act in the circuitry controlling pluripotency and differentiation. Nature. 2011;477:295–300. doi: 10.1038/nature10398. [DOI] [PMC free article] [PubMed] [Google Scholar]
- 18.Graveley B.R. Molecular biology: power sequencing. Nature. 2008;453:1197–1198. doi: 10.1038/4531197b. [DOI] [PMC free article] [PubMed] [Google Scholar]
- 19.Marioni J.C., Mason C.E., Mane S.M., Stephens M., Gilad Y. RNA-seq: an assessment of technical reproducibility and comparison with gene expression arrays. Genome Res. 2008;18:1509–1517. doi: 10.1101/gr.079558.108. [DOI] [PMC free article] [PubMed] [Google Scholar]
- 20.Sultan M., Schulz M.H., Richard H., Magen A., Klingenhoff A., Scherf M., Seifert M., Borodina T., Soldatov A., Parkhomchuk D., et al. A global view of gene activity and alternative splicing by deep sequencing of the human transcriptome. Science. 2008;321:956–960. doi: 10.1126/science.1160342. [DOI] [PubMed] [Google Scholar]
- 21.Wang E.T., Sandberg R., Luo S., Khrebtukova I., Zhang L., Mayr C., Kingsmore S.F., Schroth G.P., Burge C.B. Alternative isoform regulation in human tissue transcriptomes. Nature. 2008;456:470–476. doi: 10.1038/nature07509. [DOI] [PMC free article] [PubMed] [Google Scholar]
- 22.Pal S., Gupta R., Kim H., Wickramasinghe P., Baubet V., Showe L.C., Dahmane N., Davuluri R.V. Alternative transcription exceeds alternative splicing in generating the transcriptome diversity of cerebellar development. Genome Res. 2011;21:1260–1272. doi: 10.1101/gr.120535.111. [DOI] [PMC free article] [PubMed] [Google Scholar]
- 23.Wu J.Q., Habegger L., Noisa P., Szekely A., Qiu C., Hutchison S., Raha D., Egholm M., Lin H., Weissman S., et al. Dynamic transcriptomes during neural differentiation of human embryonic stem cells revealed by short, long, and paired-end sequencing. Proc. Natl. Acad. Sci. U. S. A. 2010;107:5254–5259. doi: 10.1073/pnas.0914114107. [DOI] [PMC free article] [PubMed] [Google Scholar]
- 24.Giarratana M.C., Kobari L., Lapillonne H., Chalmers D., Kiger L., Cynober T., Marden M.C., Wajcman H., Douay L. Ex vivo generation of fully mature human red blood cells from hematopoietic stem cells. Nat. Biotechnol. 2005;23:69–74. doi: 10.1038/nbt1047. [DOI] [PubMed] [Google Scholar]
- 25.Shi L., Cui S., Engel J.D., Tanabe O. Lysine-specific demethylase 1 is a therapeutic target for fetal hemoglobin induction. Nat. Med. 2013;19:291–294. doi: 10.1038/nm.3101. [DOI] [PMC free article] [PubMed] [Google Scholar]
- 26.Trapnell C., Roberts A., Goff L., Pertea G., Kim D., Kelley D.R., Pimentel H., Salzberg S.L., Rinn J.L., Pachter L. Differential gene and transcript expression analysis of RNA-seq experiments with TopHat and Cufflinks. Nat. Protoc. 2012;7:562–578. doi: 10.1038/nprot.2012.016. [DOI] [PMC free article] [PubMed] [Google Scholar]
- 27.Collins J.E., Goward M.E., Cole C.G., Smink L.J., Huckle E.J., Knowles S., Bye J.M., Beare D.M., Dunham I. Reevaluating human gene annotation: a second-generation analysis of chromosome 22. Genome Res. 2003;13:27–36. doi: 10.1101/gr.695703. [DOI] [PMC free article] [PubMed] [Google Scholar]
- 28.Clamp M., Fry B., Kamal M., Xie X., Cuff J., Lin M.F., Kellis M., Lindblad-Toh K., Lander E.S. Distinguishing protein-coding and noncoding genes in the human genome. Proc. Natl. Acad. Sci. U. S. A. 2007;104:19428–19433. doi: 10.1073/pnas.0709013104. [DOI] [PMC free article] [PubMed] [Google Scholar]
- 29.Siepel A., Bejerano G., Pedersen J.S., Hinrichs A.S., Hou M., Rosenbloom K., Clawson H., Spieth J., Hillier L.W., Richards S., et al. Evolutionarily conserved elements in vertebrate, insect, worm, and yeast genomes. Genome Res. 2005;15:1034–1050. doi: 10.1101/gr.3715005. [DOI] [PMC free article] [PubMed] [Google Scholar]
- 30.Lander E.S., Linton L.M., Birren B., Nusbaum C., Zody M.C., Baldwin J., Devon K., Dewar K., Doyle M., FitzHugh W., et al. Initial sequencing and analysis of the human genome. Nature. 2001;409:860–921. doi: 10.1038/35057062. [DOI] [PubMed] [Google Scholar]
- 31.Mattick J.S., Makunin I.V. Non-coding RNA. Hum. Mol. Genet. 2006;15:R17–R29. doi: 10.1093/hmg/ddl046. [DOI] [PubMed] [Google Scholar]
- 32.Chu C.Y., Rana T.M. Small RNAs: regulators and guardians of the genome. J. Cell. Physiol. 2007;213:412–419. doi: 10.1002/jcp.21230. [DOI] [PubMed] [Google Scholar]
- 33.Dennis G., Jr., Sherman B.T., Hosack D.A., Yang J., Gao W., Lane H.C., Lempicki R.A. DAVID: Database for annotation, visualization, and integrated discovery. Genome Biol. 2003;4:P3. [PubMed] [Google Scholar]
- 34.Anders S., Huber W. Differential expression analysis for sequence count data. Genome Biol. 2010;11:R106. doi: 10.1186/gb-2010-11-10-r106. [DOI] [PMC free article] [PubMed] [Google Scholar]
- 35.Lecine P., Blank V., Shivdasani R. Characterization of the hematopoietic transcription factor NF-E2 in primary murine megakaryocytes. J. Biol. Chem. 1998;273:7572–7578. doi: 10.1074/jbc.273.13.7572. [DOI] [PubMed] [Google Scholar]
- 36.Wei G., Abraham B.J., Yagi R., Jothi R., Cui K., Sharma S., Narlikar L., Northrup D.L., Tang Q., Paul W.E., et al. Genome-wide analyses of transcription factor GATA3-mediated gene regulation in distinct T cell types. Immunity. 2011;35:299–311. doi: 10.1016/j.immuni.2011.08.007. [DOI] [PMC free article] [PubMed] [Google Scholar]
- 37.Pan Q., Shai O., Lee L.J., Frey B.J., Blencowe B.J. Deep surveying of alternative splicing complexity in the human transcriptome by high-throughput sequencing. Nat. Genet. 2008;40:1413–1415. doi: 10.1038/ng.259. [DOI] [PubMed] [Google Scholar]
- 38.Bertone P., Stolc V., Royce T.E., Rozowsky J.S., Urban A.E., Zhu X., Rinn J.L., Tongprasit W., Samanta M., Weissman S., et al. Global identification of human transcribed sequences with genome tiling arrays. Science. 2004;306:2242–2246. doi: 10.1126/science.1103388. [DOI] [PubMed] [Google Scholar]
- 39.Derrien T., Johnson R., Bussotti G., Tanzer A., Djebali S., Tilgner H., Guernec G., Martin D., Merkel A., Knowles D.G., et al. The GENCODE v7 catalog of human long noncoding RNAs: analysis of their gene structure, evolution, and expression. Genome Res. 2012;22:1775–1789. doi: 10.1101/gr.132159.111. [DOI] [PMC free article] [PubMed] [Google Scholar]
- 40.Batista P.J., Chang H.Y. Long noncoding RNAs: cellular address codes in development and disease. Cell. 2013;152:1298–1307. doi: 10.1016/j.cell.2013.02.012. [DOI] [PMC free article] [PubMed] [Google Scholar]
- 41.Mitchell J.A., Clay I., Umlauf D., Chen C.Y., Moir C.A., Eskiw C.H., Schoenfelder S., Chakalova L., Nagano T., Fraser P. Nuclear RNA sequencing of the mouse erythroid cell transcriptome. PLoS One. 2012;7:e49274. doi: 10.1371/journal.pone.0049274. [DOI] [PMC free article] [PubMed] [Google Scholar]
- 42.Ponjavic J., Ponting C.P., Lunter G. Functionality or transcriptional noise? Evidence for selection within long noncoding RNAs. Genome Res. 2007;17:556–565. doi: 10.1101/gr.6036807. [DOI] [PMC free article] [PubMed] [Google Scholar]
- 43.Guttman M., Amit I., Garber M., French C., Lin M.F., Feldser D., Huarte M., Zuk O., Carey B.W., Cassady J.P., et al. Chromatin signature reveals over a thousand highly conserved large non-coding RNAs in mammals. Nature. 2009;458:223–227. doi: 10.1038/nature07672. [DOI] [PMC free article] [PubMed] [Google Scholar]
- 44.Marques A.C., Ponting C.P. Catalogues of mammalian long noncoding RNAs: modest conservation and incompleteness. Genome Biol. 2009;10:R124. doi: 10.1186/gb-2009-10-11-r124. [DOI] [PMC free article] [PubMed] [Google Scholar]
- 45.Orom U.A., Derrien T., Beringer M., Gumireddy K., Gardini A., Bussotti G., Lai F., Zytnicki M., Notredame C., Huang Q., et al. Long noncoding RNAs with enhancer-like function in human cells. Cell. 2010;143:46–58. doi: 10.1016/j.cell.2010.09.001. [DOI] [PMC free article] [PubMed] [Google Scholar]
- 46.Ravasi T., Suzuki H., Pang K.C., Katayama S., Furuno M., Okunishi R., Fukuda S., Ru K., Frith M.C., Gongora M.M., et al. Experimental validation of the regulated expression of large numbers of non-coding RNAs from the mouse genome. Genome Res. 2006;16:11–19. doi: 10.1101/gr.4200206. [DOI] [PMC free article] [PubMed] [Google Scholar]
- 47.Bitton D.A., Wood V., Scutt P.J., Grallert A., Yates T., Smith D.L., Hagan I.M., Miller C.J. Augmented annotation of the Schizosaccharomyces pombe genome reveals additional genes required for growth and viability. Genetics. 2011;187:1207–1217. doi: 10.1534/genetics.110.123497. [DOI] [PMC free article] [PubMed] [Google Scholar]
- 48.Kalyana-Sundaram S., Kumar-Sinha C., Shankar S., Robinson D.R., Wu Y.M., Cao X., Asangani I.A., Kothari V., Prensner J.R., Lonigro R.J., et al. Expressed pseudogenes in the transcriptional landscape of human cancers. Cell. 2012;149:1622–1634. doi: 10.1016/j.cell.2012.04.041. [DOI] [PMC free article] [PubMed] [Google Scholar]
- 49.Hu W., Yuan B., Flygare J., Lodish H.F. Long noncoding RNA-mediated anti-apoptotic activity in murine erythroid terminal differentiation. Genes Dev. 2011;25:2573–2578. doi: 10.1101/gad.178780.111. [DOI] [PMC free article] [PubMed] [Google Scholar]
- 50.Alvarez-Dominguez J.R., Hu W., Yuan B., Shi J., Park S.S., Gromatzky A.A., Oudenaarden A., Lodish H.F. Global discovery of erythroid long noncoding RNAs reveals novel regulators of red cell maturation. Blood. 2014;123:570–581. doi: 10.1182/blood-2013-10-530683. [DOI] [PMC free article] [PubMed] [Google Scholar]
- 51.Paralkar V.R., Mishra T., Luan J., Yao Y., Kossenkov A.V., Anderson S.M., Dunagin M., Pimkin M., Gore M., Sun D., et al. Lineage and species-specific long noncoding RNAs during erythro-megakaryocytic development. Blood. 2014;123:1927–1937. doi: 10.1182/blood-2013-12-544494. [DOI] [PMC free article] [PubMed] [Google Scholar]
- 52.Fabbri M., Garzon R., Andreeff M., Kantarjian H.M., Garcia-Manero G., Calin G.A. MicroRNAs and noncoding RNAs in hematological malignancies: molecular, clinical and therapeutic implications. Leukemia. 2008;22:1095–1105. doi: 10.1038/leu.2008.30. [DOI] [PubMed] [Google Scholar]
- 53.Pimentel H., Parra M., Gee S., Ghanem D., An X., Li J., Mohandas N., Pachter L., Conboy J.G. A dynamic alternative splicing program regulates gene expression during terminal erythropoiesis. Nucleic Acids Res. 2014;42:4031–4042. doi: 10.1093/nar/gkt1388. [DOI] [PMC free article] [PubMed] [Google Scholar]
- 54.Tan J.S., Mohandas N., Conboy J.G. High frequency of alternative first exons in erythroid genes suggests a critical role in regulating gene function. Blood. 2006;107:2557–2561. doi: 10.1182/blood-2005-07-2957. [DOI] [PMC free article] [PubMed] [Google Scholar]
- 55.Shabalina S.A., Spiridonov A.N., Spiridonov N.A., Koonin E.V. Connections between alternative transcription and alternative splicing in mammals. Genome Biol. Evol. 2010;2:791–799. doi: 10.1093/gbe/evq058. [DOI] [PMC free article] [PubMed] [Google Scholar]
- 56.Trapnell C., Hendrickson D.G., Sauvageau M., Goff L., Rinn J.L., Pachter L. Differential analysis of gene regulation at transcript resolution with RNA-seq. Nat. Biotechnol. 2013;31:46–53. doi: 10.1038/nbt.2450. [DOI] [PMC free article] [PubMed] [Google Scholar]
- 57.Wong P., Hattangadi S.M., Cheng A.W., Frampton G.M., Young R.A., Lodish H.F. Gene induction and repression during terminal erythropoiesis are mediated by distinct epigenetic changes. Blood. 2011;118:e128–e138. doi: 10.1182/blood-2011-03-341404. [DOI] [PMC free article] [PubMed] [Google Scholar]
- 58.Bach I., Carriere C., Ostendorff H.P., Andersen B., Rosenfeld M.G. A family of LIM domain-associated cofactors confer transcriptional synergism between LIM and Otx homeodomain proteins. Genes Dev. 1997;11:1370–1380. doi: 10.1101/gad.11.11.1370. [DOI] [PubMed] [Google Scholar]
- 59.Manetopoulos C., Hansson A., Karlsson J., Jonsson J.I., Axelson H. The LIM-only protein LMO4 modulates the transcriptional activity of HEN1. Biochem. Biophys. Res. Commun. 2003;307:891–899. doi: 10.1016/s0006-291x(03)01298-1. [DOI] [PubMed] [Google Scholar]
- 60.Chambers S.M., Boles N.C., Lin K.Y., Tierney M.P., Bowman T.V., Bradfute S.B., Chen A.J., Merchant A.A., Sirin O., Weksberg D.C., et al. Hematopoietic fingerprints: an expression database of stem cells and their progeny. Cell Stem Cell. 2007;1:578–591. doi: 10.1016/j.stem.2007.10.003. [DOI] [PMC free article] [PubMed] [Google Scholar]
- 61.Hopwood N.D., Pluck A., Gurdon J.B. MyoD expression in the forming somites is an early response to mesoderm induction in Xenopus embryos. EMBO J. 1989;8:3409–3417. doi: 10.1002/j.1460-2075.1989.tb08505.x. [DOI] [PMC free article] [PubMed] [Google Scholar]
- 62.Gianakopoulos P.J., Mehta V., Voronova A., Cao Y., Yao Z., Coutu J., Wang X., Waddington M.S., Tapscott S.J., Skerjanc I.S. MyoD directly up-regulates premyogenic mesoderm factors during induction of skeletal myogenesis in stem cells. J. Biol. Chem. 2011;286:2517–2525. doi: 10.1074/jbc.M110.163709. [DOI] [PMC free article] [PubMed] [Google Scholar]
- 63.Bouchard M., Pfeffer P., Busslinger M. Functional equivalence of the transcription factors Pax2 and Pax5 in mouse development. Development. 2000;127:3703–3713. doi: 10.1242/dev.127.17.3703. [DOI] [PubMed] [Google Scholar]
- 64.Leder S., Weber Y., Altafaj X., Estivill X., Joost H.G., Becker W. Cloning and characterization of DYRK1B, a novel member of the DYRK family of protein kinases. Biochem. Biophys. Res. Commun. 1999;254:474–479. doi: 10.1006/bbrc.1998.9967. [DOI] [PubMed] [Google Scholar]
- 65.Geiger J.N., Knudsen G.T., Panek L., Pandit A.K., Yoder M.D., Lord K.A., Creasy C.L., Burns B.M., Gaines P., Dillon S.B., et al. mDYRK3 kinase is expressed selectively in late erythroid progenitor cells and attenuates colony-forming unit-erythroid development. Blood. 2001;97:901–910. doi: 10.1182/blood.v97.4.901. [DOI] [PubMed] [Google Scholar]
- 66.Djavani M., Crasta O.R., Zhang Y., Zapata J.C., Sobral B., Lechner M.G., Bryant J., Davis H., Salvato M.S. Gene expression in primate liver during viral hemorrhagic fever. Virol. J. 2009;6:20. doi: 10.1186/1743-422X-6-20. [DOI] [PMC free article] [PubMed] [Google Scholar]
- 67.Dore L.C., Amigo J.D., Dos Santos C.O., Zhang Z., Gai X., Tobias J.W., Yu D., Klein A.M., Dorman C., Wu W., et al. A GATA-1-regulated microRNA locus essential for erythropoiesis. Proc. Natl. Acad. Sci. U. S. A. 2008;105:3333–3338. doi: 10.1073/pnas.0712312105. [DOI] [PMC free article] [PubMed] [Google Scholar]
- 68.Wang F., Zhu Y., Guo L., Dong L., Liu H., Yin H., Zhang Z., Li Y., Liu C., Ma Y., et al. A regulatory circuit comprising GATA1/2 switch and microRNA-27a/24 promotes erythropoiesis. Nucleic Acids Res. 2013;42:442–457. doi: 10.1093/nar/gkt848. [DOI] [PMC free article] [PubMed] [Google Scholar]
- 69.Rasmussen K.D., Simmini S., Abreu-Goodger C., Bartonicek N., Di Giacomo M., Bilbao-Cortes D., Horos R., Von Lindern M., Enright A.J., O'Carroll D. The miR-144/451 locus is required for erythroid homeostasis. J Exp. Med. 2010;207:1351–1358. doi: 10.1084/jem.20100458. [DOI] [PMC free article] [PubMed] [Google Scholar]
- 70.Zhu Y., Wang D., Wang F., Li T., Dong L., Liu H., Ma Y., Jiang F., Yin H., Yan W., et al. A comprehensive analysis of GATA-1-regulated miRNAs reveals miR-23a to be a positive modulator of erythropoiesis. Nucleic Acids Res. 2013;41:4129–4143. doi: 10.1093/nar/gkt093. [DOI] [PMC free article] [PubMed] [Google Scholar]
- 71.Felli N., Fontana L., Pelosi E., Botta R., Bonci D., Facchiano F., Liuzzi F., Lulli V., Morsilli O., Santoro S., et al. MicroRNAs 221 and 222 inhibit normal erythropoiesis and erythroleukemic cell growth via kit receptor down-modulation. Proc. Natl. Acad. Sci. U. S. A. 2005;102:18081–18086. doi: 10.1073/pnas.0506216102. [DOI] [PMC free article] [PubMed] [Google Scholar]
- 72.Wang F., Yu J., Yang G.H., Wang X.S., Zhang J.W. Regulation of erythroid differentiation by miR-376a and its targets. Cell Res. 2011;21:1196–1209. doi: 10.1038/cr.2011.79. [DOI] [PMC free article] [PubMed] [Google Scholar]
- 73.McLeod D.L., Shreeve M.M., Axelrad A.A. Improved plasma culture system for production of erythrocytic colonies in vitro: quantitative assay method for CFU-E. Blood. 1974;44:517–534. [PubMed] [Google Scholar]
- 74.Trapnell C., Pachter L., Salzberg S.L. TopHat: discovering splice junctions with RNA-Seq. Bioinformatics. 2009;25:1105–1111. doi: 10.1093/bioinformatics/btp120. [DOI] [PMC free article] [PubMed] [Google Scholar]
- 75.Tanabe O., McPhee D., Kobayashi S., Shen Y., Brandt W., Jiang X., Campbell A.D., Chen Y.T., Chang C., Yamamoto M., et al. Embryonic and fetal beta-globin gene repression by the orphan nuclear receptors, TR2 and TR4. EMBO J. 2007;26:2295–2306. doi: 10.1038/sj.emboj.7601676. [DOI] [PMC free article] [PubMed] [Google Scholar]
- 76.Sartor M.A., Mahavisno V., Keshamouni V.G., Cavalcoli J., Wright Z., Karnovsky A., Kuick R., Jagadish H.V., Mirel B., Weymouth T., et al. ConceptGen: a gene set enrichment and gene set relation mapping tool. Bioinformatics. 2010;26:456–463. doi: 10.1093/bioinformatics/btp683. [DOI] [PMC free article] [PubMed] [Google Scholar]
- 77.Kanehisa M., Goto S., Sato Y., Furumichi M., Tanabe M. KEGG for integration and interpretation of large-scale molecular data sets. Nucleic Acids Res. 2012;40:D109–D114. doi: 10.1093/nar/gkr988. [DOI] [PMC free article] [PubMed] [Google Scholar]
Associated Data
This section collects any data citations, data availability statements, or supplementary materials included in this article.