

Abstract
Genome-wide association studies have identified variants, primarily common, that are associated with coronary artery disease or myocardial infarction (MI), but have not tested the majority of the low frequency and rare variation in the genome. We explored the hypothesis that previously untested low frequency (1–5% minor allele frequency) and rare (<1% minor allele frequency) coding variants are associated with MI. We genotyped 2906 MI cases and 6738 non-MI controls from Norway using the Illumina HumanExome Beadchip, allowing for direct genotyping of 85 972 polymorphic coding variants as well as 48 known GWAS SNPs. We followed-up 34 coding variants in an additional 2350 MI cases and 2318 controls from Norway. We evaluated exome array coverage in a subset of these samples using whole exome sequencing (N = 151). The exome array provided successful genotyping for an estimated 72.5% of Norwegian loss-of-function or missense variants with frequency >1% and 66.2% of variants <1% frequency observed more than once. Despite 80% power in the two-stage study (N = 14 312) to detect association with low-frequency variants with high effect sizes [odds ratio (OR) >1.86 and >1.36 for 1 and 5% frequency, respectively], we did not identify any novel genes or single variants that reached significance. This suggests that low-frequency coding variants with large effect sizes (OR >2) may not exist for MI. Larger sample sizes may identify coding variants with more moderate effects.
INTRODUCTION
Recent genome-wide association studies (GWAS) have discovered 47 loci associated with coronary artery disease (CAD), most of which are also associated with myocardial infarction (MI) (1–4). While the CAD-associated variants typically have minor allele frequency (MAF) > 5%, they have small individual effect sizes and collectively explain <10% of the heritability in MI (1) which is estimated to be 40–60% (5,6).
Since these common variants explain only a fraction of the heritability, other factors must contribute. Multiple possible scenarios have been proposed for this ‘missing heritability’ such as: common variants with small effects (7); additional variants at known loci (8); overestimates of the heritable component due to familial aggregation of environmental factors (9); inaccuracies in the statistical estimation of heritability (9); and low-frequency (1–5% MAF) or rare (<1% MAF) variants with larger effect sizes (10,11).
The majority of low-frequency (1–5%) and rare (<1%) variants have not been included in modern GWAS arrays and typically cannot be imputed from modern reference panels based on HapMap or 1000 Genome Project samples. While exome sequencing studies have successfully uncovered many low-frequency and rare coding variants (12), few studies have systematically evaluated their associations with complex traits (13), often due to lack of power stemming from small sample sizes. Several groups have now shown that a more cost-effective genotyping array-based approach can be a valuable tool for interrogating the impact of coding variation, much of which is low-frequency, on complex traits (14–17).
To systematically evaluate the potential contribution of low-frequency and rare coding variants to the risk of MI, we carried out exome array-based genotyping on a MI case and control sample taken from a homogenous population-based cohort in Norway. Specifically, we addressed the question of whether untested low-frequency and rare coding variants exist with moderate to high effect sizes as proposed (10,11). Exome array-based genotyping was carried out on 205 318 predicted coding variants in 9644 samples, including 2906 MI cases, from the Nord-Trøndelag Health Study (HUNT). We performed follow-up genotyping of the most promising signals in an additional 4668 Norwegian MI cases and controls from a separate Norwegian population-based cohort: the Tromsø study. Our combined sample of 14 312 individuals was well-powered to detect low-frequency variants with moderate to high effect on risk of MI [odds ratio (OR) >1.86 for variants with MAF > 1%].
RESULTS
Our first goal was to evaluate the coverage of the exome array. To do this, we estimated the number of coding variants present in 151 Norwegian individuals using exome sequencing (75 MI cases and 76 controls, 45× average depth). We identified 46 864 coding variants genome-wide, of which 33 387 had <5% minor allele frequency (Table 1). Using the Illumina HumanExome Beadchip array, designed to capture a large fraction of coding variants observed in European individuals, we genotyped the 151 exome sequenced samples and examined array coverage of variants detected by sequencing. The array captured a large fraction of loss-of-function (LoF) and missense variation observed in the sequenced samples (72.5% and 66.2% for variants with MAF >5 and >1%, respectively). Of 8706 rare LoF or missense variants (<1% frequency) identified in sequenced individuals and with two or more copies, suggesting they are unlikely to be sequencing artifacts, we directly genotyped 5767 (66.2%) with the array (Table 1).
Table 1.
Coverage of coding variation on exome array
| Variant type | Polymorphic variants on exome array |
Comparison to exome sequenced samples |
||||
|---|---|---|---|---|---|---|
| Frequency in N = 9644 | Number of variants genotyped by exome array (N = 9644) | Frequency in N = 151 | Number of variants identified by exome sequencing (N = 151) | Number of variants identified by exome sequencing on exome array | Percentage of variants identified by exome sequencing on exome array | |
| LoF (splice, nonsense, read-through) | >5% | 174 | >5% | 353 | 205 | 58.1 |
| 1–5% | 115 | 1–5% | 255 | 137 | 53.7 | |
| 6 Copies—1% | 1012 | 2 Copies—1% | 280 | 118 | 42.1 | |
| 1–5 Copies | 992 | 1 Copy | 612 | 193 | 31.5 | |
| Missense | >5% | 11 174 | >5% | 13 124 | 9610 | 73.2 |
| 1–5% | 7841 | 1–5% | 9012 | 6534 | 72.5 | |
| 6 Copies—1% | 35 792 | 2 Copies—1% | 8426 | 5649 | 67.0 | |
| 1–5 Copies | 28 872 | 1 Copy | 14 802 | 6222 | 42.0 | |
| LoF | ≥6 Copies | 1301 | ≥2 Copies | 888 | 460 | 51.8 |
| Missense | ≥6 Copies | 54 807 | ≥2 Copies | 30 562 | 21 793 | 71.3 |
| LoF + missense | ≥6 Copies | 56 108 | ≥2 Copies | 31 450 | 22 253 | 70.8 |
| CAD GWAS (non-coding) | All frequencies | 45 (48) | All frequencies | 45 (48) | 45 (48) | 100 |
This table shows HumanExome Beadchip exome array coverage (QC + polymorphic variants) of variants identified by exome sequencing a subset of the samples. Sequencing-based variant calls are derived from moderate-depth exome sequencing (average depth of 45× in coding regions) in a sample of 151 Norwegian (HUNT study) samples. Variants were annotated relative to ANNOVAR (version 2012-05-25 with hg19 as reference genome) (18). The exome array contains 45 directly genotyped CAD GWAS markers (and three high-r2 proxies) as published by Deloukas et al. (2013) (1), Kathiresan et al. (2008) (3) and Schunkert et al. (2011) (4). CAD, coronary artery disease. LoF, loss-of-function.
Having confirmed that a large fraction of overall and low-frequency coding variation was captured by the exome array, we next tested the power of our sample to detect association with low-frequency variants with moderate to large effect sizes. We declared an alpha level for significance of 7 × 10⁻⁷ reflecting 73 653 single-variant tests with minor allele count (MAC) > 5. For gene-based burden tests we set the significance threshold to 1 × 10⁻⁶ to account for 37 607 gene models tested. Modeling our two-stage design (19), the jointly analyzed sample set of 14 312 individuals provided 80% power to detect variants, or a gene burden, of 1% frequency (1/100) and an OR of at least 1.86, or with 5% frequency and OR > 1.36 (Supplementary Material, Fig. S1).
In Stage 1 (see Materials and Methods), we genotyped 85 972 polymorphic coding variants and 48 GWAS variants in 9644 individuals taken from the HUNT study (20) using the exome array: 2906 medical-record confirmed MI cases and 6738 controls. We first selected 2906 birth year and sex-matched healthy controls without cardiovascular disease, diabetes, hypertension and no reported first or second degree relatives with cardiovascular disease (see Materials and Methods for details) to maximize our ability to detect association with genetic variants that impact MI. In addition, we included 3833 non-MI controls from the same cohort available from a separate study of high-density lipoprotein (HDL) cholesterol extremes. Analysis performed either with or without the additional controls was found to be highly consistent, thus we report results from the combined control set. Clinical characteristics for the genotyped individuals are summarized in Supplementary Material, Table S1.
To test if our approach and MI phenotype definition were sufficient to detect association with MI, we examined evidence for association with previously identified GWAS variants present on the array (Fig. 1). Of 51 variants in 47 loci previously reported to be associated with CAD or MI by large-scale GWAS (1,3,4), 48 variants from 44 loci were tested in our sample (45 directly tested, 3 with high-r2 proxies). We observed a direction of effect consistent with published reports for 45 of the 48 CAD variants which is significantly different from the null expectation of 50% (Pbinomial = 1 × 10⁻¹⁰; Supplementary Material, Table S2). We also observed an excess of suggestive P-values (10 with P-value <0.01) for known variants compared with expectation under the null hypothesis of no association (Pbinomial = 4 × 10⁻¹¹). We further confirmed association with MI using a combined weighted allele score for the 48 previously reported variants (P = 1 × 10⁻²⁸) and demonstrated that the risk of MI is higher for individuals with higher genetic risk scores (Fig. 2).
Figure 1.
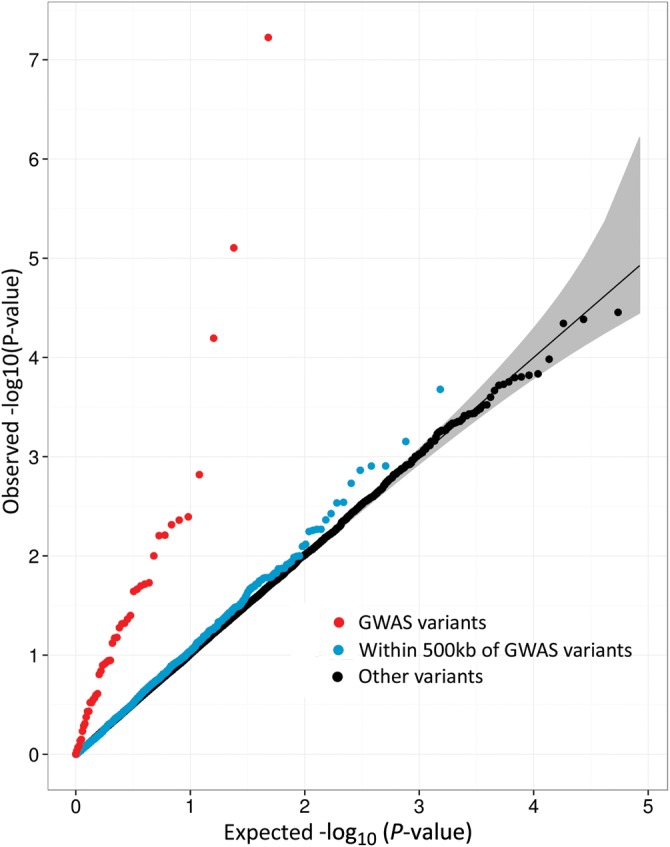
Quantile–quantile (QQ) plots of single-variant analysis results of myocardial infarction. This figure shows quantile–quantile plots for single-variant association with myocardial infarction status in Stage 1 samples (N = 9644) for: 48 GWAS variants as previously published (1,3,4) represented on the exome array (red), all coding variants within 500 kb of CAD GWAS lead SNPs (blue) (1,3,4), and all other coding variants tested (black). The expectation under the null hypothesis is a thin black line at x = y, and the 95% confidence interval (CI) is shown in gray.
Figure 2.
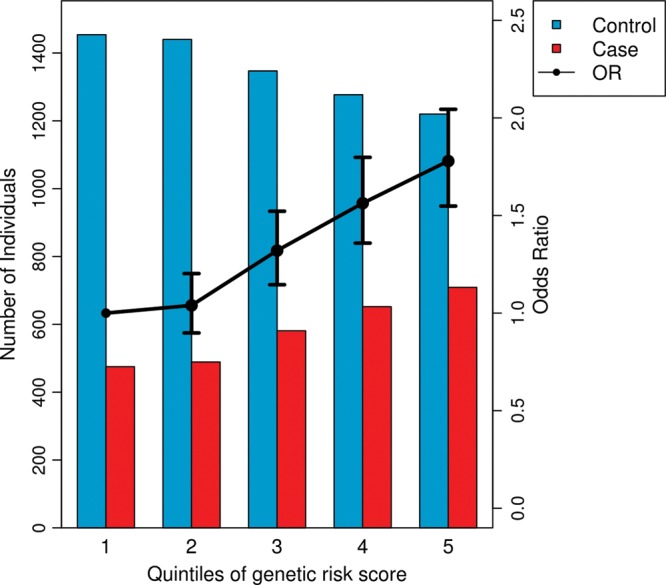
CAD genetic risk score categories and risk for MI based on previously identified CAD SNPs. This figure shows an increased risk of MI (OR >1) for individuals with higher weighted genetic risk scores based on 48 CAD GWAS variants. The black line shows ORs and 95% CIs for association with MI for individuals grouped into risk score quintiles compared with the first quintile (labels on right vertical axis). Compared with the first quintile, the second to fifth quintiles have ORs 1.04, 1.32, 1.56 and 1.78, respectively, and 95% CIs [0.90, 1.20], [1.15, 1.52], [1.36, 1.80] and [1.55, 2.04], respectively. The risk scores were calculated for individuals in the Stage 1 sample (N = 9644) for 45 previously identified CAD variants that were directly typed on the exome array and three proxy markers in high linkage disequilibrium (LD) with the previously identified CAD variants (1,3,4). By testing all individuals in a regression framework, the genetic risk score was strongly associated with MI (P = 1 × 10⁻²⁸). Alleles were weighted by their published effect sizes. The bars represent the number of MI cases (red bars) and controls (blue bars) in each risk score quintile (labels on left vertical axis).
Examining the 48 CAD GWAS variants individually, the strongest evidence for association with MI in the 9644 individuals was observed in the CDKN2B cluster at the 9p21 locus for an intergenic variant 3 kb downstream of CDKN2B-AS1 (rs10757278, MAF = 47.7%, OR = 1.20, PStage 1 = 4 × 10⁻⁸; Table 2). Several SNPs in the 9p21 region have previously been shown to be associated with CAD (1,21).
Table 2.
Genome-wide significant single-variant association with myocardial infarction
| Stage 1 (N = 9644) |
Stage 2 (N = 4668) |
Combined (N = 14 312) |
||||||||||
|---|---|---|---|---|---|---|---|---|---|---|---|---|
| Gene | Position | SNP | Variant | MAF (%) | OR (95% CI) | P-value | MAF (%) | OR (95% CI) | P-value | MAF (%) | OR (95% CI) | P-value |
| LPA | 6:160961137 | rs3798220 | Ile1891Met | 1.9 | 1.67 (1.33–2.09) | 8 × 10⁻⁶ | 1.4 | 1.78 (1.24–1.56) | 2 × 10⁻³ | 1.8 | 1.70 (1.40–2.06) | 5 × 10⁻⁸ |
| 9p21 | 9:22124477 | rs10757278 | Non-coding | 47.7 | 1.20 (1.12–1.28) | 4 × 10⁻⁸ | – | – | nt | – | – | nt |
Positions are given for hg19 (chromosome:base pair position). The ‘Variant’ column lists predicted changes in amino acid sequence relative to ANNOVAR (version 2012-05-25 with hg19 as reference genome) (18). OR are reported for the minor allele. MAF, minor allele frequency; CI, confidence interval; nt, not tested.
We next examined all assayed coding variation across the genome for association with MI using single-variant association tests with age, sex and 10 ancestry informative principal components as covariates. Focusing on low-frequency variation, we selected variants for follow-up with; P < 1 × 10⁻³ in the preliminary analysis using matched controls, MAF < 10%, and MAC >5. Follow-up genotyping was performed in an additional 4668 Norwegian individuals from the Tromsø study (22): 2350 MI cases and 2318 non-MI controls (Stage 2; see Materials and Methods). Thus, the total sample size available for these 24 variants was 14 312.
In the combined analysis, one low-frequency coding variant reached the threshold for study-wide significance; the variant encoding p.Ile1891Met in the Lipoprotein A (LPA) gene (rs3798220, MAF = 1.9%, OR = 1.67, P = 5 × 10⁻⁸; Table 2). This variant, which was previously known as p.Ile4399Met, is part of the SLC22A3-LPAL2-LPA gene cluster located at 6q26-27 that has previously been associated with CAD (1,23,24) and apolipoprotein(a) levels (25). No other variants reached exome-wide significance (P < 7 × 10⁻⁷) in the combined sample; top results for single-variant tests of the combined analysis are given in Table 2 and Supplementary Material, Table S4. To test for potential dominant or recessive effects of coding variants, we also performed single-variant association tests using these models. No additional variants reached exome-wide significance (data not shown).
We searched previously annotated biological pathways to test for over-representation of variants associated with MI using gene set enrichment analysis as implemented in MAGENTA (26). We identified one enriched pathway (B-cell proliferation) across five loci using a relaxed single-variant threshold in our combined Stage 1 sample (P < 10−3, N = 9644; Supplementary Material, Table S5). This pathway does not include known CAD genes.
To increase power to detect MI association with low-frequency and rare variants, we combined evidence across these variants in each gene using burden tests. We used two approaches to either weight variants by the inverse of their frequency (SKAT-O) (27) or test a variety of allele frequency thresholds for exclusion of common variants (VT) (28). We examined (i) all non-synonymous variants (including splice), (ii) only those variants predicted to be LoF (premature stop, read-through or splice) and (iii) LoF and ‘probably damaging’ missense variants as defined by Polyphen-2 (29). The tests showed an excess of suggestive P-values (P-values <0.01) when analyzing all non-synonymous variants (1.5-fold excess, Pbinomial = 8 × 10⁻⁸) and LoF or probably damaging variants (Pbinomial = 0.02; Supplementary Material, Fig. S2), although no genes reached our significance threshold (P < 1 × 10⁻⁶) in Stage 1 (Supplementary Material, Table S6). Preliminary analysis of MI cases and the matched control set identified seven genes with P < 5 × 10⁻⁴ and at least six individuals carrying a burden of rare allele(s). Within these seven genes we successfully genotyped in the follow-up sample 11 variants that individually reached P < 0.10 in Stage 1 samples. After follow-up, no genes reached exome-wide significance (P < 1 × 10⁻⁶) in Stage 1 + 2 samples using gene-based tests (Supplementary Material, Tables S6B and S7).
We extended the burden tests to aggregate individuals with rare variants (MAF < 1%) in genes that belong to the same pathway (defined by Gene Ontology) (30). These pathway-based burden tests identified one significant pathway related to lipid metabolism, low-density lipoprotein-mediated lipid transport (P < 5 × 10⁻⁵), which included two known CAD genes (LPA and APOB; Supplementary Material, Table S8).
To more carefully examine candidate MI/CAD and lipid related genes, we selected genes within 500 kb of known GWAS signals for CAD or lipids. We applied a reduced significance threshold to account for the multiple testing burden for any single-variant test (N = 7635 variants, P < 6.5 × 10⁻⁵) or gene-based burden test (N = 1635 gene-based tests, P < 3 × 10⁻⁵) in these regions. No additional variants or genes reached these reduced thresholds for significance (Supplementary Material, Fig. S4 and Table S9).
Having been unable to identify any novel variants, genes or pathways associated with MI, we next examined the proportion of genetic heritability that could be explained by rare coding variants (MAF < 1%), low-frequency coding variants (MAF 1–5%) and common coding variants (MAF > 5%). Using a linear mixed model as implemented in the GCTA software (31), we found that the 56 108 coding variants genotyped together explained 15.9% of the trait variance. Intriguingly, rare variants (6 copies—1% MAF) explained a slightly higher proportion of the variance (10.9%) compared with common variation (MAF > 5%, 7.4% of variance explained; Table 3).
Table 3.
Proportion of variance explained by variants in different frequency strata
| Frequency of variant | Proportion of variance explained using Stage 1 samples (N = 9644) |
Proportion of variance explained using matched controls only (N = 5785) |
||
|---|---|---|---|---|
| All variants (%) | Coding variants (%) | All variants (%) | Coding variants (%) | |
| >5% | 11.6 | 7.4 | 16.1 | 10.8 |
| 1–5% | 2.2 | 1.7 | 3. 9 | 3.8 |
| 6 Copies ∼1% | 11.1 | 10.9 | 11.9 | 12.3 |
| All (>6 Copies) | 18.3 | 15.9 | 23.7 | 21.6 |
This table shows proportion of variance explained by genetic variants in different frequency strata as estimated by GCTA software (31) for our Stage 1 samples as described in Supplementary Material, Table S1. The increase in variance explained by ‘All variants’ in comparison to coding variants for the frequency >5% stratum is due to the inclusion of known GWAS variants.
Lastly, to investigate whether putatively associated variants were present at reduced significant thresholds, we examined the observed and expected number of significantly associated coding variants at several thresholds (P < 0.01, 1 × 10⁻³ and 1 × 10⁻⁴). As expected for a polygenic phenotype where power was limited to find the underlying genetic effects, we observed an excess of coding variants for several of the frequency strata (Supplementary Material, Table S10) suggesting additional association results will be identified in larger studies.
DISCUSSION
To study the contribution of coding variants to susceptibility of a common complex disease, we evaluated 85 972 polymorphic coding variants across the allele frequency spectrum for association with MI, with a particular focus on rare and low-frequency variation. We identified an association with a variant encoding p.Ile1891Met in LPA and with common non-coding variants at 9p21 near the CDKN2B gene cluster, showing that our approach and phenotype definition were sufficient to detect association. Although we had 80% power to detect association with low-frequency variants (MAF 1–5%) with moderate or high effect sizes (OR > 1.86), we did not identify any novel genes or single variants that reached statistical significance in up to 14 312 individuals.
Our inability to find novel rare or low-frequency variants associated with MI, despite being reasonably well-powered, suggest that low-frequency variants with very large effect (OR > 2) may not account for the missing heritability of MI. However, identifying: (i) an excess of results at thresholds below study-wide significance levels, and (ii) evidence that rare coding variants accounting for a higher proportion of the trait variance than common coding variants, suggests that rare disease-associated coding variants may be found in larger samples. We also cannot rule out the possibility that low-frequency variants with large effects exist in other ethnic groups or severely affected families.
Very rare LoF variants (<0.1% frequency), potentially with large impacts on disease risk, were not well captured by this exome array-based approach. In addition, we estimated that 20–30% of the rare and low-frequency coding variation in Norwegians was not directly evaluated by this approach. To fully evaluate the impact of rare variation on MI susceptibility, we will likely need to perform sequencing on reasonably large numbers of samples, possibly tens of thousands of cases and similar numbers of controls, and/or extend this analysis of coding variants into larger sample sizes.
MATERIALS AND METHODS
Stage 1 study population
We selected 2969 MI cases and 6738 non-MI controls from the HUNT study. The HUNT study is a comprehensive population-based health study (www.ntnu.edu/hunt) with personal and family medical histories on 106 436 people from Nord-Trøndelag County, Norway, collected in three surveys (HUNT 1, 2 and 3) (20). Inviting all residents ≥20 years of age, self-reported questionnaires, clinical examinations and non-fasting venous blood samples were available on 65 237 individuals from HUNT 2 (1995–1997; 71% of invited) and 48 290 individuals from HUNT 3 (2006–2008; 52% of invited). Information on first and second degree relationships was made available from the National Population Register and generated based on 106 436 individuals registered in one of the three surveys.
Cases were retrospectively identified as HUNT 2 and HUNT 3 participants diagnosed with acute MI (ICD-10 I21 or ICD-9 410) in the medical departments at the two local hospitals in Nord-Trøndelag County from December 1987 to June 2011. Linkage between the electronic diagnosis registry and HUNT was made possible through an 11-digit national identity number unique to every citizen of Norway. Age at earliest MI incident was registered for subjects with more than one MI admission. In the case of affected relative pairs, we selected one per family by including the individual with the earliest age of MI.
Initially, 2968 non-CAD controls were selected among HUNT 2 and HUNT 3 participants with available DNA (N = 70 300) after excluding individuals with the following hospital diagnosed or self-reported conditions in themselves or known first and/or second degree family members: MI, angina, heart failure, stroke, aortic aneurysm, atherosclerosis, intermittent claudication and registered percutaneous coronary angioplasty procedures or bypass surgery. In addition, for individuals <80 years of age, we excluded individuals with diabetes, self-reported use of antihypertensive medication and hospital diagnosed hypertension or hyperlipidemia. Of 15 841 remaining individuals <80 years of age (22 389 individuals for all age groups), we selected one control for each case by matching on sex, birth year (±1 year), and municipality or geographical region to minimize population stratification (Supplementary Material, Table S11). In addition, 3833 non-MI controls were included from the same cohort from a separate study of HDL extremes. Clinical characteristics are described in Supplementary Material, Table S1.
Stage 1 sample genotyping
DNA was extracted from peripheral blood leukocytes from whole blood or blood clots stored in the HUNT Biobank, using the Puregene kit (Gentra Systems, Minneapolis, MN) or with an Autopure LS (Gentra Systems) (20).
Genotyping of 2969 cases and 2968 controls were carried out at the Norwegian University of Science and Technology, Norway, using the iSelect Exomechip V1.0 (Illumina, San Diego, CA) and the Infinium HD ultra protocol. Each 96-well plate included both case and control individuals in random order and one sample of reference DNA that was present on every plate. Genotype calling was done using GenTrain version 2.0 in GenomeStudio V2011.1 (Illumina, San Diego, CA) followed by zCall version 2.2 (32). Genotyping of 3919 additional controls and 43 additional cases was performed by the University of Washington Resequencing and Genotyping Laboratory Center of NHLBI. Genotype clusters were generated separately for the samples genotyped at the Norwegian University of Science and Technology (N = 5937) and the University of Washington (N = 3919). Genotype calls from the two groups were combined prior to quality control procedures.
Samples with <99% genotype completion rate (N = 11), evidence of gender discrepancy (N = 9), duplicates (N = 47) and/or heterozygosity rate ±3 standard deviations from the mean (N = 184) as well as potential outliers identified by plotting the first 10 genotype-driven principle components (N = 8) were excluded from further analysis (N = 255, 2.58%). In addition, variants that did not meet a 99.9% genotyping threshold or showed deviation from Hardy–Weinberg equilibrium (P < 1 × 10⁻⁴) were removed (7904 SNPs). To avoid batch effects, we excluded genotype data from the additional controls for variants that demonstrated allele frequency differences between the non-MI control samples from the two genotyping centers, or between all samples at the two genotype centers (N = 48 variants, P < 1 × 10⁻⁴). After quality assessment, 234 997 variants (96.7%) genotyped in up to 9644 individuals (96.5% of cases and 97.8% of controls) remained for further analysis.
Of the 234 997 variants passing quality control, 105 112 were found to be polymorphic. Of the polymorphic variants, 85 972 were coding variants (LoF or missense) and 74 624 (86.8%) of these had a frequency <5%. The number of coding variants available for single-variant tests was 56 108 (MAC ≥6). The number of variants genotyped with different frequencies is given in Table 1.
Exome sequencing
We performed exome sequencing on 75 cases and 76 controls at the University of Michigan DNA Sequencing Core using Illumina Hi-Seq machines. Exome enrichment was carried out using the SeqCap EZ Human Exome Library v3.0 (Roche NimbleGen, Madison, WI), with 45× average coverage for target regions. Non-reference genotype concordance for sequence-based genotypes and exome array genotypes was 99.4% for variants >5% frequency, 99.7% for variants with 1–5% frequency, and 99.5% for variants with frequency <1%.
Stage 2 study population and sample genotyping
We selected 2364 MI cases and 2330 controls from the Tromsø study (Tromsø 4) for follow up. Tromsø 4 was a population-based study conducted in 1994–1995 with questionnaires, clinical examination and non-fasting venous blood samples (stored at HUNT biobank) from 27 158 individuals of 25 years of age and older from the municipality of Tromsø, Norway (22). Cases of incident MI were identified by linkage to the diagnosis registry at the University Hospital of North Norway (the only hospital in the region) and to the National Causes of Death Registry from the date of enrollment to the end of the study period, 31 December 2010. Adjudication of hospitalized and out-of hospital events was performed by an independent endpoint committee using data from hospital and out-of-hospital journals, autopsy records and death certificates. Slightly modified World Health Organization MONICA/MORGAM criteria for MI were used and included clinical symptoms and signs, findings in electrocardiograms, values of cardiac biomarkers and autopsy reports, when applicable. As in HUNT, age at earliest MI incident was registered for subjects with more than one MI admission. As controls, we selected individuals with no hospital diagnosed history of MI or self-reported history of cardiovascular disease among themselves or first and second degree relatives. Cases and controls were matched for sex and birth year (±2.5 years). Both the populations of Nord-Trøndelag County and Tromsø are ethnically homogenous (<3% non-Caucasian ethnicity), making it especially suitable for epidemiological genetic research (33).
We selected for replication single variants with P < 1 × 10⁻³, MAF < 10% and MAC) >5 in a preliminary dataset to capture variants less likely to be covered by GWAS but with enough variant alleles so that replication was still a possibility. We also selected SNPs contributing to burden tests if they had gene-wise P < 5 × 10⁻⁴, single SNP P < 0.05, and MAC > 5. We verified that gene-wise results had similar evidence of association using the subset of variants selected for follow-up (difference in log P < 0.5).
Overall, 37 SNPs were selected for replication: 25 single-variant SNPs and 12 gene-based SNPs passing our replication thresholds. Of the SNPs selected for replication, two single-variant SNPs and one gene-based SNP failed array design and were excluded prior to genotyping. We genotyped the remaining 34 SNPs in 4694 individuals at the Centre for Integrative Genetics (CIGENE), Ås, Norway, using iPLEX Gold MassARRAY technology (Sequenom, San Diego, CA). Samples with <97% genotype completion rate were removed (N = 26): 23 single-variant SNPs and 11 gene-based SNPs on 4668 individuals (99.4%) remained for further analysis (2350 MI cases and 2318 controls).
Statistical analyses
We determined statistical power using the power calculator CaTS (19) assuming ∼5% MI prevalence in the HUNT study (equivalent to 3510 MI cases among 62 306 individuals with available DNA at the time of our study inclusion. We evaluated the impact of cryptic relatedness using a linear mixed model (EMMAX) (34) and found the results to be highly correlated with logistic regression (Pearson r2 = 0.77, P < 2.2 × 10⁻¹⁶). The linkage disequilibrium (LD) metric r2 was estimated using 5803 individuals from Stage 1 MI cases and matched controls that passed quality control.
Single-variant tests for association with MI case/control status were performed using logistic regression, with covariates for age, sex and ancestry informative principal components 1–10 derived from all common genetic variants as implemented in PLINK (35). Our study did not show evidence for inflated test statistics or population stratification (λGC overall = 1.03), nor when variants were grouped according to frequency (λGC MAF >5% = 1.11, λGC MAF 1–5% = 1.02, λGC MAF < 1% = 0.99).
We also performed conditional logistic regression accounting for CAD or MI GWAS index SNPs within 500 kb. Weighted allele scores were calculated by multiplying the sum of the effective allele dosage of the previously known CAD SNPs by their estimated log ORs from the combined analysis in the previous studies (1,3,4).
We performed gene-based and pathway-based burden tests using tests of association with rare variants weighted by allele frequency (SKAT-O) (27) and by using different frequency thresholds for inclusion of variants (VT) (28). We meta-analyzed results from the HUNT and Tromsø studies using standard error weighted fixed-effect methods implemented in METAL (36).
For gene-based burden tests, we declared a significance level of 7 × 10⁻⁷ corresponding to a Bonferroni correction for the 73 887 single-variant tests with MAC >5, and a 1.2 × 10⁻⁶ significance level for the 12 678 genes tested using two different models (38 210 tests overall): all non-synonymous variants (12 678 genes), variants predicted to be LoF (253 genes) and LoF and ‘probably damaging’ missense variants as defined by PolyPhen-2 (6174 genes). We set the significance level at P < 4 × 10⁻⁵ for the 1277 pathway-based tests performed using SKAT-O (27).
We estimated the contribution of variants with MAC >5 on the exome array to the MI heritability using a linear mixed model as implemented in the GCTA software (31). The proportion of variance of MI risk explained by rare (six copies ∼1%), low-frequency (1–5%) and common (>5%) variants was calculated adjusting for age, sex and the first 10 ancestry informative principal components.
A gene set enrichment analysis approach implemented in MAGENTA was used to identify potential predefined biological pathways that influence MI risk (26). Ten thousand nine hundred and ninety-two pathways that are annotated from the Kyoto Encyclopedia of Genes and Genomes (KEGG; N = 186) (37), Ingenuity (N = 92) (www.ingenuity.com), Protein Analysis Through Evolutionary Relationships (PANTHER; N = 634) (38), BioCarta (N = 217) (http://cgap.nci.nih.gov/Pathways/BioCarta_Pathways), Reactome (N = 430) (39) and Gene Ontology (N = 9433) (30) databases were tested. N is the number of pathways from each database.
Annotation
Variants were annotated as missense, splice, premature stop, read-through, synonymous or non-coding using ANNOVAR (Version 2012-05-15) (18). Variants are listed with respect to the hg19 genome build.
Ethics
Both the HUNT and Tromsø study were conducted according to the principles expressed in the Declaration of Helsinki. Attendance was voluntary, and each participant signed a written informed consent including information on genetic analyses. Our study was approved by the Regional Committees for Medical and Health Research Ethics (REC Central), Norway.
SUPPLEMENTARY MATERIAL
FUNDING
Support from the National Institutes of Health (grant numbers: HL094535, HL109946 and DK062370) and the Liaison Committee between the Central Norway Regional Authority and the Norwegian University of Science and Technology (grant: 2011/13806). Genotyping services for 3992 samples were provided by the Northwest Genomics Center at the University of Washington, Department of Genome Sciences, under US Federal Government contract number HHSN268201100037C from the National Heart, Lung, and Blood Institute. The funders had no role in study design, data collection and analysis, decision to publish or preparation of the manuscript.
Supplementary Material
ACKNOWLEDGEMENTS
The Nord-Trøndelag Health Study (The HUNT Study) is a collaboration between HUNT Research Centre (Faculty of Medicine, Norwegian University of Science and Technology NTNU), Nord-Trøndelag County Council, Central Norway Health Authority, and the Norwegian Institute of Public Health. The authors wish to thank all HUNT and Tromsø study participants who contributed to scientific research.
Conflict of Interest statement. None declared.
REFERENCES
- 1.CARDIoGRAMplusC4D Consortium. Deloukas P., Kanoni S., Willenborg C., Farrall M., Assimes T.L., Thompson J.R., Ingelsson E., Saleheen D., Erdmann J., et al. Large-scale association analysis identifies new risk loci for coronary artery disease. Nat. Genet. 2013;45:25–33. doi: 10.1038/ng.2480. [DOI] [PMC free article] [PubMed] [Google Scholar]
- 2.Ehret G.B., Munroe P.B., Rice K.M., Bochud M., Johnson A.D., Chasman D.I., Smith A.V., Tobin M.D., Verwoert G.C., et al. The International Consortium for Blood Pressure Genome-Wide Association Studies, Genetic variants in novel pathways influence blood pressure and cardiovascular disease risk. Nature. 2011;478:103–109. doi: 10.1038/nature10405. [DOI] [PMC free article] [PubMed] [Google Scholar]
- 3.Kathiresan S. Myocardial Infarction Genetics Consortium. A PCSK9 missense variant associated with a reduced risk of early-onset myocardial infarction. The N. Engl. J. Med. 2008;358:2299–2300. doi: 10.1056/NEJMc0707445. [DOI] [PubMed] [Google Scholar]
- 4.Schunkert H., Konig I.R., Kathiresan S., Reilly M.P., Assimes T.L., Holm H., Preuss M., Stewart A.F., Barbalic M., Gieger C., et al. Large-scale association analysis identifies 13 new susceptibility loci for coronary artery disease. Nat. Genet. 2011;43:333–338. doi: 10.1038/ng.784. [DOI] [PMC free article] [PubMed] [Google Scholar]
- 5.Zdravkovic S., Wienke A., Pedersen N.L., Marenberg M.E., Yashin A.I., De Faire U. Heritability of death from coronary heart disease: a 36-year follow-up of 20 966 Swedish twins. J. Intern. Med. 2002;252:247–254. doi: 10.1046/j.1365-2796.2002.01029.x. [DOI] [PubMed] [Google Scholar]
- 6.Lloyd-Jones D.M., Nam B.H., D’Agostino R.B., Sr, Levy D., Murabito J.M., Wang T.J., Wilson P.W., O’Donnell C.J. Parental cardiovascular disease as a risk factor for cardiovascular disease in middle-aged adults: a prospective study of parents and offspring. JAMA. 2004;291:2204–2211. doi: 10.1001/jama.291.18.2204. [DOI] [PubMed] [Google Scholar]
- 7.Yang J., Ferreira T., Morris A.P., Medland S.E. Madden P.A., Heath A.C., Martin N.G., Montgomery G.W., et al., editors. Genetic investigation of anthropometric traits (GIANT) consortium, DIAbetes genetics replication and meta-analysis (DIAGRAM) consortium, Madden. Conditional and joint multiple-SNP analysis of GWAS summary statistics identifies additional variants influencing complex traits. Nat. Genet. 2012;44:S361–S363. doi: 10.1038/ng.2213. 369–375. [DOI] [PMC free article] [PubMed] [Google Scholar]
- 8.Sanna S., Li B., Mulas A., Sidore C., Kang H.M., Jackson A.U., Piras M.G., Usala G., Maninchedda G., Sassu A., et al. Fine mapping of five loci associated with low-density lipoprotein cholesterol detects variants that double the explained heritability. PLoS Genet. 2011;7:e1002198. doi: 10.1371/journal.pgen.1002198. [DOI] [PMC free article] [PubMed] [Google Scholar]
- 9.Tenesa A., Haley C.S. The heritability of human disease: estimation, uses and abuses. Nat. Rev. Genet. 2013;14:139–149. doi: 10.1038/nrg3377. [DOI] [PubMed] [Google Scholar]
- 10.Eichler E.E., Flint J., Gibson G., Kong A., Leal S.M., Moore J.H., Nadeau J.H. Missing heritability and strategies for finding the underlying causes of complex disease. Nat. Rev. Genet. 2010;11:446–450. doi: 10.1038/nrg2809. [DOI] [PMC free article] [PubMed] [Google Scholar]
- 11.Cirulli E.T., Goldstein D.B. Uncovering the roles of rare variants in common disease through whole-genome sequencing. Nat. Rev. Genet. 2010;11:415–425. doi: 10.1038/nrg2779. [DOI] [PubMed] [Google Scholar]
- 12.Kiezun A., Garimella K., Do R., Stitziel N.O., Neale B.M., McLaren P.J., Gupta N., Sklar P., Sullivan P.F., Moran J.L., et al. Exome sequencing and the genetic basis of complex traits. Nat. Genet. 2012;44:623–630. doi: 10.1038/ng.2303. [DOI] [PMC free article] [PubMed] [Google Scholar]
- 13.Butterworth A.S., Braund P.S., Farrall M., Hardwick R.J., Saleheen D., Peden J.F., Soranzo N., Chambers J.C., Sivapalaratnam S., et al. The IBC 50K CAD Consortium. Large-scale gene-centric analysis identifies novel variants for coronary artery disease. PLoS Genet. 2011;7:e1002260. doi: 10.1371/journal.pgen.1002260. [DOI] [PMC free article] [PubMed] [Google Scholar]
- 14.Huyghe J.R., Jackson A.U., Fogarty M.P., Buchkovich M.L., Stancakova A., Stringham H.M., Sim X., Yang L., Fuchsberger C., Cederberg H., et al. Exome array analysis identifies new loci and low-frequency variants influencing insulin processing and secretion. Nat. Genet. 2013;45:197–201. doi: 10.1038/ng.2507. [DOI] [PMC free article] [PubMed] [Google Scholar]
- 15.Peloso G.M., Auer P.L., Bis J.C., Voorman A., Morrison A.C., Stitziel N.O., Brody J.A., Khetarpal S.A., Crosby J.R., Fornage M., et al. Association of low-frequency and rare coding-sequence variants with blood lipids and coronary heart disease in 56,000 whites and blacks. Am. J. Hum. Genet. 2014;94:223–232. doi: 10.1016/j.ajhg.2014.01.009. [DOI] [PMC free article] [PubMed] [Google Scholar]
- 16.Holmen O.L., Zhang H., Fan Y., Hovelson D.H., Schmidt E.M., Zhou W., Guo Y., Zhang J., Langhammer A., Lochen M.L., et al. Systematic evaluation of coding variation identifies a candidate causal variant in TM6SF2 influencing total cholesterol and myocardial infarction risk. Nat. Genet. 2014;46:345–351. doi: 10.1038/ng.2926. [DOI] [PMC free article] [PubMed] [Google Scholar]
- 17.Kozlitina J., Smagris E., Stender S., Nordestgaard B.G., Zhou H.H., Tybjaerg-Hansen A., Vogt T.F., Hobbs H.H., Cohen J.C. Exome-wide association study identifies a TM6SF2 variant that confers susceptibility to nonalcoholic fatty liver disease. Nat. Genet. 2014;46:352–356. doi: 10.1038/ng.2901. [DOI] [PMC free article] [PubMed] [Google Scholar]
- 18.Wang K., Li M., Hakonarson H. ANNOVAR: functional annotation of genetic variants from high-throughput sequencing data. Nucleic Acids Res. 2010;38:e164. doi: 10.1093/nar/gkq603. [DOI] [PMC free article] [PubMed] [Google Scholar]
- 19.Skol A.D., Scott L.J., Abecasis G.R., Boehnke M. Joint analysis is more efficient than replication-based analysis for two-stage genome-wide association studies. Nat. Genet. 2006;38:209–213. doi: 10.1038/ng1706. [DOI] [PubMed] [Google Scholar]
- 20.Krokstad S., Langhammer A., Hveem K., Holmen T., Midthjell K., Stene T., Bratberg G., Heggland J., Holmen J. Cohort profile: the HUNT Study, Norway. Int. J. Epidemiol. 2013;42:968–977. doi: 10.1093/ije/dys095. [DOI] [PubMed] [Google Scholar]
- 21.Helgadottir A., Thorleifsson G., Manolescu A., Gretarsdottir S., Blondal T., Jonasdottir A., Jonasdottir A., Sigurdsson A., Baker A., Palsson A., et al. A common variant on chromosome 9p21 affects the risk of myocardial infarction. Science. 2007;316:1491–1493. doi: 10.1126/science.1142842. [DOI] [PubMed] [Google Scholar]
- 22.Jacobsen B.K., Eggen A.E., Mathiesen E.B., Wilsgaard T., Njolstad I. Cohort profile: the Tromso Study. Int. J. Epidemiol. 2012;41:961–967. doi: 10.1093/ije/dyr049. [DOI] [PMC free article] [PubMed] [Google Scholar]
- 23.Luke M.M., Kane J.P., Liu D.M., Rowland C.M., Shiffman D., Cassano J., Catanese J.J., Pullinger C.R., Leong D.U., Arellano A.R., et al. A polymorphism in the protease-like domain of apolipoprotein(a) is associated with severe coronary artery disease. Arterioscler. Thromb. Vasc. Biol. 2007;27:2030–2036. doi: 10.1161/ATVBAHA.107.141291. [DOI] [PubMed] [Google Scholar]
- 24.Helgadottir A., Gretarsdottir S., Thorleifsson G., Holm H., Patel R.S., Gudnason T., Jones G.T., van Rij A.M., Eapen D.J., Baas A.F., et al. Apolipoprotein(a) genetic sequence variants associated with systemic atherosclerosis and coronary atherosclerotic burden but not with venous thromboembolism. J. Am. Coll. Cardiol. 2012;60:722–729. doi: 10.1016/j.jacc.2012.01.078. [DOI] [PubMed] [Google Scholar]
- 25.Clarke R., Peden J.F., Hopewell J.C., Kyriakou T., Goel A., Heath S.C., Parish S., Barlera S., Franzosi M.G., Rust S., et al. Genetic variants associated with Lp(a) lipoprotein level and coronary disease. The N. Engl. J. Med. 2009;361:2518–2528. doi: 10.1056/NEJMoa0902604. [DOI] [PubMed] [Google Scholar]
- 26.Segre A.V. Groop L., Mootha V.K., Daly M.J., Altshuler D., editors. DIAGRAM Consortium, MAGIC investigators. Common inherited variation in mitochondrial genes is not enriched for associations with type 2 diabetes or related glycemic traits. PLoS Genet. 2010;6 doi: 10.1371/journal.pgen.1001058. e1001058. [DOI] [PMC free article] [PubMed] [Google Scholar]
- 27.Lee S., Wu M.C., Lin X. Optimal tests for rare variant effects in sequencing association studies. Biostatistics. 2012;13:762–775. doi: 10.1093/biostatistics/kxs014. [DOI] [PMC free article] [PubMed] [Google Scholar]
- 28.Price A.L., Kryukov G.V., de Bakker P.I., Purcell S.M., Staples J., Wei L.J., Sunyaev S.R. Pooled association tests for rare variants in exon-resequencing studies. Am. J. Hum. Genet. 2010;86:832–838. doi: 10.1016/j.ajhg.2010.04.005. [DOI] [PMC free article] [PubMed] [Google Scholar]
- 29.Adzhubei I.A., Schmidt S., Peshkin L., Ramensky V.E., Gerasimova A., Bork P., Kondrashov A.S., Sunyaev S.R. A method and server for predicting damaging missense mutations. Nat. Methods. 2010;7:248–249. doi: 10.1038/nmeth0410-248. [DOI] [PMC free article] [PubMed] [Google Scholar]
- 30.Ashburner M., Ball C.A., Blake J.A., Botstein D., Butler H., Cherry J.M., Davis A.P., Dolinski K., Dwight S.S., Eppig J.T., et al. Gene ontology: tool for the unification of biology. The Gene Ontology Consortium. Nat. Genet. 2000;25:25–29. doi: 10.1038/75556. [DOI] [PMC free article] [PubMed] [Google Scholar]
- 31.Yang J., Lee S.H., Goddard M.E., Visscher P.M. GCTA: a tool for genome-wide complex trait analysis. Am. J. Hum. Genet. 2011;88:76–82. doi: 10.1016/j.ajhg.2010.11.011. [DOI] [PMC free article] [PubMed] [Google Scholar]
- 32.Goldstein J.I., Crenshaw A., Carey J., Grant G.B., Maguire J., Fromer M., O’Dushlaine C., Moran J.L., Chambert K., Stevens C., et al. zCall: a rare variant caller for array-based genotyping: genetics and population analysis. Bioinformatics. 2012;28:2543–2545. doi: 10.1093/bioinformatics/bts479. [DOI] [PMC free article] [PubMed] [Google Scholar]
- 33.Holmen J., Midthjell K., Krüger Ø., Langhammer A., Holmen T., Bratberg G.H., Vatten L., Lund-Larsen P.G. The Nord-Trøndelag Health Study 1995–97 (HUNT 2): objectives, contents, methods and participation. Norsk Epidemiologi. 2003;13:19–32. [Google Scholar]
- 34.Kang H.M., Sul J.H., Service S.K., Zaitlen N.A., Kong S.Y., Freimer N.B., Sabatti C., Eskin E. Variance component model to account for sample structure in genome-wide association studies. Nat. Genet. 2010;42:348–354. doi: 10.1038/ng.548. [DOI] [PMC free article] [PubMed] [Google Scholar]
- 35.Purcell S., Neale B., Todd-Brown K., Thomas L., Ferreira M.A., Bender D., Maller J., Sklar P., de Bakker P.I., Daly M.J., et al. PLINK: a tool set for whole-genome association and population-based linkage analyses. Am. J. Hum. Genet. 2007;81:559–575. doi: 10.1086/519795. [DOI] [PMC free article] [PubMed] [Google Scholar]
- 36.Willer C.J., Li Y., Abecasis G.R. METAL: fast and efficient meta-analysis of genomewide association scans. Bioinformatics. 2010;26:2190–2191. doi: 10.1093/bioinformatics/btq340. [DOI] [PMC free article] [PubMed] [Google Scholar]
- 37.Kanehisa M., Goto S. KEGG: Kyoto encyclopedia of genes and genomes. Nucleic Acids Res. 2000;28:27–30. doi: 10.1093/nar/28.1.27. [DOI] [PMC free article] [PubMed] [Google Scholar]
- 38.Thomas P.D., Campbell M.J., Kejariwal A., Mi H., Karlak B., Daverman R., Diemer K., Muruganujan A., Narechania A. PANTHER: a library of protein families and subfamilies indexed by function. Genome Res. 2003;13:2129–2141. doi: 10.1101/gr.772403. [DOI] [PMC free article] [PubMed] [Google Scholar]
- 39.Croft D., O'Kelly G., Wu G., Haw R., Gillespie M., Matthews L., Caudy M., Garapati P., Gopinath G., Jassal B., et al. Reactome: a database of reactions, pathways and biological processes. Nucleic Acids Res. 2011;39:D691–D697. doi: 10.1093/nar/gkq1018. [DOI] [PMC free article] [PubMed] [Google Scholar]
Associated Data
This section collects any data citations, data availability statements, or supplementary materials included in this article.