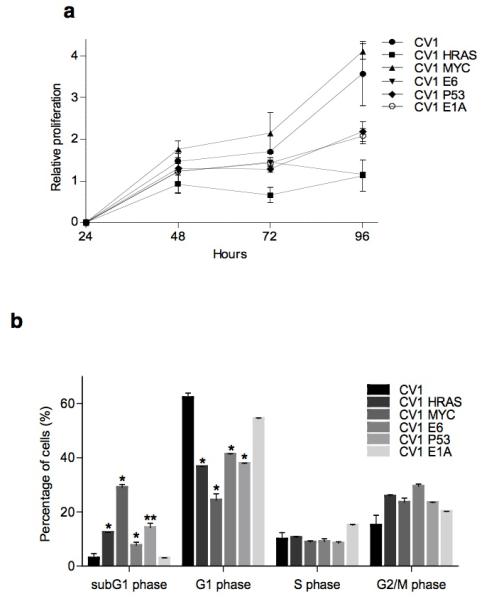
Figure 2. Analysis of cell proliferation and cell cycle in WT CV-1 and transformed CV-1 cells.
(a) Cell proliferation evaluated at different time points by the MTT assay. Results represent the means ± standard deviations (n=6). (b) The percentage of normal and transformed CV-1 cells in subG1, G1, S and G2/M phase of the cell cycle was determined by analysis with the cell cycle platform of the Flowjo software. The means ± standard deviations are shown (n=3).

