

Abstract
Dried blood spots (DBS) collected from infants shortly after birth for the newborn screening program (NSP) in the United States are valuable resources for the assessment of exposure to environmental chemicals in newborns. The NSP was debuted as a public health program in the United States in the 1960s; and the DBS samples collected over a period of time can be used in tracking temporal trends in exposure to environmental chemicals by newborns. In this study, polychlorinated biphenyls (PCBs) and organochlorine pesticides (OCPs) were measured in DBS samples collected from newborns in Upstate New York from 1997 to 2011 by gas chromatography-high resolution mass spectrometry (GC-HRMS). Twelve PCBs and two OCPs were found in DBS samples at a detection rate above 50% (n = 51). The mean whole blood concentration of ΣPCBs (sum of 12 congeners) over the 15-year period was 1.06 ng/mL, followed by p,p′-DDE (0.421 ng/mL) and HCB (0.065 ng/mL). The measured concentrations of PCBs and p,p′-DDE in infants’ blood were comparable to those reported in cord blood, suggesting maternal/trans-placental transfer of these compounds from mothers to fetuses. The concentrations of ΣPCBs and p,p′-DDE in blood samples of infants decreased significantly between 1997 and 2001, and no significant reduction was found thereafter. This observation is consistent with the trends reported for these chemicals in other human tissues in the United States.
Keywords: PCBs, OCPs, Dried blood spot, Temporal trend, Infants
1. Introduction
Persistent organic pollutants (POPs) such as poly chlorinated biphenyls (PCBs) and organochlorine pesticides (OCPs) are bio-accumulative, toxic and susceptible to long-range atmospheric transport (Breivik et al. 2006). Since the 1970s, the use of PCBs and several OCPs was severely restricted or banned in the United States (Muir and Howard 2006). As a consequence, the levels of these chemicals have decreased in environmental and biological matrixes (Sun et al. 2006; Venier and Hites 2010). However, detectable levels of PCBs and OCPs have been found in the United States’ general population (Sjödin et al. 2014). Human exposure and adverse health effects of POPs continue to be of concern despite regulatory efforts to ban the production and use of these chemicals more than 3 decades ago in the United States (Louis et al. 2013; Taylor et al. 2013; Wu et al. 2013).
Numerous studies have shown that POPs elicit adverse health effects in humans, including disruption of endocrine systems as well as reproductive and immunological effects (Ha et al. 2007; Morales et al. 2013; Tsuji et al. 2013). For example, serum concentrations of PCBs, p,p′-DDE, and HCB were associated with reduced thyroid hormone levels in adult men (Meeker et al. 2007). High plasma HCB and PCB concentrations were significantly associated with the risk of developing type 2 diabetes (Wu et al. 2013). An increased risk for obesity was associated with prenatal exposure to PCBs and DDE in children (Valvi et al. 2012). In comparison with adults, fetuses, newborns, and infants are more sensitive to the effects of environmental chemicals (Lignell et al. 2013). POPs have been shown to cross the maternal/trans-placental barrier (Covaci et al. 2002; Jaraczewska et al. 2006). Owing to the administrative and/or legal restrictions in obtaining blood samples for research purposes, little is known regarding the levels of POPs in newborns.
The newborn screening program (NSP) is a public health program that was debuted in the United States in the 1960s and is designed to screen for a list of conditions that are treatable in infants shortly after birth. The screening programs are often run by state or national governing bodies for all infants born in that jurisdiction. Most newborn screening tests are performed by measuring metabolites and enzyme activities in whole blood samples collected on a specialized filter paper, by pricking a newborn’s heel within 24–48 h of birth (Olshan 2007). The filter paper with blood spots is dried and sent to laboratories for analysis. The New York State (NYS) NSP receives dried blood spots (DBS) from approximately 250,000 newborns annually and began archiving unused residual DBS in 1997 for health-related follow-up testing and public health research (Ma et al. 2013b; Spliethoff et al. 2008). Studies have suggested the utility of DBS in epidemiologic and clinical studies (la Marca et al. 2012; Lawson et al. 2012). Several studies evaluated the use of DBS for the determination of environmental chemicals, which is a measure of exposure in newborns (Burse et al. 1997; Dua et al. 1996; Kato et al. 2009; Lu et al. 2012; Ma et al. 2013a; Otero-Santos et al. 2009; Spliethoff et al. 2008; Suyagh et al. 2010). Nevertheless, the application of DBS in the assessment of temporal trends of environmental chemicals in newborns is limited. In our previous studies, we documented the utility of DBS for tracking temporal trends of perfluorinated compounds (PFCs) and polybrominated diphenyl ethers (PBDEs) in the blood of newborns (Ma et al. 2013b; Spliethoff et al. 2008). In the present study, we validated a gas chromatography-high resolution mass spectrometry (GC-HRMS) method for the quantification of PCBs and OCPs in DBS samples. The method was then applied for the study of temporal trends of PCBs and OCPs in the whole blood of newborns using archived DBS samples collected during 1997 to 2011 from the NYS NSP.
2. Methods and materials
2.1. Chemicals and reagents
Twenty-one PCB congeners (CB-8, 18, 28, 44, 52, 66, 77, 101, 105, 118, 126, 128, 138, 153, 170, 180, 187, 195, 201, 206, 209) and seven corresponding 13C12-labeled PCB homologues (13C12-CB-28, 13C12-CB-52, 13C12-CB-101, 13C12-CB-138, 13C12-CB-153, 13C12-CB-180, 13C12-CB-209) were purchased from Wellington Laboratories (Guelph, ON, Canada). The eight target OCPs comprising hexachlorobenzene (HCB), trans-nonachlor, cis-nonachlor, cis-chlordane, o,p′-DDD, o,p′-DDT, o,p′-DDE, and p,p′-DDE and 13C12-p,p′-DDE were also purchased from Wellington Laboratories. All the 13C12-labeled compounds were used as internal standards (IS). Pesticide analysis-grade organic solvents (acetone, hexane, dichloromethane, and isooctane), ACS-grade formic acid (88%), and HPLC-grade water were purchased from J. T. Baker (Phillipsburg, NJ, USA). Whatman 903 filter cards (Schleicher & Schuell Bioscience, Inc; Keene, NH, USA) were used for method development and validation, which were used for DBS sample collection by the NYS NSP.
2.2. Samples
Details with regard to the collection of archived DBS samples can be found in our previous publications (Ma et al. 2013b; Spliethoff et al. 2008). Briefly, two specific dates were selected to represent winter and summer months of every year from 1997 to 2011. Seventy-two DBS filter cards were randomly selected for each date to harvest the samples. Each sample represented 24 1/4-in (~6.0 mm) diameter punches collected from 24 individual DBS cards (i.e., from individual babies). Three pooled DBS samples were obtained for each date. The whole blood volume represented by 24 × 6 mm composite sample was 322 μL, which was based on a typical infant hematocrit level, the NYS NSP spot size and previous blood spot volume assessments (Adam et al. 2000; Spliethoff et al. 2008). Overall, 51 pooled samples from 1224 babies were collected for the period from 1997 to 2011. This study was approved by the NYS Department of Health Institutional Review Board for the protection of human subjects.
For the validation of extraction and analysis of PCBs and OCPs in filter cards, in-house DBS specimens were prepared. For this, whole blood samples from adult volunteers were spiked with PCBs and OCPs standards and 50 μL of the spiked blood was spotted on Whatman 903 filter cards. The specimens were extracted and analyzed by following the method described below. Procedural blanks and field blanks were prepared to test for contamination arising from collection, storage, transport and analysis of DBS samples. Details regarding the preparation of in-house DBS specimens and blanks are given in our previous study (Ma et al. 2013b).
2.3. Extraction
Details with regard to the extraction of DBS samples have been reported elsewhere (Ma et al. 2013b). Briefly, after being cut into small pieces, DBS samples were extracted by ultrasonic extraction method with 2 mL of formic acid-acetone mixture (2:3, v/v) and 2 mL of hexane-dichloromethane mixture (4:1, v/v). After extraction twice, the combined organic layer was washed with HPLC grade water, and evaporated to 50 μL under a gentle stream of nitrogen for GC-HRMS analysis.
2.4. Instrumental analysis
Identification and quantification of PCBs and OCPs were performed separately by a Thermo Scientific™ Ultra Trace gas chromatography-DFS (double focusing magnetic sector) high resolution mass spectrometer (GC-HRMS) (Thermo Electron Corporation; West Palm Beach, FL, USA). A ZB-5MSi Zebron® capillary column (30 m × 0.25 mm × 0.25 um) was used for the separation of the target compounds (Phenomenex; Torrance, CA, USA). Two microliters of the sample were injected in the splitless mode by a TriPlus™ autosampler (Thermo Electron Corporation). The mass spectrometer was operated at a resolution of > 10,000 in selected ion monitoring and ultrapure helium was used as the carrier gas at a flow rate of 1 mL/min. Perfluorotributyl amine (PFTBA, FC43) was used as the calibrant. The injector temperatures were maintained at 250 °C and 270 °C for the analysis of OCPs and PCBs, respectively. The electron impact ionization (EI) energies were set at 40 eV and 70 eV for OCPs and PCBs, respectively. The GC oven temperature for OCPs was programmed as follows: 80 °C (held 2 min) to 160 °C at a rate of 10 °C/min, to 230 °C at 5 °C/min, and then to 300 °C at 15 °C/min. For PCBs, the GC oven temperature was programmed as follows: 100 °C (held 1 min) to 180 °C at a rate of 6 °C/min (held 1 min), to 220 °C at 2 °C/min (held 1 min), and then to 300 °C at 8 °C/min (held 0.5 min). The quantification and confirmation ions monitored for native and 13C12-labled congeners and other MS parameters are presented in Table 1 for PCBs and Table 2 for OCPs.
Table 1.
Quantification and confirmation ions monitored for native and 13C12-labeled polychlorinated biphenyl congeners in the analysis of dried blood spot from newborn screening program
| Compounds (IUPAC number) |
Quantification ion |
Confirmation ion |
Segment time |
Lock Mass |
Calibration Mass |
|---|---|---|---|---|---|
| 8 | 222.0003 | 223.9974 | |||
| 10–16.6 | 218.98508 | 263.98656 | |||
| 18/28 | 255.9613 | 257.9584 | |||
| 16.6–23 | 313.98336 | ||||
| 44/52/66/77 | 291.9194 | 289.9224 | |||
| 263.98656 | |||||
| 23–30 | 351.98017 | ||||
| 101/105/118/126 | 325.8804 | 327.8775 | 30–34.5 | 375.98017 | |
| 34.5–41 | 413.97698 | ||||
| 30–34.5 | 375.98017 | ||||
| 128/138/153 | 359.8415 | 361.8385 | 313.98336 | ||
| 170/180/187 | 393.8025 | 395.7995 | |||
| 34.5–41 | 413.97698 | ||||
| 195/201 | 429.7606 | 427.7635 | |||
| 413.97698 | |||||
| 206 | 461.7246 | 463.7216 | 41–46.5 | 413.97698 | 501.97059 |
| 209 | 497.6826 | 499.6797 | 413.97698 | ||
| 13C12-CB-28 | 268.0016 | 269.9986 | |||
| 16.6–23 | 313.98336 | ||||
| 13C12-CB-52 | 303.9597 | 301.9626 | 263.98656 | ||
| 13C12-CB-101 | 337.9207 | 339.9178 | 23–30 | 351.98017 | |
| 13C12-CB-138 | |||||
| 371.8817 | 373.8788 | 30–34.5 | 375.98017 | ||
| 13C12-CB-153 | 313.98336 | ||||
| 13C12-CB-180 | 405.8428 | 407.8398 | 34.5–41 | 413.97698 | |
| 13C12-CB-209 | 509.7229 | 511.7199 | 41–46.5 | 413.97698 | 501.97059 |
Table 2.
Quantification and confirmation ions monitored for native and 13C12-labeled organochlorine pesticides in the analysis of dried blood spot from newborn screening program
| Compounds | Quantification ion |
Confirmation ion |
Segment time (min) |
Lock Mass |
Calibration Mass |
|---|---|---|---|---|---|
| HCB | 283.8102 | 285.8073 | 12–20 | 313.98336 | |
| trans-nonachlor | |||||
| 408.7841 | 406.7870 | ||||
| cis-nonachlor | |||||
| cis-chlordane | 372.8260 | 374.8231 | |||
| op′-DDD | 263.98656 | ||||
| 235.0081 | 237.0053 | 20–28 | 413.97700 | ||
| op′-DDT | |||||
| op′-DDE | |||||
| 246.0003 | 247.9975 | ||||
| pp′-DDE | |||||
| 13C12-pp′-DDE | 258.0405 | 260.0376 |
2.5. Instrumental calibration
Both native and 13C12-labeled compounds were prepared at 8 levels (0.05, 0.1, 0.2, 0.5, 1, 2, 5, and 10 ng/mL). The instrumental response was linear over the calibration range of 0.05–10 ng/mL, with the regression coefficients (r) exceeding 0.99 for all PCBs and OCPs. Extracted ion chromatograms of PCBs and OCPs in a standard solution of 0.05 ng/mL (2 μL injection) are shown (Figure S1–S3; Supporting Information, SI). The limit of quantification (LOQ) was set at a signal-to-noise ratio of 10. For the pooled DBS samples (i.e., whole blood volume equivalent of 322 μL), the LOQs for PCBs were: 0.001 ng/mL for deca-CB, 0.004 ng/mL for tri-CBs, 0.008 ng/mL for di-CBs and penta-CBs, and 0.002 ng/mL for other PCB congeners. For OCPs, the LOQs were: 0.003 ng/mL for HCB, 0.02 ng/mL for trans-nonachlor, cis-chlordane, o,p′-DDD, o,p′-DDE and p,p′-DDE, and 0.03 ng/mL for cis-nonachlor, and o,p′-DDT. Additional details regarding precision, accuracy and blank contaminations are presented below.
2.6. Statistical analysis
Statistical analysis was performed with SPSS (Version 17.0) and Origin (Version 7.5). For statistical analysis, concentrations below the LOQs were assigned half the values of the LOQs. For Pearson correlation and Spearman correlation, results were considered statistically significant if the p-value was less than 0.05. A two-way t-test was used for the comparison of differences in concentrations between years.
3. Results and discussion
3.1. Method validation
For the method validation, in-house DBS specimens were prepared by spiking whole blood at 0.2 and 2 ng/mL for each of the target compounds. Recoveries (i.e., accuracy) and precision of the extraction and analytical method were determined.
3.1.1. Procedural blanks
Considering the small volume of blood available for analysis and the ultra-trace levels (on the order of fg-pg/μL) of target compounds present in blood from newborns, contamination that arises during sample treatment should be carefully controlled. Procedural blanks were prepared by passage of all solvents and reagents through the entire analytical procedure. For OCPs, only HCB was detected in procedural blanks, at a mean concentration of 0.01 ng/mL. For PCBs, four congeners were detected with concentrations above the LOQs: CB-28 (0.01 ng/mL), CB-44 (0.01 ng/mL), CB-52 (0.03 ng/mL), and CB-138 (0.01 ng/mL).
3.1.2. Recovery and precision
The recoveries of target compounds through the analytical procedure were determined as the measured concentration divided by the spiked concentration and multiplied by 100. The recoveries of 13C12-labeled ISs ranged from 40.5% (13C12-CB-209) to 72.2% (13C12-CB-28) (Fig. S4). The coefficient of variation (CV) between several analyses was less than 15% for all of the ISs. The recoveries of the target compounds (PCBs and OCPs) are presented in Fig. S5 and Fig. S6. For PCBs, the recoveries ranged from 51.8%) to 102%) at a spike level of 0.2 ng/mL and from 89.2% to 114% at a spike level of 2 ng/mL. Except for CB-8, CB-28, CB-126 and CB-187 spiked at 0.2 ng/mL, other PCB congeners exhibited a CV of <15% at both levels of fortification. For OCPs, the recoveries ranged widely from 26.8% to 88.1% at the fortification level of 0.2 ng/mL and from 26.6% to 105% at the fortification level of 2 ng/mL. Only HCB, o,p′-DDE and p,p′-DDE showed acceptable precision with the CV of <15%. The results indicated that the method is suitable for the analysis of PCBs and select OCPs (i.e. HCB, o,p -DDE and p,p′-DDE) in DBS samples.
3.2. QA/QC for archived DBS analysis
3.2.1. Field blanks
A major issue associated with the use of archived DBS in trace environmental chemical analysis is background levels of target compounds and/or contamination during collection, handling, and storage (Lu et al. 2012; Ma et al. 2013b). Collection and analysis of field blanks would enable understanding of background levels of contamination. For each of the sampling dates, field blanks representing 24 1/4-in discs, were collected from unspotted portions of 24 filter cards, archived by the NSP during the period of 1997 through 2011. In total, 10 field blanks were collected to represent the period from 1997 to 2011. A typical extracted ion chromatogram of PCBs and OCPs found in field blanks is showed in Fig. S7 to Fig. S12. HCB was detected in field blanks at a mean concentration of 0.02 ng/mL. Similarly, CB-18 (0.04 ng/mL), CB-28 (0.04 ng/mL), CB-52 (0.05 ng/mL), CB-66 (0.03 ng/mL), CB-138 (0.02 ng/mL) and CB-153 (0.02 ng/mL) were also detected in field blanks. Concentrations of these compounds were higher than those determined in procedural blanks, indicating contaminations during sampling, handling, and storage. Concentrations determined in field blanks were subtracted from those measured in actual DBS samples. For reporting, we set a threshold that the measured concentration in DBS samples should be at least 5 times the concentration found in field blanks, after subtraction.
3.2.2. Recovery of internal standards
The performance of the method was evaluated by the determination of recoveries of 13C-labeled ISs, which were spiked in all DBS samples and passed through the entire analytical procedure. The average recoveries of 13C12-CB-28, -52, -101, -138, -153, -180, -209 and 13C12-p,p′-DDE were 48%, 42%, 41%, 40%), 40%), 35%, 35% and 37%, respectively (n = 51). The reported concentrations of target compounds in actual DBS samples were corrected for the corresponding recoveries of ISs (i.e., isotope dilution method).
3.3. Concentrations of PCBs in DBS samples
The typical extracted ion chromatograms (2 μL injection) of PCBs present in an actual DBS sample are presented in Fig. S13 to Fig. S18. Concentrations of PCBs in 51 pooled DBS samples from NSP of NYS are summarized in Table 3. Several di-through tetra-chlorinated congeners (CB-8, -18, 28, -44, -52, and -66) were detected at a higher rate (> 90%), than penta-/hexa-chlorinated congeners (CB-101, -110, -138, and -153). CB-77, -118, -126, -128, -170, -195, -201, -206, and -209 were all below the LOQs in most samples (> 80%), which were not shown in Table 1 and were not discussed further. Pearson correlations between pairs of selected PCBs showed significant correlations (r > 0.48, p < 0.01) among di-through tetra-chlorinated congeners or among penta-/hexa-chlorinated congeners (Table S1). However, no significant correlation was found between di-, tri- and tetra-chlorinated and penta- and hexa-chlorinated congeners. Less chlorinated congeners accounted for a major portion of the total PCB concentrations (Fig. 1). CB-8 (2,4′-diCB) was the predominant congener, followed by CB-28 (2,4,4′-triCB) and CB-18 2,5,2′-triCB). Predominance of these three congeners can be attributed to their preponderance in technical PCB mixtures such as Aroclor 1016 and 1242, in which these three congeners collectively account for > 30%) of the total chlorobiphenyl content. The overall mean concentration was as follows: CB-8 (mean: 0.480 ng/mL), CB-28 (0.109 ng/mL), CB-18 (0.094 ng/mL), CB-52 (0.087 ng/mL) and CB-101 (0.082 ng/mL). CB-8 accounted for > 50%) of the total PCB concentrations in DBS samples collected in 1997 and 1999. This congener was not found in field blanks collected with the same set of samples and therefore contamination from environmental sources can be ruled out. The concentrations of ΣPCBs in DBS samples ranged from 0.151 to 8.48 ng/mL (mean: 1.06 ± 1.32 ng/mL, geometric mean: 0.760 ng/mL, median: 0.755 ng/mL). The prevalence of less chlorinated congeners (CB-8, -18, and -28) in DBS samples suggest preferential partitioning and transfer of these relatively more water soluble congeners through the placental barrier. To our knowledge, no earlier studies have reported the occurrence of PCBs in DBS samples or in whole blood from newborns, for comparison. However, some previous studies have reported the concentrations of PCBs in umbilical cord serum. The concentration of ΣPCBs in DBS samples from the United States in the present study was similar to those reported for cord serum from Spain (mean: 0.5 ng/mL), Belgium (mean: 0.47 ng/mL) and Canada (mean: 0.51 ng/mL) (Covaci et al. 2002; Rhainds et al. 1999; Vizcaino et al. 2010).
Table 3.
Summary a of PCBs and OCPs concentration b (ng/mL whole blood) measured in archived dried blood spots from newborns in New York State from 1997 to 2011.
| Mean±SD | GMc | Minimum | 5th Percentile | Median | 95th Percentile | Maximum | DR(%) | |
|---|---|---|---|---|---|---|---|---|
| PCBs | ||||||||
| CB-8 | 0.480±1.138 | 0.147 | 0.004 | 0.004 | 0.152 | 1.999 | 6.907 | 92 |
| CB-18 | 0.094±0.063 | 0.067 | 0.002 | 0.015 | 0.096 | 0.191 | 0.331 | 96 |
| CB-28 | 0.109±0.054 | 0.097 | 0.029 | 0.044 | 0.105 | 0.201 | 0.272 | 100 |
| CB-44 | 0.051±0.027 | 0.045 | 0.013 | 0.021 | 0.046 | 0.113 | 0.135 | 100 |
| CB-52 | 0.087±0.052 | 0.074 | 0.009 | 0.036 | 0.075 | 0.186 | 0.278 | 100 |
| CB-66 | 0.018±0.013 | 0.013 | 0.001 | 0.001 | 0.017 | 0.047 | 0.054 | 90 |
| CB-101 | 0.082±0.062 | 0.057 | 0.004 | 0.004 | 0.069 | 0.199 | 0.320 | 90 |
| CB-110 | 0.039±0.042 | 0.023 | 0.004 | 0.004 | 0.032 | 0.157 | 0.174 | 70 |
| CB-138 | 0.039±0.047 | 0.019 | 0.001 | 0.001 | 0.023 | 0.122 | 0.228 | 90 |
| CB-153 | 0.043±0.039 | 0.031 | 0.001 | 0.011 | 0.028 | 0.105 | 0.196 | 98 |
| CB-180 | 0.013±0.015 | 0.006 | 0.001 | 0.001 | 0.010 | 0.047 | 0.064 | 69 |
| CB-187 | 0.008±0.012 | 0.003 | 0.001 | 0.001 | 0.003 | 0.037 | 0.045 | 51 |
| ΣPCBsd | 1.063±1.316 | 0.760 | 0.151 | 0.283 | 0.755 | 3.004 | 8.482 | – |
| OCPs | ||||||||
| HCB | 0.065±0.043 | 0.055 | 0.014 | 0.026 | 0.054 | 0.150 | 0.218 | 100 |
| p,p′-DDE | 0.421±0.333 | 0.342 | 0.105 | 0.132 | 0.337 | 0.918 | 2.043 | 100 |
| ΣOCPse | 0.486±0.346 | 0.410 | 0.148 | 0.180 | 0.428 | 1.012 | 2.077 | – |
Other congeners were not included in the table, because their detection rates were < 20%;
Concentrations below the LOQ were assigned half the values of the LOQ for statistical analysis;
GM: geometric mean;
ΣPCBs was the sum concentration of CB-8, 18, 28, 44, 52, 66, 101, 110, 138, 153, 180 and 187;
ΣOCPs was the sum concentration of HCB and p,p ’-DDE.
Fig. 1.
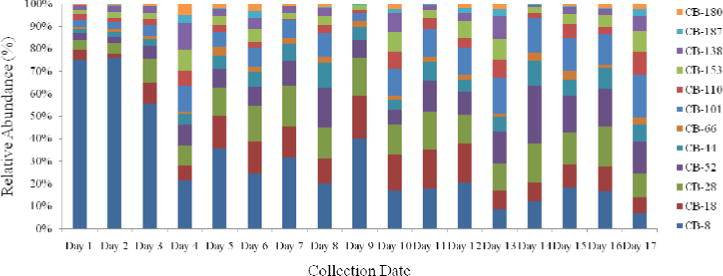
Composition profile of PCBs measured in archived dried blood spots from newborns in New York State from 1997 to 2011. Note: Day 1 (1/2/1997), Day 2 (12/30/1997), Day 3 (12/29/1999), Day 4 (12/29/2001), Day 5 (12/30/2002), Day 6 (12/29/2004), Day 7 (6/26/2006), Day 8 (1/8/2007), Day 9 (6/1/2007), Day 10 (1/2/2008), Day 11 (5/31/2008), Day 12 (1/2/2009), Day 13 (6/1/2009), Day 14 (1/5/2010), Day 15 (6/1/2010), Day 16 (1/3/2011), Day 17 (6/1/2011)
3.4. Concentrations of OCPs in DBS samples
The typical extracted ion chromatograms (2 μL injection) of OCPs present in a real DBS sample are presented in Fig. S19. Among eight OCPs analyzed, only HCB and p,p′-DDE were detected at concentrations above the LOQs (at a detection rate of 100%) in 51 pooled DBS samples (Table 3). The mean concentration of p,p′-DDE was significantly higher than that of HCB (p < 0.01); the mean concentrations of p,p′-DDE and HCB in DBS samples were 0.421 and 0.065 ng/mL, respectively. High concentrations of p,p′-DDE in the blood of pregnant women and in DBS samples of newborns suggest maternal/trans-placental transfer of this pesticide (Adetona et al. 2013; Covaci et al. 2002). p,p′-DDE concentrations measured in DBS samples in NYS were similar to those reported in DBS samples from Texas, with a median concentration of 0.69 ng/mL (Burse et al. 1997). p,p′-DDE concentrations measured in DBS samples in NYS were lower than those reported for cord serum from Belgium (0.58 ng/mL) (Covaci et al. 2002), and Poland (0.87 ng/mL) (Jaraczewska et al. 2006). No significant correlation (Spearman correlation, thereafter) existed between HCB and p,p-DDE (p = 0.338) levels in DBS samples, indicating different sources and pathways of exposure to these compounds by mothers. When compared with PCB concentrations, no significant correlation was found between HCB and ΣPCBs (p = 0.431), and p,p′-DDE levels were weakly correlated with ΣPCBs concentrations (r = 0.254, p = 0.076). In our previous study, the same set of DBS samples were analyzed for PBDEs (Ma et al. 2013b). Significant correlation was found between the levels of ΣPCBs and ΣPBDEs (r = 0.382, p = 0.006), and between p,p′-DDE and ΣPBDEs (r = 0.294, p = 0.038). However, no significant correlation existed between HCB and ΣPBDEs (p = 0.991). These results suggest different exposure sources to these environmental chemicals for the general population in the United States.
3.5. Temporal trends in PCBs and p,p′-DDE levels in DBS samples
In our previous studies, archived DBS samples were successfully used for tracking the temporal trends of PFCs and PBDEs in blood of newborns in the United States (Ma et al. 2013b; Spliethoff et al. 2008). PCBs and DDT were phased-out for over three decades in the United States. This is the first study to report the occurrence of PCBs and OCPs in DBS samples from newborns. The concentrations of ΣPCBs and p,p′-DDE in DBS samples showed a statistically significant decreasing trend from 1997 to 2011 (p < 0.005) (Fig. 2); the decreasing trend was significant from 1997 to 2001 and then the concentrations remained steady until 2011. HCB did not exhibit a declining trend with concentrations (p > 0.5). A significant reduction in CB-153 concentrations was reported in serum samples collected from the southeastern United States during 1985 to 2002 (Sjödin et al. 2004). The recent National Health and Nutrition Examination Survey also reported that the arithmetic mean serum concentrations of several PCB congeners decreased from 2003/04 to 2007/08 in the United States (Sjödin et al. 2014). The observations suggest the positive effects of the prohibition on the production and use of these chemicals in the United States.
Fig. 2.
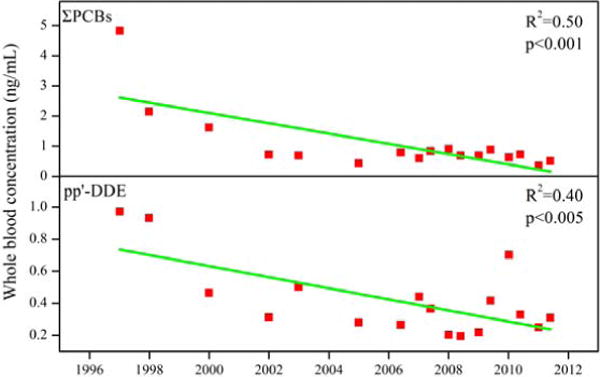
Temporal trends of ΣPCBs (upper) and p,p′-DDE (lower) concentrations in archived dried blood spot samples from NYS newborn screening program, 1997 to 2011
The slopes of regression lines of natural logarithmic concentrations plotted against sampling year were used in the calculation of disappearance half-lives of PCBs and p,p′-DDE in the blood of newborns. The calculated half-lives were 3.40 years for CB-8, 8.88 years for CB-110, 4.62 years for CB-138, 9.36 years for CB-153 and 5.13 years for CB-180. In comparison with PCBs, p,p′-DDE had a longer half-life of 10.3 years. The results of these half-life estimations are similar to those reported in previous studies. The elimination half-lives were reported to be 3–4 years for CB-138, and 7–9 years for CB-153 and CB-180 (Grandjean et al. 2008). In another study, the half-lives of between 9 and 11 years were reported for CB-138, -153, and -180 (Wimmerová et al. 2011). A slight discrepancy in half-life estimations among several studies can be attributed to the different types of sample matrixes analyzed and age groups of donors. Our results were calculated based on the whole blood concentrations in newborns, whereas those for others were based on serum from children or adults.
4. Conclusions and implications
DBS collected from NSP is a valuable resource for studying exposure of newborns to environmental chemicals and for studying temporal trends with exposure to environmental chemicals in newborns. In this study, a gas chromatography-high resolution mass spectrometry method with ultrasonic extraction was successfully applied for the analysis of PCBs and OCPs in DBS samples. This study presents the first evidence of temporal trends of these compounds in DBS specimens collected from newborns during the past two decades. A significant reduction in blood concentrations of PCBs and p,p′-DDE was found between 1997 and 2011. The method developed in this study is applied for a population-based birth cohort with a focus on environmental chemical exposure, couple fertility and children’s health (Louis et al. 2014).
It should be noted that we employed pooled DBS samples, representing a blood volume equal to 300 μL. Analysis of individual spot can enable studies on associations between health outcomes and chemical exposures in newborns. With considerable improvement in the analytical technologies, it is possible that several target environmental chemicals from a single residual spot that is equivalent of <50 μL could be analyzed. Nevertheless, a major limitation is the determination of the exact volume of whole blood in a DBS sample, which will require continued investigation in future.
Supplementary Material
Highlights.
Dried blood spots from newborns were analyzed for PCBs and OCPs.
ΣPCBs and DDE were detected at mean concentrations of 1.06 and 0.42 ng/mL, respectively.
PCBs and DDE have declined in infants’ blood since 1997 in the United States.
Archived DBS samples are valuable resources for tracking temporal trends of POPs.
Acknowledgments
This study was supported by the Intramural Research Program of the Eunice Kennedy Shriver National Institute of Child Health and Human Development (NICHD) contracts #HHSN275201200005C and #HHSN267200700019C to New York State Department of Health.
Footnotes
Publisher's Disclaimer: This is a PDF file of an unedited manuscript that has been accepted for publication. As a service to our customers we are providing this early version of the manuscript. The manuscript will undergo copyediting, typesetting, and review of the resulting proof before it is published in its final citable form. Please note that during the production process errors may be discovered which could affect the content, and all legal disclaimers that apply to the journal pertain.
Conflict of interest/Disclaimer: None.
References
- Adam BW, Alexander JR, Smith SJ, Chace DH, Loeber JG, Elvers L, Hannon WH. Recoveries of phenylalanine from two sets of dried-blood-spot reference materials: prediction from hematocrit, spot volume, and paper matrix. Clinical Chemistry. 2000;46(1):126–128. [PubMed] [Google Scholar]
- Adetona O, Horton K, Sjodin A, Jones R, Hall DB, Aguillar-Villalobos M, Cassidy BE, Vena JE, Needham LL, Naeher LP. Concentrations of select persistent organic pollutants across pregnancy trimesters in maternal and in cord serum in Trujillo, Peru. Chemosphere. 2013;91(10):1426–1433. doi: 10.1016/j.chemosphere.2013.01.043. [DOI] [PMC free article] [PubMed] [Google Scholar]
- Breivik K, Vestreng V, Rozovskaya O, Pacyna J. Atmospheric emissions of some POPs in Europe: a discussion of existing inventories and data needs. Environmental Science and Policy. 2006;9(7–8):663–674. [Google Scholar]
- Burse V, DeGuzman M, Korver M, Najam A, Williams C, Hannon W, Therrell B. Preliminary investigation of the use of dried-blood spots for the assessment of in utero exposure to environmental pollutants. Biochemical and Molecular Medicine. 1997;61(2):236–239. doi: 10.1006/bmme.1997.2603. [DOI] [PubMed] [Google Scholar]
- Covaci A, Jorens P, Jacquemyn Y, Schepens P. Distribution of PCBs and organochlorine pesticides in umbilical cord and maternal serum. Science of the total environment. 2002;298(1):45–53. doi: 10.1016/s0048-9697(02)00167-5. [DOI] [PubMed] [Google Scholar]
- Dua V, Pant C, Sharma V, Pathak G. Determination of HCH and DDT in finger-prick whole blood dried on filter paper and its field application for monitoring concentrations in blood. Bulletin of Environmental Contamination and Toxicology. 1996;56(1):50–57. doi: 10.1007/s001289900008. [DOI] [PubMed] [Google Scholar]
- Grandjean P, Budtz-Jørgensen E, Barr DB, Needham LL, Weihe P, Heinzow B. Elimination half-lives of poly chlorinated biphenyl congeners in children. Environmental Science & Technology. 2008;42(18):6991–6996. doi: 10.1021/es800778q. [DOI] [PMC free article] [PubMed] [Google Scholar]
- Ha M-H, Lee D-H, Jacobs DR., Jr Association between serum concentrations of persistent organic pollutants and self-reported cardiovascular disease prevalence: results from the National Health and Nutrition Examination Survey, 1999–2002. Environmental Health Perspectives. 2007;115(8):1204–1209. doi: 10.1289/ehp.10184. [DOI] [PMC free article] [PubMed] [Google Scholar]
- Jaraczewska K, Lulek J, Covaci A, Voorspoels S, Kaluba-Skotarczak A, Drews K, Schepens P. Distribution of polychlorinated biphenyls, organochlorine pesticides and polybrominated diphenyl ethers in human umbilical cord serum, maternal serum and milk from Wielkopolska region, Poland. Science of the total environment. 2006;372(1):20–31. doi: 10.1016/j.scitotenv.2006.03.030. [DOI] [PubMed] [Google Scholar]
- Kato K, Wanigatunga AA, Needham LL, Calafat AM. Analysis of blood spots for polyfluoroalkyl chemicals. Analytica Chimica Acta. 2009;656(1–2):51–55. doi: 10.1016/j.aca.2009.10.007. [DOI] [PubMed] [Google Scholar]
- la Marca G, Villanelli F, Malvagia S, Ombrone D, Funghini S, De Gaudio M, Fallani S, Cassetta MI, Novelli A, Chiappini E. Rapid and sensitive LC-MS/MS method for the analysis of antibiotic linezolid on dried blood spot. Journal of pharmaceutical and biomedical analysis. 2012;67:86–91. doi: 10.1016/j.jpba.2012.04.007. [DOI] [PubMed] [Google Scholar]
- Lawson G, Cocks E, Tanna S. Quantitative determination of atenolol in dried blood spot samples by LC-HRMS: A potential method for assessing medication adherence. Journal of Chromatography B. 2012;897:72–79. doi: 10.1016/j.jchromb.2012.04.013. [DOI] [PubMed] [Google Scholar]
- Lignell S, Aune M, Darnerud PO, Hanberg A, Larsson SC, Glynn A. Prenatal exposure to polychlorinated biphenyls (PCBs) and polybrominated diphenyl ethers (PBDEs) may influence birth weight among infants in a Swedish cohort with background exposure: a cross-sectional study. Environmental Health. 2013;12(1):44–52. doi: 10.1186/1476-069X-12-44. [DOI] [PMC free article] [PubMed] [Google Scholar]
- Louis GMB, Germaine M, Hediger ML, Bell EM, Kus CA, Sundaram R, McLain AC, Yeung E, Hills EA, Thoma ME. Methodology for establishing a population-based birth cohort focusing on couple fertility and children’s development, the Upstate KIDS Study. Paediatric and Perinatal Epidemiology. 2014;28(3):191–202. doi: 10.1111/ppe.12121. [DOI] [PMC free article] [PubMed] [Google Scholar]
- Louis GMB, Sundaram R, Schisterman EF, Sweeney AM, Lynch CD, Gore-Langton RE, Maisog J, Kim S, Chen Z, Barr DB. Persistent environmental pollutants and couple fecundity: the LIFE study. Environmental Health Perspectives. 2013;121(2):231–236. doi: 10.1289/ehp.1205301. [DOI] [PMC free article] [PubMed] [Google Scholar]
- Lu D, Wang D, Ip HSS, Barley F, Ramage R, She J. Measurements of polybrominated diphenyl ethers and polychlorinated biphenyls in a single drop of blood. Journal of Chromatography B. 2012;891–892:36–43. doi: 10.1016/j.jchromb.2012.02.016. [DOI] [PubMed] [Google Scholar]
- Ma W, Kannan K, Wu Q, Bell EM, Druschel CM, Caggana M, Aldous KM. Analysis of polyfluoroalkyl substances and bisphenol A in dried blood spots by liquid chromatography tandem mass spectrometry. Analytical and Bioanalytical Chemistry. 2013a;405:4127–4138. doi: 10.1007/s00216-013-6787-3. [DOI] [PubMed] [Google Scholar]
- Ma W, Yun SH, Bell E, Druschel C, Caggana M, Aldous K, Buck Louis G, Kannan K. Temporal trends of polybrominated diphenyl ethers (PBDEs) in the blood of newborns from New York State during 1997 through 2011: Analysis of dried blood spots from the Newborn Screening Program. Environmental Science & Technology. 2013b;47:8015–8021. doi: 10.1021/es401857v. [DOI] [PMC free article] [PubMed] [Google Scholar]
- Meeker JD, Altshul L, Hauser R. Serum PCBs, pp′-DDE and HCB predict thyroid hormone levels in men. Environmental Research. 2007;104(2):296–304. doi: 10.1016/j.envres.2006.11.007. [DOI] [PMC free article] [PubMed] [Google Scholar]
- Morales E, Gascon M, Martinez D, Casas M, Ballester F, Rodríguez-Bernal CL, Ibarluzea J, Marina LS, Espada M, Goñi F. Associations between blood persistent organic pollutants and 25-hydroxyvitamin D3 in pregnancy. Environment International. 2013;57:34–41. doi: 10.1016/j.envint.2013.03.011. [DOI] [PubMed] [Google Scholar]
- Muir DC, Howard PH. Are there other persistent organic pollutants? A challenge for environmental chemists. Environmental Science & Technology. 2006;40(23):7157–7166. doi: 10.1021/es061677a. [DOI] [PubMed] [Google Scholar]
- Olshan AF. Meeting report: the use of newborn blood spots in environmental research: opportunities and challenges. Environmental Health Perspectives. 2007;115(12):1767–1779. doi: 10.1289/ehp.10511. [DOI] [PMC free article] [PubMed] [Google Scholar]
- Otero-Santos SM, Delinsky AD, Valentin-Blasini L, Schiffer J, Blount BC. Analysis of perchlorate in dried blood spots using ion chromatography and tandem mass spectrometry. Analytical Chemistry. 2009;81(5):1931–1936. doi: 10.1021/ac802419n. [DOI] [PubMed] [Google Scholar]
- Rhainds M, Levallois P, Dewailly É, Ayotte P. Lead, mercury, and organochlorine compound levels in cord blood in Quebec, Canada. Archives of Environmental Health: An International Journal. 1999;54(1):40–47. doi: 10.1080/00039899909602235. [DOI] [PubMed] [Google Scholar]
- Sjödin A, Jones R, Caudill S, Wong L, Turner W, Calafat A. Polybrominated diphenyl ethers, polychlorinated biphenyls, and persistent pesticides in serum from the National Health and Nutrition Examination Survey: 2003–2008. Environmental Science & Technology. 2014;48:753–760. doi: 10.1021/es4037836. [DOI] [PMC free article] [PubMed] [Google Scholar]
- Sjödin A, Jones RS, Focant J-F, Lapeza C, Wang RY, McGahee EE. Retrospective time-trend study of polybrominated diphenyl ether and polybrominated and polychlorinated biphenyl levels in human serum from the United States. Environmental Health Perspectives. 2004;112(6):654–658. doi: 10.1289/ehp.112-1241957. [DOI] [PMC free article] [PubMed] [Google Scholar]
- Spliethoff HM, Tao L, Shaver SM, Aldous KM, Pass KA, Kannan K, Eadon GA. Use of newborn screening program blood spots for exposure assessment: declining levels of perfluorinated compounds in New York State infants. Environmental Science & Technology. 2008;42(14):5361–5367. doi: 10.1021/es8006244. [DOI] [PubMed] [Google Scholar]
- Sun P, Blanchard P, Brice K, Hites RA. Atmospheric organochlorine pesticide concentrations near the Great Lakes: temporal and spatial trends. Environmental Science & Technology. 2006;40(21):6587–6593. doi: 10.1021/es060858+. [DOI] [PubMed] [Google Scholar]
- Suyagh MF, Iheagwaram G, Kole PL, Millership J, Collier P, Halliday H, McElnay JC. Development and validation of a dried blood spot-HPLC assay for the determination of metronidazole in neonatal whole blood samples. Analytical and Bioanalytical Chemistry. 2010;397(2):687–693. doi: 10.1007/s00216-010-3571-5. [DOI] [PubMed] [Google Scholar]
- Taylor KW, Novak RF, Anderson HA, Birnbaum LS, Blystone C, DeVito M, Jacobs D, Köhrle J, Lee D-H, Rylander L. Evaluation of the association between persistent organic pollutants (POPs) and diabetes in epidemiological studies: A national toxicology program workshop review. Environmental Health Perspectives. 2013;121(7):774–783. doi: 10.1289/ehp.1205502. [DOI] [PMC free article] [PubMed] [Google Scholar]
- Tsuji M, Aiko Y, Kawamoto T, Hachisuga T, Kooriyama C, Myoga M, Tomonaga C, Matsumura F, Anan A, Tanaka M. Polychlorinated biphenyls (PCBs) decrease the placental syncytiotrophoblast volume and increase Placental Growth Factor (PlGF) in the placenta of normal pregnancy. Placenta. 2013;34(7):619–623. doi: 10.1016/j.placenta.2013.03.007. [DOI] [PubMed] [Google Scholar]
- Valvi D, Mendez MA, Martinez D, Grimalt JO, Torrent M, Sunyer J, Vrijheid M. Prenatal concentrations of polychlorinated biphenyls, DDE, and DDT and overweight in children: a prospective birth cohort study. Environmental health perspectives. 2012;120(3):451–457. doi: 10.1289/ehp.1103862. [DOI] [PMC free article] [PubMed] [Google Scholar]
- Venier M, Hites RA. Time trend analysis of atmospheric POPs concentrations in the Great Lakes region since 1990. Environmental Science & Technology. 2010;44(21):8050–8055. doi: 10.1021/es101656u. [DOI] [PubMed] [Google Scholar]
- Vizcaino E, Grimalt JO, Lopez-Espinosa M-J, Llop S, Rebagliato M, Ballester F. Maternal origin and other determinants of cord serum organochlorine compound concentrations in infants from the general population. Environmental Science & Technology. 2010;44(16):6488–6495. doi: 10.1021/es101397e. [DOI] [PubMed] [Google Scholar]
- Wimmerová S, Lancz K, Tihányi J, Šovčíková E, Kočan A, Drobná B, Palkovičová L’, Jurečková D, Fabišiková A, Čonka K. Half-lives of serum PCB congener concentrations in environmentally exposed early adolescents. Chemosphere. 2011;82(5):687–691. doi: 10.1016/j.chemosphere.2010.10.099. [DOI] [PubMed] [Google Scholar]
- Wu H, Bertrand KA, Choi AL, Hu FB, Laden F, Grandjean P, Sun Q. Persistent organic pollutants and type 2 diabetes: A prospective analysis in the nurses’ health study and meta-analysis. Environmental Health Perspectives. 2013;121(2):153–161. doi: 10.1289/ehp.1205248. [DOI] [PMC free article] [PubMed] [Google Scholar]
Associated Data
This section collects any data citations, data availability statements, or supplementary materials included in this article.