

Abstract
The development of responsive or “smart” magnetic resonance imaging (MRI) contrast agents that can report specific biomarker or biological events has been the focus of MRI contrast agent research over the past 20 years. Among various biological hallmarks of interest, tissue redox and hypoxia are particularly important owing to their roles in disease states and metabolic consequences. Herein we review the development of redox-/hypoxia-sensitive T1 shortening and paramagnetic chemical exchange saturation transfer (PARACEST) MRI contrast agents. Traditionally, the relaxivity of redox-sensitive Gd3+-based complexes is modulated through changes in the ligand structure or molecular rotation, while PARACEST sensors exploit the sensitivity of the metal-bound water exchange rate to electronic effects of the ligand-pendant arms and alterations in the coordination geometry. Newer designs involve complexes of redox-active metal ions in which the oxidation states have different magnetic properties. The challenges of translating redox- and hypoxia-sensitive agents in vivo are also addressed.
Keywords: hypoxia, imaging agents, magnetic resonance imaging, PARACEST, redox chemistry
Introduction
Magnetic resonance imaging (MRI) is one of the most powerful imaging techniques in clinical diagnostics, largely because of its exceptional spatial resolution (<100 μm with modern high-field equipment), lack of invasiveness and ionizing radiation, and its ability to simultaneously report physiological and anatomical information. Currently, over 30 % of MRI scans are performed with the administration of a contrast agent.[1] Research and development of novel contrast agents has been exceptionally productive over the past 30 years with recent focus on responsive (smart) agents that are capable of reporting a biological event or a biomarker. The two major classes of MRI contrast agents (T1 and/or T2 agents; CEST agents) influence image contrast by affecting the level of net magnetization of water protons either by modifying their longitudinal and transverse relaxation times or by transferring saturated proton spins from an agent to bulk water. The technical details of these agents have been extensively reviewed elsewhere and are not considered here.[2–8] Both platforms have been successfully used in the design of responsive agents, and the subject of this review is the current status of research focused on redox- and hypoxia-sensitive T1 and CEST agents. A review on redox-activated MRI agents appeared while this present work was in submission.[9]
Redox-responsive MRI contrast agents
Tissue redox is an important biomarker. Both intracellular and extracellular redox environments are tightly regulated in healthy tissues, and changes in cellular redox are associated with a wide range of physiological and pathophysiological conditions. Altered cellular redox balance and increased production of reactive oxygen species (ROS) correlate with many important cellular events including proliferation, differentiation, apoptosis, and senescence.[10, 11] ROS are formed as a result of incomplete reduction of oxygen as a by-product of aerobic respiration. The extracellular space is generally considered to be more highly oxidized than the cytosol and is subjected to much larger fluctuations.[12] The redox state of a cell can be defined by any single redox couple such as [NADH]/[NAD+] or [GSH]2/[GSSG], but a more appropriate term to describe the redox status of a cell would be in terms of redox environment. The redox environment of a biological organelle, cell, or tissue is given by the sum of all linked redox couples.[13] There are a variety of redox couples that contribute to the overall redox status of tissue. The most important include glutathione (GSH =(Glu-Cys-Gly): GSH/GSSG; nicotinamide adenine dinucleotide and its phosphorylated derivative: NADH/NAD+ and NADPH/NADP+; and thioredoxin: Trx(SH)2/TrxSS. Among these, glutathione is often considered the principal thiol–disulfide redox buffer responsible for maintaining the intracellular redox balance. The reduction potential of the GSH/GSSG half-cell reaction (GSSG +2 H+ +2e−→2GSH) under biological conditions can be described by the Nernst equation:
| (1) |
in which E°′pH7 is the potential at pH 7 for the GSH/GSSG couple against normal hydrogen electrode (E°′pH7 = −240 mV), R is the gas constant (R =8.314 J K−1mol−1), T is temperature (T =298.15 K), F is the Faraday constant (F =9.6485 × 10⁴ C mol−1), and n is the number of electrons involved in the chemical process (n =2).
GSH is synthesized in cells from basic components and is readily transported to the extracellular space.[14] It is the main redox buffer because its cellular concentration (1–11 mM) is much higher than other redox-active compounds. Typically, the extracellular concentration of GSH is about three orders of magnitude lower (2–20 μM). The intra- and extracellular levels of GSH depend on the relative rates of its production, depletion, and transport.[15, 16] The extracellular level of GSH is regulated by γ-glutamyl transpeptidase. This membrane-bound enzyme removes the γ-glutamyl residue to produce Cys-Gly, which undergoes further hydrolysis by dipeptidases.[12] GSH and/or GSSG levels can be measured to estimate the redox environment of a cell by using HPLC or spectrophotometric or fluorescence-based assays such as the 5,5′-dithiobis(2-nitrobenzoic acid) recycling assay.[17, 18] These assays can accurately measure the total concentration of reduced (GSH) and oxidized (GSSG) glutathione present in cell extracts (from which the redox potential can be calculated), but the clinical utility of this measure is limited. MR spectroscopy (MRS) provides a non-invasive way to detect and quantify biologically important molecules in vivo.[19] Glutathione levels have been measured by 1H MRS, whereas 31P MRS has been used to assess intracellular redox state by measuring the NADH/NAD+ ratio in vivo.[20, 21] Notably, hyperpolarized NMR probes have also been developed for in vivo redox sensing.[22, 23]
The idea of using MRI contrast agents to report the redox status or redox environment of tissue was proposed ~20 years ago, six years after USFDA approval of the first MR contrast agent (Gd3+-DTPA; DTPA =diethylenetriaminepentaacetic acid) for use in humans.[24] Since then, several T1 and CEST agents have been reported to show redox-dependent MR contrast due to a change in the redox state of either the ligand or the metal ion.
T1 agents based on redox-active ligands
T1 shortening agents influence image contrast by modifying the longitudinal relaxation times of water protons in body tissue. The 1H relaxivity (r1) of paramagnetic metal complexes such as Gd3+ chelates is determined by an interplay of several parameters including the number of inner-sphere water molecules (q), the water residence lifetime (τM = kex−1) of a metal-ion-bound water molecule, the rotational correlation time (τR) of the complex, and the electronic relaxation time (T1e) of the metal ion as described by Solomon–Bloembergen–Morgan theory. Modulation of any of these parameters by environmental factors can be used in the design of responsive MRI agents. The most frequently used methods involve alteration of the number and exchange kinetics of the water molecule(s) coordinated to the Gd3+ center, or changing the rotational correlation time (tumbling rate) of the complex by reversibly or irreversibly linking it to macromolecular structures.[2, 5, 7]
Spiropyrans and the related spirooxazines are well known for their photochromic properties.[25] The reversible light-induced spiropyran–merocyanine conversion has been the subject of active research since the discovery of the phenomenon in 1952. In an interesting application of these photochromic dyes, spiropyran and spirooxazine molecules were linked to a Gd3+-DO3A unit (DO3A =1,4,7,10-tetraazacyclododecane-1,4,7-triacetic acid) in a way that the oxygen atom of the dye molecule could coordinate to the central Gd3+.[26–28] In the dark, the contrast agent is present in the colored merocyanine form, which can be converted into the spiropyran derivative by irradiation with visible light.
Remarkably, the isomerization of the merocyanine unit in complex 1 to the spirooxazine derivative could also be brought about by the redox stimulus of NADH, although the mechanism is unclear, as it appears that electron transfer from NADH to the complex does not occur (Figure 1). Interestingly, other reducing agents, including L-cysteine and L-ascorbic acid, did not induce isomerization. The spirooxazine isomer could be partially converted back into the merocyanine derivative by H2O2. In this system, the spirocyclic isomer has significantly higher r1 value than the merocyanine form (r1 = 8.60 versus 5.56 mM−1s−1, respectively), and relaxivity measurements as well as the determination of the number of inner-sphere water molecules by 17O NMR confirmed that complex 1 has one bound water molecule while the merocyanine isomer 2 has two.
Figure 1.
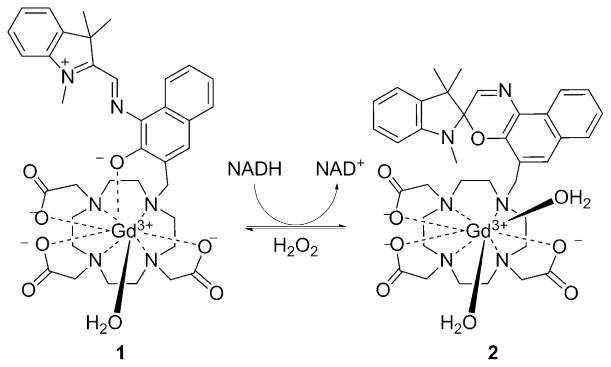
The conversion of merocyanine derivative 1 into spyrooxazine form 2, reportedly by NADH, increases q and hence the r1 proton relaxivity.[26–28]
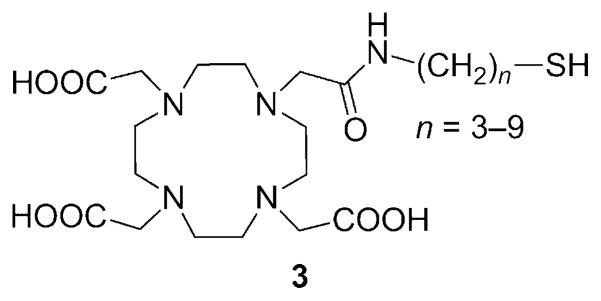
Reversible or irreversible linkage of low molecular weight Gd3+ chelates to larger molecules (i.e., the non-covalent interaction between a suitably functionalized Gd3+ chelate and human serum albumin) has often been used as a way to increase τR and thereby achieve higher relaxivities.[29] This principle has been exploited in the design of redox-responsive agents that bind reversibly to human serum albumin (HSA) in a redox-sensitive fashion. A series of Gd3+-DOTA mono(amide) (DOTA =1,4,7,10-tetraazacyclododecane-1,4,7,10-tetraacetic acid) derivatives with free thiol groups that can form a covalent -S–S- bond with the cysteine-34 (Cys34) residue of HSA have been synthesized (ligand 3, Figure 2).[30–32] When bound to albumin, the r1 relaxivity of Gd3+ complexes is higher than in the unbound form due to the increased rotational correlation time (slower tumbling rate) of the complex (5.3 versus 2.33 mM−1 s−1, respectively, for complex n =6 at 4.7 T). The thiol/disulfide ratio depends on the extracellular redox state, and in reducing microenvironments, the albumin-bound Gd3+ complexes are cleaved from HSA by reduction of the disulfide bond. Other thiol-containing molecules, L-homocysteine in particular, compete for the same binding site, and the apparent binding constant of the complexes decreases with increasing homocysteine concentrations.
Figure 2.
The utility of complex 3 (n =6) as an MRI reporter of tumor redox status, as demonstrated in in vivo experiments with mice bearing Mia-PaCa-2 or NCI-N87 tumor xenografts, revealed significant contrast enhancement after the animals were treated with a glutathione synthesis inhibitor or the thiol-oxidizing anticancer drug Imexon (Figure 3). These compounds deplete the local concentration of thiols competing for the Cys34 binding site, thereby increasing the ratio of the albumin-bound complex.[33]
Figure 3.

Longitudinal relaxation rates (ΔR1) 60 min after injection of Gd3+-3 (0.05 mmol kg−1, n =6) in Mia-PaCa-2 tumors after treatment with saline (□) or the γ-glutamylcysteine synthetase inhibitor, L-buthionine-S,R-sulfoximine (■) (n=8, *p<0.034) and in NCI-N87 tumors after single-dose treatment with saline (□) or the thiol oxidizing drug Imexon (■) (n =8, **p <0.001).[33]
Another thiol-targeting complex, Gd3+-4 (Figure 4) modulates its r1 value by the hydration state (number of inner-sphere waters) of the Gd3+.[34] Gd3+-4 contains a thiol-reactive 2-pyridyldithio functionality and when the complex reacts with a thiol that has a carboxyl group such as glutathione, L-cysteine, or β-mercaptopropionic acid, the resulting product was found to have about half of the relaxivity of the starting Gd3+ complex (Figure 5). This has been explained by the decrease of the Gd3+-bound water molecules from q =2 of the Gd3+-DO3A system to q =1 due to coordination of the carboxylate group present in the thiol. Larger relaxivity differences could be achieved by forming an inclusion complex between Gd3+-4 and β-cyclodextrin (β-CD) or poly-β-CD.[34]
Figure 4.

Thiol-reactive ligands based on DO3A and DTPA. The 2-pyridyldithio function of the Gd3+ complexes reacts with free thiol groups to form an -S–S- bond.[34, 38–40]
Figure 5.

Reaction of Gd3+-4 with glutathione results in a decrease in r1 relaxivity as the number of inner-sphere water molecules decreases from q =2 to q =1. The relaxivity data were collected at 0.235 T, pH 7.4 and 25 °C.[34]
Exofacial protein thiols (EPTs) are a pool of –SH groups attached to proteins that are expressed on the surface of various cells in the range of 3–18 × 109 -SH groups per cell. As these thiol groups are located on the extracellular surface, it has been proposed that they may act as sensors of the cell’s redox state.[35] The thiol groups are present as free -SH or in the oxidized -S–S- form depending on the extracellular redox state. Given the greater oxidizing environment of the extracellular space, most -SH groups on the cell surface are present in the form of disulfide bridges. EPTs mediate thiol-dependent uptake of a wide range of compounds including peptides, oligonucleotides, polymers, nanoparticles, and fluorescent dyes.[36] The uptake requires the presence of free -SH groups, the actual level of which is determined by the extracellular redox micro-environment and can be blocked by thiol-reactive reagents such as N-ethylmaleimide.[37] It has been shown that Gd3+-5 and structurally similar Gd3+ complexes of 6, 7, and 8 (Figure 4) can also interact with EPTs. Upon formation of a disulfide bridge (see reaction scheme in Figure 4), the complexes are internalized and accumulate inside the cell (as many as 1.2 × 10¹⁰ Gd3+ atoms per single cell) as demonstrated by in vitro MR imaging (Figure 6).[38, 39]
Figure 6.

Cell labeling experiments with Gd3+-5. T1-weighted spin-echo MR images collected at 7.0 T of a phantom containing buffer solution (A), K562 cells incubated for 4 h with 2 mM Gd3+-DO3A (B), unlabeled cells (C), cells labeled with Gd3+-5 at 1 mM (D) and 2 mM (E).[38]
It has also been shown that the amount of Gd3+ inside the cell could be modulated by the redox state of the exterior thiol groups; when cells were treated with the reducing agent tris(2-carboxyethyl)phosphine (TCEP), which converts all thiol groups into the -SH form, the Gd3+ content was higher than that after treatment with N-ethylmaleimide. Interestingly, the nature of the Gd3+ chelate also had a great influence on uptake. The DO3A derivatives were taken up efficiently, whereas the DTPA derivatives Gd3+7 and Gd3+8 showed very low or non-detectable uptake even though they also react with the thiol groups of EPTs. It has been postulated that efficient uptake may require a neutral complex, as the heptadentate DO3A derivatives form neutral complexes with Gd3+, while the octadentate DTPA-based ligands yield negatively charged complexes.[39] This assumption was supported by the fact that excess lactate significantly inhibits uptake (up to 73 %) of the Gd3+-DO3A-based probes, likely due to formation of a lactate–Gd3+-DO3A ternary complex that possesses one negative charge and no inner-sphere water molecule.[39] An alternate explanation might be that the uptake may require the formation of a ternary complex with carboxylates of EPTs or phosphate headgroups of the membrane lipids.[39] In vivo experiments performed with mice bearing B16 melanoma tumor xenografts showed that the tumor cells could be labeled with Gd3+-5 by the EPT-mediated route, but this required high concentrations of the probe at the tumor site which was achieved by direct injection of the agent into the tumor.[40]
A novel nanoscale MRI redox sensor system was constructed by encapsulating Gd3+-9 in nanocapsules generated by cross-linking thiolated β-CD.[41] Gd3+-9 has a benzyl group that fits in the cavity of β-CD, and formation of the inclusion complex promotes the efficient encapsulation of the complex into the nanocapsule (Figure 7). As expected, the Gd3+-loaded nanocapsule had the highest relaxivity at 4.7 T (r1 = 19.3 mM−1s−1 per Gd) followed by the monomeric inclusion complex (11.9 mM−1s−1) and then free Gd3+-9 (7.3 mM−1s−1), reflecting the relative molecular mobility of the particles. In reducing environments (simulated by adding TCEP to the solution) cleavage of the disulfide bridges leads to degradation of the nanocapsules and subsequent release and partial dissociation of the β-CD inclusion complex. As a result of the decrease in rotational correlation time, the T1 relaxation rate (1/T1 = R1) of the solution decreased and reached a plateau after ~4–5 h as full degradation of the nanoparticles took place (Figure 8).
Figure 7.

Reductive -S–S- bond cleavage by TCEP results in the dissociation of the disulfide-linked β-CD nanocapsules, releasing Gd3+-9.[41]
Figure 8.

Time-dependent decrease in R1 due to the slow degradation of disulfide-linked β-CD nanocapsules loaded with Gd3+-9 in the presence of TCEP. The smaller control sample contained a solution of nanocapsules in the absence of TCEP. The relaxivity data were collected at 1.0 T and 37 °C.[41]
T1 agents based on redox-active metal
For practical reasons, it is advantageous to introduce a redox-sensitive moiety into a Gd3+-based chelate with well-established relaxation, kinetic, and thermodynamic properties. The relaxivity of the complexes described above were solely modulated through changes in the ligand structure or molecular rotation (the oxidation state of Gd3+ remains the same); neither the reduced nor the oxidized forms are ever completely silent in terms of T1 relaxation. However, complexes of redox-active metal ions, in which the oxidation states have different magnetic properties, can be used to create MRI agents that directly sense redox changes. For some metal ion redox systems, the relaxivity of either the reduced or oxidized form is zero or negligible, and in these cases on/off sensors can be designed. The Eu2+/Eu3+ redox couple is a classic example of such a system.
Eu2+, being isoelectronic with Gd3+, has seven unpaired electrons in an 8S7/2 ground state. Eu2+ complexes have more favorable (faster) water exchange kinetics than the corresponding Gd3+ complexes, and for these reasons, there has been some effort toward developing Eu2+-based MRI agents.[42, 43] However, Eu2+ has a shorter electronic relaxation time than Gd3+ in most but not all of the Eu2+ complexes examined so far. As a consequence, the r1 relaxivity of a Eu2+ complex is often somewhat lower than that of typical Gd3+ chelates. Interestingly, Eu3+ would be diamagnetic based on its ground state (7F0), but it actually has a small magnetic moment due to contributions from the thermally accessible 7F1 and 7F2 states. Nevertheless, the paramagnetic relaxation effect of Eu3+ is negligible relative to Eu2+. Most Eu2+ polyaminopolycarboxylate complexes have a redox potential significantly lower than that of the Eu2+ aqua ion, and this severely limits the potential for their use in vivo. On the other hand, Eu2+ cryptates (Figure 8) proved to be more stable toward oxidation and offered further advantages. Eu2+-10, for example, was shown to have relatively slow electron-spin relaxation and two inner-sphere water molecules, affording a relaxivity of 8 mM−1s−1 at 0.47 T and 298 K.[44] Further improvement on the redox stability of the Eu2+ cryptates has been achieved recently by substituting soft donor atoms such as sulfur for some of the oxygen donor atoms in cryptand-based ligands (Figure 9).[45] Eu2+-11 has a redox potential that is 666 mV more positive than the aqueous Eu2+. Modification of 10 yielded a series of Eu2+ cryptates, the relaxivity of which slightly increases with increasing field strength (4.39 mM−1 s−1 at 1.4 T and 4.80 mM−1s−1 at 11.7 T at 37 °C for Eu2+-12).[46–48] The potential use of Eu2+ complexes as probes sensitive to pO2 has been proposed, but none of the aforementioned complexes have been tested in vivo, likely because the necessary oxidative stability of the Eu2+ state has not yet been fully achieved.[49]
Figure 9.

Divalent manganese (Mn2+) forms high-spin complexes (five unpaired electrons) with many ligands, so several types of Mn2+ complexes have been examined as contrast agents for MRI even though their T1 relaxivity is not as high as that of most Gd3+ complexes. Unlike gadolinium, manganese has several stable oxidation states. Aime et al. first proposed the use of a Mn2+/Mn3+-based contrast agent as an oxygen sensor.[50] The Mn3+ complex of the water-soluble porphine derivative 13 (TPPS; Figure 10) has been studied as a potential tumor imaging agent. The nuclear magnetic resonance dispersion (NMRD) profiles of Mn2+-13 and Mn3+-13 are quite different (Figure 11).[50] At low fields (less than ~0.2 T), the r1 relaxivity of Mn2+-13 is more than threefold higher than that of Mn3+-13, whereas at clinically relevant fields (1H frequency: 60–120 MHz), the differences are quite small at 25 °C. It has been shown that the relaxivity of Mn2+-13 is limited by the rotational correlation time, while the r1 value of Mn3+-13 is determined by the electronic relaxation rate of the Mn3+ ion. Thus, relaxivity difference between Mn2+/Mn3+-13 could be significantly amplified by the addition of poly-β-CD, because although both complexes were encapsulated, only the r1 value of Mn2+-13 increased significantly (Figure 12) as a result of increasing rotational correlation time. The poly-β-CD adduct of Mn2+-13 was shown to be oxidized completely to Mn3+-13 in the presence of 40 torr pO2 (with a corresponding 50 % drop in relaxivity). The extent of oxidation and the observed relaxivity were shown to be roughly proportional to the pO2 at oxygen levels less than 40 torr. Because the pO2 of venous blood vessels is ~40 torr, this system may be useful in the MR differentiation of arterial and venous blood vessels.
Figure 10.

Figure 11.
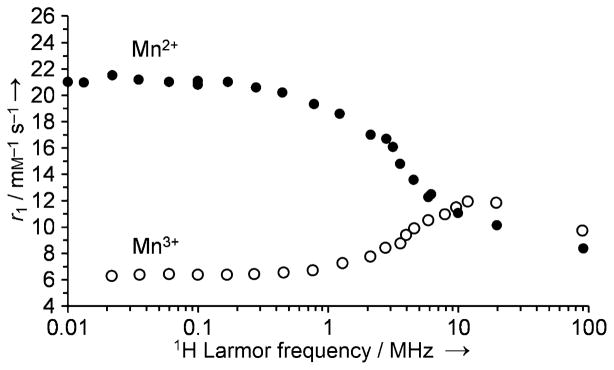
The NMRD profile of Mn2+-13 and Mn3+-13 in 1 mM solution at pH 7 and 25 °C.[50]
Figure 12.

The effect of supramolecular adduct formation with poly-β-CD on the relaxivity of Mn2+-13 and Mn3+-13. The relaxivity data were collected at 0.47 T, pH 7.0, and 25 °C.[50]
Another redox-activated manganese-based agent was reported recently. The ligand hydroxybenzylethylenediaminetri-acetic acid 14 (HBET; Figure 10) is capable of stabilizing both the 2 + and the 3+ oxidation states of manganese.[51] At 4.7 T, Mn2+-14 showed a 3.3-fold higher relaxivity (~4 mM−1 s−1) than its Mn3+ counterpart (~1.2 mM−1s−1) largely due to the fact that Mn2+-14 has one inner-sphere molecule, whereas Mn3+-14 has none. The higher r1 value of Mn2+-14 is clearly demonstrated by phantom images (Figure 13).
Figure 13.

T1-weighted MR images of a phantom containing solutions of Mn2+-14, Mn3+-14, and water recorded at 4.7 T, pH 7.4, and room temperature.[51]
The Mn3+-14 complex could be reduced to Mn2+-14 by GSH at low-millimolar concentrations. The rate of reduction was found to be linearly proportional to the concentration of both glutathione and Mn2+-14, with a second-order rate constant of 3.8 × 10⁻¹M−1s−1, so the R1 relaxation rate of solutions containing glutathione and Mn2+-14 increases as the reaction proceeds. While the half-life of Mn2+-14 was 3–30 min in the presence of 1–10 mM glutathione (intracellular levels), it is expected to be significantly longer (over a week) in blood plasma, which typically contains only 2–20 μM glutathione. The Mn2+/Mn3+-14 system was found to be a reversible one-electron redox couple by cyclic voltammetry with a biologically accessible reduction potential (0.356 V versus normal hydrogen electrode). This allows facile reduction and oxidation by physiologically relevant compounds such as glutathione and H2O2. Although Mn2+-14 does not have satisfactory kinetic inertness for in vivo applications[52] (the complex was not kinetically stable in the presence of EDTA), the favorable redox properties of this complex will undoubtedly stimulate further research to develop structurally related redox-sensitive probes with improved stability.
PARACEST redox agents
Chemical exchange saturation transfer (CEST) agents alter MR image contrast by transferring selectively saturated 1H spins from a small proton pool into the bulk water pool. For CEST to occur, the proton exchange rate between the two pools (kex) must be in the slow-to-intermediate exchange regime (kex ≤ Δω, where Δω is the chemical shift difference between the two pools). The optimal exchange rate for maximum CEST depends on the applied saturation power, B1, according to the relationship: kex = 1/τM = 2 πB1.[8, 53–56] PARACEST agents are paramagnetic lanthanide or transition-metal complexes that have an exchangeable inner-sphere water molecule or labile ligand -NH, -OH, -SH protons. Depending on their geometric orientation and distance from the metal ion, the 1H NMR signal of these protons can have extremely large hyperfine chemical shifts due to the paramagnetic effect of metal. Large Δω values are considered advantageous, because it allows the use of faster exchanging systems and has the added advantage of reducing partial off-resonance saturation of the bulk water signal by the pre-saturation pulse. Unlike Gd3+- and Mn2+-based T1 agents, image contrast can be turned on and off in PARACEST agents by application of a frequency-selective pre-saturation pulse. The overall CEST efficiency is determined by a number of variables including the exchange rate (kex), power of the applied pre-saturation pulse (B1), and the relaxation times of the exchanging pools. Assuming complete saturation of the exchangeable proton pool, net magnetization of bulk water protons (Mz/M0) at steady-state is:
| (2) |
in which τM is the residence lifetime (kex = 1/τM), c is the concentration of the contrast agent, and q is the number of exchanging water molecules. For PARACEST agents with exchanging protons, q would be equal to the number of exchanging -NH or -OH protons per molecule, and the term 55.5 would be replaced by 111. Any of the parameters appearing in Equation (2) can be altered to create a responsive PARACEST agent, but the most assessable of these is the water or proton lifetime, τM.
Eu3+ complexes formed with (DOTA)-tetraamide ligands typically display the slowest water exchange rates of all Ln3+ complexes; consequently these have been the most widely used complexes to date to create new PARACEST sensors. The extreme sensitivity of the metal-bound water exchange rate to electronic effects of the ligand pendant arms and alterations in the coordination geometry offer many possibilities for the design of responsive MRI contrast agents.
Some time ago we demonstrated that reduction of the p-nitro group in Eu3+-15 (Figure 14) to the p-amino derivative by catalytic hydrogenation was sufficient to alter the water exchange rate in this complex.[57] The next result was that the oxidized form (p-NO2) had ~ 30 % stronger CEST signal than the reduced form (p-NH2; Figure 15). Based on this result, a biocompatible PARACEST redox sensor was developed by mimicking one of the most important biological redox systems, the NADH/NAD+ couple.[58] Eu3+-16, containing two N-methylquinolinium moieties as redox-active functional groups,[59] was nearly MRI silent in its oxidized form, but was turned on after reduction to the dihydroquinoline derivative by NADH (Figure 16). The larger CEST signal upon reduction arose from the slower, more optimal water exchange rate of the reduced form (τM = 90 μs). The τM value of the oxidized form could not be determined due to the weak CEST effect, but the broad line width of the CEST signal was consistent with faster water exchange. Cyclic voltammetry studies of Eu3+-16 revealed that the redox couple is not reversible, as the reduced complex was not completely oxidized back to the N-methylquinolinium derivative likely due to the instability of the reduced species.[58]
Figure 14.

Figure 15.
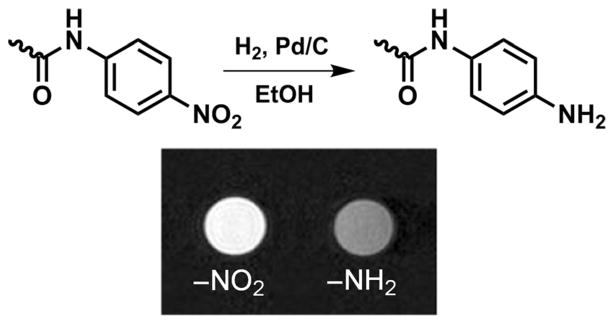
Reduction of Eu3+-15 by catalytic hydrogenation. The CEST difference images of a phantom containing Eu3+-15 and its reduced form (20 mM in H2O/CD3CN) were acquired at 9.4 T and 25 °C, with B1 = 24 μT at −47.5 and +47.5 ppm.[57]
Figure 16.

CEST spectra of Eu3+-16 and the reduced dihydroquinoline form collected at 9.4 T, pH 7, 25 °C using a 5 s pre-saturation pulse (B1 = 10 μT). The insert shows spin-echo water images of a phantom containing (A) Eu3+-16 (20 mM) in HEPES buffer (pH 7, 0.25 M); (B) Eu3+-16 (20 mM) and NADH (2 equiv.) in HEPES buffer (pH 7, 0.25 M); (W) water; and (H) HEPES buffer at pH 7.[58]
CEST also depends on the longitudinal relaxation time (T1) of the bulk water pool, and this can also be used to modulate the CEST signal. We recently reported a Eu3+-(DOTA-tetraamide) complex containing two nitroxide free radical groups (Eu3+-17, Figure 14).[60] Nitroxides, popular electron-spin resonance (ESR) probes, have been used to study tissue redox and hypoxia, as they are easily reduced to diamagnetic hydroxylamines.[61–68] The CEST signal of Eu3+-17 is relatively weak due to T1 shortening of bulk water protons by the paramagnetic nitroxides.
However, upon reduction to the bis(hydroxylamine) derivative by L-ascorbate, the CEST signal increased in intensity significantly due to an increase in T1 of bulk water protons. As expected, reduction of the nitroxide did not affect the exchange rate of the Eu3+-bound water molecule (85 versus 81 μs after reduction).[60] The formation of the hydroxylamine derivative was also confirmed by ESR and mass spectrometry. When administered into healthy mice by tail vein injection, the complex appeared in the bladder rather quickly due to efficient renal filtration. MR images of the bladder showed no CEST signal (as expected for chemically unmodified, intact complex), yet the presence of agent was evident by the slightly brighter water signal in the T1-weighted images (Figure 17d,e). Subsequent ESR spectra of urine collected from the bladder verified that the complex was indeed intact. The complex was subsequently reduced in vivo after injection and renal clearance of L-ascorbate which resulted in formation of the diamagnetic hydroxylamine and concomitant activation of CEST in the bladder (Figure 17i). While the agent has not been tested in animal models of disease, one can reasonably anticipate that the reduction of the nitroxide units would proceed much more rapidly under low oxygen conditions, and thus Eu3+-17 and similar complexes could have potential applications as PARACEST reporters of hypoxia and ischemia.[60]
Figure 17.

CEST images of the bladder of a female black-6 mouse recorded at 9.4 T and 37 °C. Top row: pre-injection spin-echo images with saturation at (a) −43 ppm and (b) +43 ppm. The CEST difference image (c) was obtained by subtracting on-resonance image (b) from the off-resonance image (a). Middle row: similar off-resonance (d), on-resonance (e), and difference (f) images taken 10 min after tail vein injection of Eu3+-17 (0.1 mmol kg−1 dose in 100 μL) into the same mouse. Bottom row: off-resonance (g), on-resonance (h), and difference (i) images taken 1 h after an intravenous dose of L-ascorbate (0.1 mmol kg−1, 100 μL).[60]
Aime and co-workers recently reported a redox-sensitive dual 1H MRI probe based on gadolinium-doped lipoCEST agents.[69–71] For CEST to occur between two exchangeable pools of 1H spins, the exchange rate and the difference between the resonance frequencies must satisfy the Δω≥kex requirement.[3] Liposomes contain a large number of exchangeable protons in the form of intraliposomal water molecules whose exchange rate across the lipid membrane is limited. The water proton signal in samples of liposomes loaded with high concentrations of certain paramagnetic Ln-based shift reagents show two water peaks, one from intraliposomal water and another for extraliposomal bulk water. Selective saturation of the intraliposomal resonance results in a decrease in the signal of extraliposomal water due to CEST. Such systems, referred to as lipoCEST agents, offer extremely high sensitivity due to the large number of exchanging protons.[72] When a paramagnetic Gd3+ complex (Gd3+-5) was attached to the outer surface of the liposomes, the lipoCEST effect was diminished because the CEST effect is inherently dependent on the T1 relaxation of the bulk water pool [Eq. (2)].[50]
Gd3+-5 was conjugated to a conventional (spherical) lipoC-EST agent that contained a lipid bilayer component molecule with a 3-(2-pyridyl)dithiopropionate moiety at the terminal end of the polar headgroup (LipoCEST-PDP). This functionality allowed the use of the redox-cleavable disulfide bond (-S–S-) to link a Gd3+-DO3A unit to the surface of the liposome. The liposomal LipoCEST-S-S-Gd3+-DO3A construct had a r1 relaxivity of 10 mM−1 s−1 per Gd3+, only ~20 % higher than free Gd3+-DO3A. This was consistent with a relatively short rotational correlation time of the conjugated complex due to the flexible linker. Nevertheless, addition of TCEP to release the liposome-bound Gd3+ complex by cleavage of the -S–S- bonds resulted in full restoration of the lipoCEST signal (Figure 18). Notably, this dual T1-CEST system is not limited to redox sensing, as linkers cleavable by other stimuli could be incorporated in a similar fashion.
Figure 18.
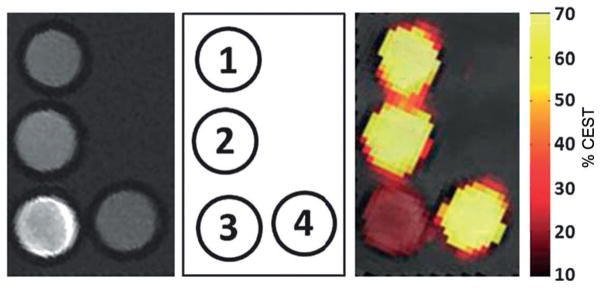
MR images of a phantom containing: (1) LipoCEST-PDP, (2) LipoC-EST-SH, (3) LipoCEST-S-S-Gd3+-DO3A, and (4) sample 3 after reduction with TCEP and removal of the detached Gd3+-DO3A-SH complex. Left: T1-weighted images; right: CEST map upon irradiation at 3.5 ppm overlaid on a T2-weighted image of the phantom. The MR experiments were performed at 7 T and 37 °C.[69]
A successful PARACEST agent requires the metal ion to induce large paramagnetic shifts to but have little or only minor influence on the relaxation of bulk water protons as determined by the electronic relaxation time (T1e) of the metal ion. Conventional PARACEST agents have been based on Ln complexes due to the favorable magnetic properties of these metal ions. Transition metals can also produce extremely large hyperfine shifts, but often induce strong line-broadening effects and have only recently been considered for PARACEST. However, transition-metal-ion-based PARACEST agents can offer some advantages for the design of responsive agents in that they can exist in a number of oxidation states, and their spin state can also depend on ligand field. Several Ni2+, Fe2+, and Co2+ complexes with exchangeable -NH or -OH ligand protons have recently been demonstrated as potential PARAC-EST MRI contrast agents.[73–78] Relevant to this review, Co2+-18 (Figure 19) has sufficiently low T1 and T2 relaxivities (0.093 and 0.50 mM−1 s−1, respectively) for CEST.[79] The pyrazole -NH protons of this complex show a narrow CEST peak ~135 ppm downfield from the bulk water resonance, while the chemical shift of the oxidized Co3+ form (diamagnetic) is much closer to water.
Figure 19.

PARACEST spectrum of 18 acquired in a solution containing 8.0 mM complex, 100 mM NaCl, and 20.0 mM HEPES buffer (pH 7.0), at 11.7 T, 37 °C using a 3 s pre-saturation pulse (B1 = 24 μT).[79]
The CEST signal at 135 ppm is advantageous in that it should allow in vivo CEST imaging with less interference from the tissue magnetization transfer (MT) background. As expected, the intensity of the CEST signal was pH dependent over the pH range 6–8 due to base-catalyzed proton exchange. Base catalysis accelerates the exchange rate, reaching the optimum for CEST at pH 6.9, and becomes faster than optimal at higher pH values. The redox properties of this complex are also quite encouraging, because it forms a reversible redox couple with a moderately negative reduction potential. The rate of oxidation of 18 has a second-order rate constant of 0.43 M−1s−1, meaning that its half-life in arterial blood (where oxygen concentration is high) would be 2.6 h, but could extend up to 26 h under hypoxic conditions. Overall, the favorable CEST and redox properties of Co2+-18 identify it as a promising candidate for the development of redox-sensitive MRI contrast agents.
Hypoxia-sensitive MRI contrast agents
Hypoxia, a condition of insufficient O2 levels to support metabolism, can be general (systemic) or local.[80] Local hypoxia occurs when the vascular supply is interrupted, as in stroke or myocardial infarction, or can be a consequence of poor perfusion in diabetic limbs or arthritic joints. Perhaps the clinically most important manifestation of local hypoxia occurs in solid tumors when cancer cells outgrow their blood supply. Hypoxia in tumors was first described by Thomlinson and Gray, who observed that heterogeneous regions of hypoxic cells are formed just beyond the diffusion distance of oxygen from blood vessels (100–150 μm) adjacent to the necrotic core.[81] The presence of hypoxic regions in tumors is associated with resistance to radio- and chemotherapy and in general, with poor prognosis. Hypoxia is intricately linked to tissue redox state and oxygen homeostasis. Hyperoxia (higher than normal oxygen levels) promotes the formation of ROS and, surprisingly, so does hypoxia, because insufficient O2 results in accumulation of NADH and FADH2, and these species drive partial reduction of any remaining O2 to produce the ROS, superoxide and peroxide. It has been suggested that hypoxia can be described as a redox disequilibrium: repeated cycles of anoxia (total lack of oxygen) followed by reoxygenation.[82] It is important to emphasize that the effects of hypoxia on cells has much broader implications than simply suppressed electron transport and oxidative phosphorylation. Hypoxia also promotes production of the transcription factor hypoxia-inducible factor 1 (HIF-1) to help the cell cope with low oxygen (pO2 < 10 torr O2). HIF-1 induces expression of several other genes that affect angiogenesis, glycolysis, tumor cell survival, and eventually leads to the emergence of a more aggressive cancer phenotype.[83–88]
The conventional way of detecting ROS is by fluorescence or luminescence, but these have limited in vivo applicability.[89–91] Recently there have been a few reports of ROS-specific MR probes; these include a Mn2+ complex, which forms a dinuclear species upon reaction with H2O2 and a Eu3+-based PARACEST agent that reacts with singlet oxygen.[92, 93] Hyperpolarized [2-13C]benzoylformic acid has also been used for the 13C MR imaging of H2O2.[94] Several methods including polarography, immunohistochemical staining, ESR oximetry, optical imaging, PET and SPECT imaging, as well as MR techniques (BOLD MRI, 19F MRS) are available for the assessment of hypoxia, each having its own advantages and disadvantages. These have been reviewed elsewhere.[95–111] Among the endogenous and exogenous molecular probes that have been used for the non-invasive imaging of tumor hypoxia, nitroaromatic compounds have proven to be the most useful.[109] These compounds are selectively reduced by nitroreductases, which are overexpressed under low oxygen levels. The hypoxia-targeting ability of a nitroaromatic compound largely depends on the reduction potential of the nitro group and, in aerobic cells, effective reduction requires a moderately negative redox potential.[112] 2-Nitroimidazole meets this requirement, so the majority of hypoxia-targeting agents contain the 2-nitroimidazole functionality. Reduction occurs intracellularly and proceeds through reactive intermediates that covalently bind to intracellular macromolecules such as RNA, DNA, and proteins, thereby irreversibly trapping any functional group attached to the nitroimidazole core. A number of hypoxia-selective immunohistochemical, fluorescence, PET, SPECT, and MR spectroscopy probes have been developed that accumulate in hypoxic cells.[112–115] These include 68Ga3+ and 64/67Cu2+ chelate 2-nitroimidazole conjugates, which showed sufficient uptake in hypoxic tumors for PET/SPECT imaging.[116,117] Compared with the relatively large number of radiolabeled nitroimidazole derivatives, the design and synthesis of nitroimidazole Gd3+ chelate conjugates have received little attention. This likely reflects the low confidence of the scientific community in the ability of these systems to deliver sufficiently high amounts of gadolinium to hypoxic tissues for detection by MRI, as the detection limit (~10–50 μM) is several orders of magnitude higher than that of PET (< nM).[71, 118]
Recent data, however, suggest that MR imaging of hypoxic tumors with nitroimidazole conjugates of Gd3+ complexes may be feasible. To the best of our knowledge, the only example of a nitroimidazole-conjugated Gd3+ complex to date is Gd3+-19 (Figure 20).[119] To facilitate cellular uptake, ligand 19 was designed to form a neutral complex with Gd3+. A relatively long linkage was included between the Gd3+-(DOTA-monoamide) unit and the 2-nitroimidazole moiety to increase the overall lipophilicity of the complex as well as to eliminate or minimize any undesirable interference between the Gd3+ coordination sphere and the 2-nitroimidazole unit. Uptake of Gd3+-19 in hypoxic cells was first tested in vitro; 9L rat glioma cells maintained under nitrogen (hypoxic) versus oxygen (normoxic) gas were incubated with a 5 mM solution of Gd3+-19. The agent entered both hypoxic and normoxic cells, but was trapped only in cells maintained under N2 as evidenced by an approximate twofold decrease in T1. Similar experiments performed with a control complex, Gd3+-20 (Figure 20), showed that it also accumulated in hypoxic cells, but unlike the nitroimidazole derivative, was not retained.
Figure 20.
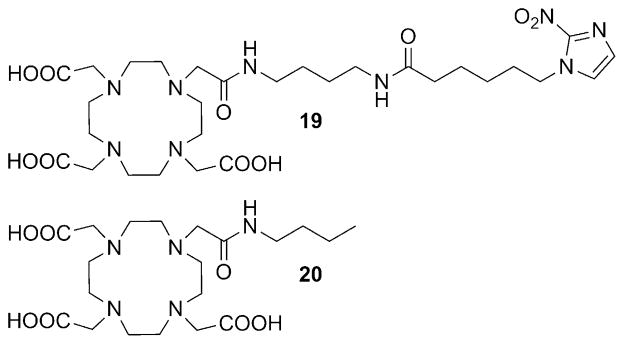
Structures of the 2-nitroimidazole DOTA conjugate 19 and DOTA mono(butylamide) 20.[119, 120]
The hypoxia-targeting property of these complexes was also compared in rats bearing subcutaneous prostate tumors that were shown to be extensively hypoxic by 19F MR oximetry. In agreement with the in vitro results, Gd3+-19 enhanced the poorly perfused and potentially hypoxic central region of the tumor significantly more than the control complex (Figure 21). In addition, Gd3+-19 showed statistically significant difference in contrast enhancement between the well-perfused peripheral and hypoxic central regions at late time points (80–145 min post-injection), whereas Gd3+-20 did not.[120]
Figure 21.
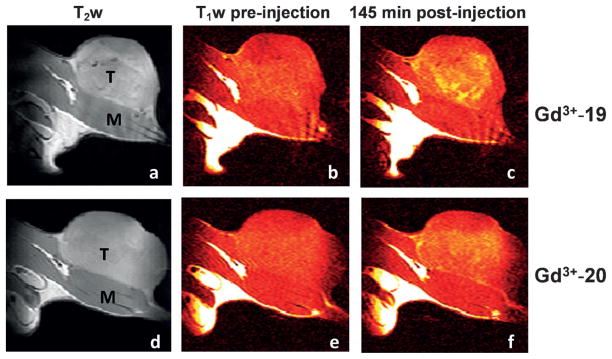
Grayscale T2-weighted (a, d) and color T1-weighted (b, c, e, f) MR images recorded at 4.7 T and 37 °C of Copenhagen rat thighs bearing syngeneic Dunning prostate R3327-AT1 tumors following intravenous administration of Gd3+-19 (0.1 mmol kg−1; a–c) or 0.1 mmol Gd3+-20 (0.1 mmol kg−1; d–f) before injection (b, e) and 145 min post-injection (c, f). T =tumor and M =thigh muscle.[120]
A conceptually different design for a hypoxia-sensitive MR agent involves modulation of the r1 relaxivity of a Gd3+ chelate upon reduction of a nitroaromatic group in a hypoxic environment.[121] Gd3+-DOTA derivatives having one ethylenearylsulfonamide side arm show pH-dependent r1 relaxivity as a result of the deprotonation and coordination of the sulfonamide nitrogen atom to the central Gd3+. The r1 value decreases with increasing pH following an inverted sigmoid curve with an inflection point at the pKa value of the sulfonamide nitrogen.[122] Based on this design, a series of p-nitrobenzenesulfonamide derivatives was prepared, and all showed pH-dependent r1 values. The complexes are also sensitive to redox, because reduction of the electron-with-drawing -NO2 group to the electron-donating -NH2 shifts the pKa of the sulfonamide nitrogen from ~5.3 to ~7. As a result, the difference in r1 at pH 7.4 could be used to detect chemical reduction of the nitro group (Figure 22). Among the various nitrobenzensulfonamides tested, the 2-methoxy-4-nitrobenzene-sulfonamide derivative 21 gave the best performance, affording a 1.8-fold increase in r1 upon reduction. Although in vivo experiments were not performed, complex 21 was selectively reduced by rat liver microsomes under hypoxic conditions in vitro. Because the extracellular pH in tumors can vary considerably (pH 5.8–7.6),[123] the pH-dependent behavior of these agents may make it necessary to independently measure tissue pH prior to obtaining quantitative redox maps of these agents.
Figure 22.

Structures and pH dependence of the r1 relaxivity of Gd3+-DOTA derivatives bearing 2-methoxy-4-nitrobenzenesulfonamide (21) and 2-methoxy-4-aminobenzenesulfonamide groups (22). The relaxivity data were collected at 37 °C.[121]
Current Limitations and Future Outlook
Over the past two decades, several structurally diverse metal-based MRI agents have been reported for redox sensing. These range from simple metal chelates to complex supramolecular structures. Not surprisingly, many of these agents target thiol-containing biomolecules, as these play a fundamental role in maintaining the redox state of the cell. Despite this progress, many limitations in the current designs must be overcome before such agents can be successfully used in vivo. First, there are limitations associated with image contrast itself. For example, how can one distinguish between an increase in image intensity associated with activation of a T1-based agent versus an increase in concentration of the un-activated agent? Most Gd3+ agents are never completely silent in an image, so this requires an independent measure of agent concentration before one can obtain quantitative redox maps of tissues based on changes in image contrast. One approach to solving this problem was illustrated by early attempts to obtain quantitative images of tissue pH. In this case, dynamic contrast enhancement measurements were performed after sequential injections of a pH-responsive Gd3+ agent followed by a chemically similar but non-responsive agent.[124–126] Using pixel-by-pixel differences in image intensities at each time point during washout of the two different agents and assuming identical pharmacokinetics, one can then obtain quantitative maps of tissue pH. Perhaps a simpler solution to this problem would be to use a pH-sensitive T1 agent that also contains a radionuclide for detection by PET or SPECT imaging.[127,128] As clinical MR-PET scanners become more common in the future, this approach should allow quantitative mapping of tissue pH, tissue redox state, and other physiological measures much more directly. Agents based on the Mn2+/Mn3+ or Eu2+/Eu3+ redox pairs may have some advantages over Gd3+-based agents, in that the oxidized forms in each pair are less magnetic and hence produce little-to-no MR contrast. Nevertheless, the intensities of the reduced forms in each pairing will still require image calibration to obtain quantitative redox maps of tissues. Ratiometric approaches have been developed for T1 agents based on the comparison of two independent parameters such as R1 and R2 values, the ratio of which is concentration independent.[129] Unlike T1- or T2-based agents, PARACEST agents with chemical exchange peaks that shift frequency upon activation[130] are arguably the most attractive platform for imaging tissue redox, but these currently suffer from a different limitation: lower contrast sensitivity per molecule than T1- or T2-based agents. This limitation may ultimately be overcome either by improved imaging methods to activate such agents or by amplification through nanoparticles such as responsive lipoCEST agents.
Many of the agents described herein do not undergo redox chemistry over a biologically reasonable range, so their redox chemistry must also be fine-tuned for optimal sensing in vivo. In other cases, the thermodynamic stability and/or kinetic inertness of some redox-active metal chelate complexes may not be sufficient to ensure safety in vivo. Cell permeability is another important consideration for targeting intracellular redox status. Most of the agents summarized herein, except for those transported into cells via EPTs (Gd3+ complexes of ligands 5, 6, 7, and 8; Figure 4), likely remain in extracellular spaces in vivo even though this may not be the redox environment one intends to monitor. This question is not often considered in the design of many of these redox sensors, but clearly, for the field to move forward, we must consider redox differences between the various tissue compartments and we must know the physical location of any redox sensor. Ideally, new MRI sensors that can differentiate and perhaps measure both the extracellular and intracellular redox state would be welcomed. The field of redox sensing is clearly in its infancy. Many good model systems have been reported over the past 20 years, so now is the time to expand on the ideas to create more sensitive and specific sensors that can be localized to specific cell compartments for monitoring the redox environment of tissues in various disease states.
Acknowledgments
The authors thank the National Institutes of Health (CA115531, EB004582, EB015908), the Cancer Prevention Research Institute of Texas (RP130362), and the Robert A. Welch Foundation (AT-584) for research support during the writing of this manuscript.
References
- 1.Aime S, Caravan P. J Magn Reson Imaging. 2009;30:1259– 1267. doi: 10.1002/jmri.21969. [DOI] [PMC free article] [PubMed] [Google Scholar]
- 2.Caravan P, Ellison JJ, McMurry TJ, Lauffer RB. Chem Rev. 1999;99:2293– 2352. doi: 10.1021/cr980440x. [DOI] [PubMed] [Google Scholar]
- 3.Merbach A, Helm L, Tóth É, editors. The Chemistry of Contrast Agents in Medical Magnetic Resonance Imaging. Wiley; Hoboken: 2013. [Google Scholar]
- 4.Yoo B, Pagel MD. Front Biosci. 2008;13:1733– 1752. doi: 10.2741/2796. [DOI] [PubMed] [Google Scholar]
- 5.Major JL, Meade TJ. Acc Chem Res. 2009;42:893– 903. doi: 10.1021/ar800245h. [DOI] [PMC free article] [PubMed] [Google Scholar]
- 6.Terreno E, Castelli DD, Viale A, Aime S. Chem Rev. 2010;110:3019–3042. doi: 10.1021/cr100025t. [DOI] [PubMed] [Google Scholar]
- 7.Louie A. J Magn Reson Imaging. 2013;38:530– 539. doi: 10.1002/jmri.24298. [DOI] [PMC free article] [PubMed] [Google Scholar]
- 8.Viswanathan S, Kovács Z, Green KN, Ratnakar SJ, Sherry AD. Chem Rev. 2010;110:2960– 3018. doi: 10.1021/cr900284a. [DOI] [PMC free article] [PubMed] [Google Scholar]
- 9.Tsitovich PB, Burns PJ, McKay AM, Morrow JR. J Inorg Biochem. 2014;133:143– 154. doi: 10.1016/j.jinorgbio.2014.01.016. [DOI] [PubMed] [Google Scholar]
- 10.Hagen TM. Antioxid Redox Signaling. 2003;5:503– 506. doi: 10.1089/152308603770310149. [DOI] [PubMed] [Google Scholar]
- 11.Trachootham D, Lu W, Ogasawara MA, Nilsa RD, Huang P. Antioxid Redox Signaling. 2008;10:1343– 1374. doi: 10.1089/ars.2007.1957. [DOI] [PMC free article] [PubMed] [Google Scholar]
- 12.Chaiswing L, Oberley TD. Antioxid Redox Signaling. 2010;13:449–465. doi: 10.1089/ars.2009.3020. [DOI] [PubMed] [Google Scholar]
- 13.Schafer FQ, Buettner GR. Free Radical Biol Med. 2001;30:1191–1212. doi: 10.1016/s0891-5849(01)00480-4. [DOI] [PubMed] [Google Scholar]
- 14.Taniguchi N, Higashi T, Sakamoto Y, Meister A, editors. Glutathione Centennial: Molecular Perspectives and Clinical Implications. Academic Press; San Diego: 1989. [Google Scholar]
- 15.Ballatori N, Krance SM, Marchan R, Hammond CL. Mol Aspects Med. 2009;30:13– 28. doi: 10.1016/j.mam.2008.08.004. [DOI] [PMC free article] [PubMed] [Google Scholar]
- 16.Lushchak VI. J Amino Acids. 2012;2012:736837. doi: 10.1155/2012/736837. [DOI] [PMC free article] [PubMed] [Google Scholar]
- 17.Vandeputte C, Guizon I, Genestie-Denis I, Vannier B, Lorenzon G. Cell Biol Toxicol. 1994;10:415– 421. doi: 10.1007/BF00755791. [DOI] [PubMed] [Google Scholar]
- 18.Rahman I, Kode A, Biswas SK. Nat Protoc. 2007;1:3159– 3165. doi: 10.1038/nprot.2006.378. [DOI] [PubMed] [Google Scholar]
- 19.Befroy DE, Shulman GI. Diabetes. 2011;60:1361– 1369. doi: 10.2337/db09-0916. [DOI] [PMC free article] [PubMed] [Google Scholar]
- 20.Kaiser LG, Marjanska M, Matson GB, Iltis I, Bush SD, Soher BJ, Mueller S, Young K. J Magn Reson. 2010;202:259– 266. doi: 10.1016/j.jmr.2009.11.013. [DOI] [PMC free article] [PubMed] [Google Scholar]
- 21.Lu M, Zhu XH, Zhang Y, Chen W. Magn Reson Med. 2013 doi: 10.1002/mrm.24859. [DOI] [Google Scholar]
- 22.Keshari KR, Kurhanewicz J, Bok R, Larson PEZ, Vigneron DB, Wilson DM. Proc Natl Acad Sci USA. 2011;108:18606– 18611. doi: 10.1073/pnas.1106920108. [DOI] [PMC free article] [PubMed] [Google Scholar]
- 23.Bohndiek SE, Kettunen MI, Hu D, Kennedy BW, Boren J, Gallagher FA, Brindle KM. J Am Chem Soc. 2011;133:11795– 11801. doi: 10.1021/ja2045925. [DOI] [PMC free article] [PubMed] [Google Scholar]
- 24.Fischer A, Hall L. Magn Reson Mater Phys Biol Med. 1994;2:203–210. [Google Scholar]
- 25.Berkovic G, Krongauz V, Weiss V. Chem Rev. 2000;100:1741– 1754. doi: 10.1021/cr9800715. [DOI] [PubMed] [Google Scholar]
- 26.Tu C, Louie AY. Chem Commun. 2007:1331–1333. doi: 10.1039/b616991k. [DOI] [PMC free article] [PubMed] [Google Scholar]
- 27.Tu C, Osborne EA, Louie AY. Tetrahedron. 2009;65:1241. doi: 10.1016/j.tet.2008.12.020. [DOI] [PMC free article] [PubMed] [Google Scholar]
- 28.Tu C, Nagao R, Louie AY. Angew Chem Int Ed. 2009;48:6547–6551. doi: 10.1002/anie.200900984. [DOI] [PMC free article] [PubMed] [Google Scholar]; Angew Chem. 2009;121:6669– 6673. [Google Scholar]
- 29.Caravan P. Acc Chem Res. 2009;42:851– 862. doi: 10.1021/ar800220p. [DOI] [PubMed] [Google Scholar]
- 30.Raghunand N, Jagadish B, Trouard TP, Galons JP, Gillies RJ, Mash EA. Magn Reson Med. 2006;55:1272– 1280. doi: 10.1002/mrm.20904. [DOI] [PMC free article] [PubMed] [Google Scholar]
- 31.Jagadish B, Guntle GP, Zhao D, Gokhale V, Ozumerzifon TJ, Ahad AM, Mash EA, Raghunand N. J Med Chem. 2012;55:10378–10386. doi: 10.1021/jm300736f. [DOI] [PMC free article] [PubMed] [Google Scholar]
- 32.Raghunand N, Guntle GP, Gokhale V, Nichol GS, Mash EA, Jagadish B. J Med Chem. 2010;53:6747– 6757. doi: 10.1021/jm100592u. [DOI] [PMC free article] [PubMed] [Google Scholar]
- 33.Guntle GP, Jagadish B, Mash EA, Powis G, Dorr RT, Raghunand N. Transl Oncol. 2012;5:190– 199. doi: 10.1593/tlo.11322. [DOI] [PMC free article] [PubMed] [Google Scholar]
- 34.Carrera C, Digilio G, Baroni S, Burgio D, Consol S, Fedeli F, Longo D, Mortillaro A, Aime S. Dalton Trans. 2007:4980–4987. doi: 10.1039/b705088g. [DOI] [PubMed] [Google Scholar]
- 35.Skalska J, Bernstein S, Brookes P. Methods Enzymol. 2010;474:149–164. doi: 10.1016/S0076-6879(10)74009-X. [DOI] [PubMed] [Google Scholar]
- 36.Torres AG, Gait MJ. Trends Biotechnol. 2012;30:185– 190. doi: 10.1016/j.tibtech.2011.12.002. [DOI] [PubMed] [Google Scholar]
- 37.Laragione T, Gianazza E, Tonelli R, Bigini P, Mennini T, Casoni F, Massignan T, Bonetto V, Ghezzi P. Biol Chem. 2006;387:1371– 1376. doi: 10.1515/BC.2006.172. [DOI] [PubMed] [Google Scholar]
- 38.Digilio G, Catanzaro V, Fedeli F, Gianolio E, Menchise V, Napolitano R, Gringeri C, Aime S. Chem Commun. 2009:893–895. doi: 10.1039/b820593k. [DOI] [PubMed] [Google Scholar]
- 39.Digilio G, Menchise V, Gianolio E, Catanzaro V, Carrera C, Napolitano R, Fedeli F, Aime S. J Med Chem. 2010;53:4877– 4890. doi: 10.1021/jm901876r. [DOI] [PubMed] [Google Scholar]
- 40.Menchise V, Digilio G, Gianolio E, Cittadino E, Catanzaro V, Carrera C, Aime S. Mol Pharm. 2011;8:1750– 1756. doi: 10.1021/mp2001044. [DOI] [PubMed] [Google Scholar]
- 41.Martinelli J, Fekete M, Tei L, Botta M. Chem Commun. 2011;47:3144– 3146. doi: 10.1039/c0cc05428c. [DOI] [PubMed] [Google Scholar]
- 42.Tóth É, Burai L, Merbach AE. Coord Chem Rev. 2001;216–217:363–382. [Google Scholar]
- 43.Garcia J, Allen MJ. Eur J Inorg Chem. 2012:4550–4563. doi: 10.1002/ejic.201200159. [DOI] [PMC free article] [PubMed] [Google Scholar]
- 44.Burai L, Scopelliti R, Tóth É. Chem Commun. 2002:2366–2367. doi: 10.1039/b206709a. [DOI] [PubMed] [Google Scholar]
- 45.Gamage ND, Mei Y, Garcia J, Allen MJ. Angew Chem Int Ed. 2010;49:8923– 8925. doi: 10.1002/anie.201002789. [DOI] [PMC free article] [PubMed] [Google Scholar]; Angew Chem. 2010;122:9107– 9109. [Google Scholar]
- 46.Garcia J, Neelavalli J, Haacke EM, Allen MJ. Chem Commun. 2011;47:12858– 12860. doi: 10.1039/c1cc15219j. [DOI] [PMC free article] [PubMed] [Google Scholar]
- 47.Garcia J, Allen MJ. Inorg Chim Acta. 2012;393:324– 327. doi: 10.1016/j.ica.2012.07.006. [DOI] [PMC free article] [PubMed] [Google Scholar]
- 48.Garcia J, Kuda-Wedagedara AN, Allen MJ. Eur J Inorg Chem. 2012:2135–2140. doi: 10.1002/ejic.201101166. [DOI] [PMC free article] [PubMed] [Google Scholar]
- 49.Burai L, Tóth É, Seibig S, Scopelliti R, Merbach AE. Chem Eur J. 2000;6:3761– 3770. doi: 10.1002/1521-3765(20001016)6:20<3761::aid-chem3761>3.0.co;2-6. [DOI] [PubMed] [Google Scholar]
- 50.Aime S, Botta M, Gianolio E, Terreno E. Angew Chem Int Ed. 2000;39:747–750. doi: 10.1002/(sici)1521-3773(20000218)39:4<747::aid-anie747>3.0.co;2-2. [DOI] [PubMed] [Google Scholar]; Angew Chem. 2000;112:763– 766. [Google Scholar]
- 51.Loving GS, Mukherjee S, Caravan P. J Am Chem Soc. 2013;135:4620– 4623. doi: 10.1021/ja312610j. [DOI] [PMC free article] [PubMed] [Google Scholar]
- 52.Brucher E, Tircso G, Baranyai Z, Kovács Z, Sherry AD. In: The Chemistry of Contrast Agents in Medical Magnetic Resonance Imaging. Merbach LHA, Toth E, editors. Wiley; Chichester: 2013. pp. 157–208. [Google Scholar]
- 53.Woods M, Woessner DE, Sherry AD. Chem Soc Rev. 2006;35:500–511. doi: 10.1039/b509907m. [DOI] [PMC free article] [PubMed] [Google Scholar]
- 54.Woessner DE, Zhang S, Merritt ME, Sherry AD. Magn Reson Med. 2005;53:790– 799. doi: 10.1002/mrm.20408. [DOI] [PubMed] [Google Scholar]
- 55.Zhang S, Merritt M, Woessner DE, Lenkinski RE, Sherry AD. Acc Chem Res. 2003;36:783– 790. doi: 10.1021/ar020228m. [DOI] [PubMed] [Google Scholar]
- 56.Sherry AD, Wu Y. Curr Opin Chem Biol. 2013;17:167– 174. doi: 10.1016/j.cbpa.2012.12.012. [DOI] [PMC free article] [PubMed] [Google Scholar]
- 57.Ratnakar SJ, Woods M, Lubag AJ, Kovács Z, Sherry AD. J Am Chem Soc. 2008;130:6– 7. doi: 10.1021/ja076325y. [DOI] [PMC free article] [PubMed] [Google Scholar]
- 58.Ratnakar SJ, Viswanathan S, Kovács Z, Jindal AK, Green KN, Sherry AD. J Am Chem Soc. 2012;134:5798– 5800. doi: 10.1021/ja211601k. [DOI] [PMC free article] [PubMed] [Google Scholar]
- 59.Mikata Y, Mizukami K, Hayashi K, Matsumoto S, Yano S, Yamazaki N, Ohno A. J Org Chem. 2001;66:1590– 1599. doi: 10.1021/jo000829w. [DOI] [PubMed] [Google Scholar]
- 60.Ratnakar SJ, Soesbe TC, Lumata LL, Do QN, Viswanathan S, Lin CY, Sherry AD, Kovács Z. J Am Chem Soc. 2013;135:14904– 14907. doi: 10.1021/ja406738y. [DOI] [PMC free article] [PubMed] [Google Scholar]
- 61.Khramtsov VV. In: Nitroxides—Theory, Experiment and Applications. Kokorin AI, editor. HR | HRV; InTech, Rijeka: 2012. pp. 317–346. [Google Scholar]
- 62.Matsumoto A, Matsumoto K-i, Matsumoto S, Hyodo F, Sowers AL, Koscielniak JW, Devasahayam N, Subramanian S, Mitchell JB, Krishna MC. Biol Pharm Bull. 2011;34:142– 145. doi: 10.1248/bpb.34.142. [DOI] [PMC free article] [PubMed] [Google Scholar]
- 63.Matsumoto K, Okajo A, Kobayashi T, Mitchell JB, Krishna MC, Endo K. J Biochem Biophys Methods. 2005;63:79– 90. doi: 10.1016/j.jbbm.2005.03.004. [DOI] [PubMed] [Google Scholar]
- 64.Minetti M, Scorza G. Biochim Biophys Acta. 1991;1074:112– 117. doi: 10.1016/0304-4165(91)90048-l. [DOI] [PubMed] [Google Scholar]
- 65.Ilangovan G, Li H, Zweier JL, Krishna MC, Mitchell JB, Kuppusamy P. Magn Reson Med. 2002;48:723– 730. doi: 10.1002/mrm.10254. [DOI] [PubMed] [Google Scholar]
- 66.Kuppusamy P, Afeworki M, Shankar RA, Coffin D, Krishna MC, Hahn SM, Mitchell JB, Zweier JL. Cancer Res. 1998;58:1562– 1568. [PubMed] [Google Scholar]
- 67.Kuppusamy P, Li H, Ilangovan G, Cardounel AJ, Zweier JL, Yamada K, Krishna MC, Mitchell JB. Cancer Res. 2002;62:307– 312. [PubMed] [Google Scholar]
- 68.Krishna MC, Kuppusamy P, Afeworki M, Zweier JL, Cook JA, Subramanian S, Mitchell JB. Breast Dis. 1998;10:209– 220. doi: 10.3233/bd-1998-103-420. [DOI] [PubMed] [Google Scholar]
- 69.Terreno E, Boffa C, Menchise V, Fedeli F, Carrera C, Castelli DD, Digilio G, Aime S. Chem Commun. 2011;47:4667– 4669. doi: 10.1039/c1cc10172b. [DOI] [PubMed] [Google Scholar]
- 70.Aime S, Delli Castelli D, Terreno E. Angew Chem Int Ed. 2005;44:5513–5515. doi: 10.1002/anie.200501473. [DOI] [PubMed] [Google Scholar]; Angew Chem. 2005;117:5649– 5651. [Google Scholar]
- 71.Aime S, Castelli DD, Crich SG, Gianolio E, Terreno E. Acc Chem Res. 2009;42:822– 831. doi: 10.1021/ar800192p. [DOI] [PubMed] [Google Scholar]
- 72.Delli Castelli D, Gianolio E, Geninatti Crich S, Terreno E, Aime S. Coord Chem Rev. 2008;252:2424– 2443. [Google Scholar]
- 73.Dorazio SJ, Morrow JR. Eur J Inorg Chem. 2012:2006– 2014. doi: 10.1021/ic301001u. [DOI] [PubMed] [Google Scholar]
- 74.Dorazio SJ, Olatunde AO, Tsitovich PB, Morrow JR. J Biol Inorg Chem. 2014;19:191– 205. doi: 10.1007/s00775-013-1059-4. [DOI] [PMC free article] [PubMed] [Google Scholar]
- 75.Dorazio SJ, Olatunde AO, Spernyak JA, Morrow JR. Chem Commun. 2013;49:10025– 10027. doi: 10.1039/c3cc45000g. [DOI] [PMC free article] [PubMed] [Google Scholar]
- 76.Olatunde AO, Dorazio SJ, Spernyak JA, Morrow JR. J Am Chem Soc. 2012;134:18503– 18505. doi: 10.1021/ja307909x. [DOI] [PubMed] [Google Scholar]
- 77.Tsitovich PB, Morrow JR. Inorg Chim Acta. 2012;393:3– 11. [Google Scholar]
- 78.Dorazio SJ, Tsitovich PB, Siters KE, Spernyak JA, Morrow JR. J Am Chem Soc. 2011;133:14154– 14156. doi: 10.1021/ja204297z. [DOI] [PMC free article] [PubMed] [Google Scholar]
- 79.Tsitovich PB, Spernyak JA, Morrow JR. Angew Chem Int Ed. 2013;52:13997– 14000. doi: 10.1002/anie.201306394. [DOI] [PMC free article] [PubMed] [Google Scholar]; Angew Chem. 2013;125:14247– 14250. [Google Scholar]
- 80.Jain KK. Textbook of Hyperbaric Medicine. Hogrefe; Gçttingen: 2009. [Google Scholar]
- 81.Thomlinson RH, Gray LH. Br J Cancer. 1955;9:539– 549. doi: 10.1038/bjc.1955.55. [DOI] [PMC free article] [PubMed] [Google Scholar]
- 82.Clanton TL. J Appl Physiol. 2007;102:2379– 2388. doi: 10.1152/japplphysiol.01298.2006. [DOI] [PubMed] [Google Scholar]
- 83.Branicky RS, Schafer WR. Curr Biol. 2008;18:R559– R560. doi: 10.1016/j.cub.2008.05.023. [DOI] [PubMed] [Google Scholar]
- 84.Semenza GL. Trends Mol Med. 2001;7:345– 350. doi: 10.1016/s1471-4914(01)02090-1. [DOI] [PubMed] [Google Scholar]
- 85.Semenza GL. Semin Cancer Biol. 2009;19:12– 16. doi: 10.1016/j.semcancer.2008.11.009. [DOI] [PubMed] [Google Scholar]
- 86.Zhou J, Schmid T, Schnitzer S, Brune B. Cancer Lett. 2006;237:10–21. doi: 10.1016/j.canlet.2005.05.028. [DOI] [PubMed] [Google Scholar]
- 87.Mabjeesh NJ, Amir S. Histol Histopathol. 2007;22:559– 572. doi: 10.14670/HH-22.559. [DOI] [PubMed] [Google Scholar]
- 88.Semenza GL. Trends Mol Med. 2002;8:S62– 67. doi: 10.1016/s1471-4914(02)02317-1. [DOI] [PubMed] [Google Scholar]
- 89.Soh N. Anal Bioanal Chem. 2006;386:532– 543. doi: 10.1007/s00216-006-0366-9. [DOI] [PubMed] [Google Scholar]
- 90.Dikalov SI, Harrison DG. Antioxid Redox Signaling. 2014;20:372–382. doi: 10.1089/ars.2012.4886. [DOI] [PMC free article] [PubMed] [Google Scholar]
- 91.Chen X, Tian X, Shin I, Yoon J. Chem Soc Rev. 2011;40:4783– 4804. doi: 10.1039/c1cs15037e. [DOI] [PubMed] [Google Scholar]
- 92.Yu M, Beyers RJ, Gorden JD, Cross JN, Goldsmith CR. Inorg Chem. 2012;51:9153– 9155. doi: 10.1021/ic3012603. [DOI] [PubMed] [Google Scholar]
- 93.Song B, Wu Y, Yu M, Zhao P, Zhou C, Kiefer GE, Sherry AD. Dalton Trans. 2013;42:8066– 8069. doi: 10.1039/c3dt50194a. [DOI] [PMC free article] [PubMed] [Google Scholar]
- 94.Lippert AR, Keshari KR, Kurhanewicz J, Chang CJ. J Am Chem Soc. 2011;133:3776– 3779. doi: 10.1021/ja111589a. [DOI] [PMC free article] [PubMed] [Google Scholar]
- 95.Krohn KA, Link JM, Mason RP. J Nucl Med. 2008;49:129S– 148S. doi: 10.2967/jnumed.107.045914. [DOI] [PubMed] [Google Scholar]
- 96.Sun X, Niu G, Chan N, Shen B, Chen X. Mol Imaging Biol. 2011;13:399– 410. doi: 10.1007/s11307-010-0420-z. [DOI] [PubMed] [Google Scholar]
- 97.Zhao D, Jiang L, Mason RP. Methods Enzymol. 2004;386:378– 418. doi: 10.1016/S0076-6879(04)86018-X. [DOI] [PubMed] [Google Scholar]
- 98.Ballinger JR. Semin Nucl Med. 2001;31:321– 329. doi: 10.1053/snuc.2001.26191. [DOI] [PubMed] [Google Scholar]
- 99.Tatum JL, Kelloff GJ, Gillies RJ. Int J Radiat Biol. 2006;82:699–757. doi: 10.1080/09553000601002324. [DOI] [PubMed] [Google Scholar]
- 100.Machulla H-J. Imaging of Hypoxia. Kluwer; Dordrecht: 1999. [Google Scholar]
- 101.Padhani AR, Krohn KA, Lewis JS, Alber M. Eur Radiol. 2007;17:861– 872. doi: 10.1007/s00330-006-0431-y. [DOI] [PMC free article] [PubMed] [Google Scholar]
- 102.Kurihara H, Honda N, Kono Y, Arai Y. Curr Med Chem. 2012;19:3282– 3289. doi: 10.2174/092986712801215964. [DOI] [PubMed] [Google Scholar]
- 103.Imam SK. Cancer Biother Radiopharm. 2010;25:365– 374. doi: 10.1089/cbr.2009.0740. [DOI] [PubMed] [Google Scholar]
- 104.Bache M, Kappler M, Said HM, Staab A, Vordermark D. Curr Med Chem. 2008;15:322– 338. doi: 10.2174/092986708783497391. [DOI] [PubMed] [Google Scholar]
- 105.Rajendran JG, Krohn KA. Radiol Clin North Am. 2005;43:169– 187. doi: 10.1016/j.rcl.2004.08.004. [DOI] [PubMed] [Google Scholar]
- 106.Price JM, Robinson SP, Koh DM. Q J Nucl Med Mol Imaging. 2013;57:257– 270. [PubMed] [Google Scholar]
- 107.Mees G, Dierckx R, Vangestel C, Van de Wiele C. Eur J Nucl Med Mol Imaging. 2009;36:1674– 1686. doi: 10.1007/s00259-009-1195-9. [DOI] [PMC free article] [PubMed] [Google Scholar]
- 108.Li Z, Chu T. Curr Pharm Des. 2012;18:1084– 1097. doi: 10.2174/138161212799315849. [DOI] [PubMed] [Google Scholar]
- 109.Koch CJ, Evans SM. Adv Exp Med Biol. 2003;510:285– 292. doi: 10.1007/978-1-4615-0205-0_47. [DOI] [PubMed] [Google Scholar]
- 110.Hoigebazar L, Jeong JM. Recent Results Cancer Res. 2013;194:285–299. doi: 10.1007/978-3-642-27994-2_15. [DOI] [PubMed] [Google Scholar]
- 111.Krishna MC, Matsumoto S, Yasui H, Saito K, Devasahayam N, Subramanian S, Mitchell JB. Radiat Res. 2012;177:376– 386. doi: 10.1667/rr2622.1. [DOI] [PubMed] [Google Scholar]
- 112.Nunn A, Linder K, Strauss HW. Eur J Nucl Med. 1995;22:265– 280. doi: 10.1007/BF01081524. [DOI] [PubMed] [Google Scholar]
- 113.Xu K, Wang F, Pan X, Liu R, Ma J, Kong F, Tang B. Chem Commun. 2013;49:2554– 2556. doi: 10.1039/c3cc38980d. [DOI] [PubMed] [Google Scholar]
- 114.Okuda K, Okabe Y, Kadonosono T, Ueno T, Youssif BG, Kizaka-Kondoh S, Nagasawa H. Bioconjugate Chem. 2012;23:324– 329. doi: 10.1021/bc2004704. [DOI] [PubMed] [Google Scholar]
- 115.Riche F, d’Hardemare AD, Sepe S, Riou L, Fagret D, Vidal M. Bioorg Med Chem Lett. 2001;11:71– 74. doi: 10.1016/s0960-894x(00)00593-x. [DOI] [PubMed] [Google Scholar]
- 116.Hoigebazar L, Jeong JM, Hong MK, Kim YJ, Lee JY, Shetty D, Lee YS, Lee DS, Chung JK, Lee MC. Bioorg Med Chem. 2011;19:2176– 2181. doi: 10.1016/j.bmc.2011.02.041. [DOI] [PubMed] [Google Scholar]
- 117.Engelhardt EL, Schneider RF, Seeholzer SH, Stobbe CC, Chapman JD. J Nucl Med. 2002;43:837– 850. [PubMed] [Google Scholar]
- 118.Nunn AD, Linder KE, Tweedle MF. Q J Nucl Med. 1997;41:155–162. [PubMed] [Google Scholar]
- 119.Rojas-Quijano FA, Tircso G, Tircsone Benyo E, Baranyai Z, Tran Hoang H, Kalman FK, Gulaka PK, Kodibagkar VD, Aime S, Kovács Z, Sherry AD. Chem Eur J. 2012;18:9669– 9676. doi: 10.1002/chem.201200266. [DOI] [PMC free article] [PubMed] [Google Scholar]
- 120.Gulaka PK, Rojas-Quijano F, Kovács Z, Mason RP, Sherry AD, Kodibagkar VD. J Biol Inorg Chem. 2014;19:271– 279. doi: 10.1007/s00775-013-1058-5. [DOI] [PMC free article] [PubMed] [Google Scholar]
- 121.Iwaki S, Hanaoka K, Piao W, Komatsu T, Ueno T, Terai T, Nagano T. Bioorg Med Chem Lett. 2012;22:2798– 2802. doi: 10.1016/j.bmcl.2012.02.071. [DOI] [PubMed] [Google Scholar]
- 122.Lowe MP, Parker D, Reany O, Aime S, Botta M, Castellano G, Gianolio E, Pagliarin R. J Am Chem Soc. 2001;123:7601– 7609. doi: 10.1021/ja0103647. [DOI] [PubMed] [Google Scholar]
- 123.Tannock IF, Rotin D. Cancer Res. 1989;49:4373– 4384. [PubMed] [Google Scholar]
- 124.Raghunand N, Howison C, Sherry AD, Zhang S, Gillies RJ. Magn Reson Med. 2003;49:249– 257. doi: 10.1002/mrm.10347. [DOI] [PubMed] [Google Scholar]
- 125.Garcia-Martin ML, Martinez GV, Raghunand N, Sherry AD, Zhang S, Gillies RJ. Magn Reson Med. 2006;55:309– 315. doi: 10.1002/mrm.20773. [DOI] [PubMed] [Google Scholar]
- 126.Martinez GV, Zhang X, Garcia-Martin ML, Morse DL, Woods M, Sherry AD, Gillies RJ. NMR Biomed. 2011;24:1380– 1391. doi: 10.1002/nbm.1701. [DOI] [PMC free article] [PubMed] [Google Scholar]
- 127.Frullano L, Catana C, Benner T, Sherry AD, Caravan P. Angew Chem Int Ed. 2010;49:2382–2384. doi: 10.1002/anie.201000075. [DOI] [PMC free article] [PubMed] [Google Scholar]; Angew Chem. 2010;122:2432– 2434. [Google Scholar]
- 128.Gianolio E, Maciocco L, Imperio D, Giovenzana GB, Simonelli F, Abbas K, Bisi G, Aime S. Chem Commun. 2011;47:1539– 1541. doi: 10.1039/c0cc03554h. [DOI] [PubMed] [Google Scholar]
- 129.Aime S, Fedeli F, Sanino A, Terreno E. J Am Chem Soc. 2006;128:11326– 11327. doi: 10.1021/ja062387x. [DOI] [PubMed] [Google Scholar]
- 130.Wu Y, Soesbe TC, Kiefer GE, Zhao P, Sherry AD. J Am Chem Soc. 2010;132:14002– 14003. doi: 10.1021/ja106018n. [DOI] [PMC free article] [PubMed] [Google Scholar]