

Abstract
Neutrophils are critical inflammatory cells; thus, it is important to characterize the effects of drugs on neutrophil function in the context of inflammatory diseases. Herein, chemically guided neutrophil migration, known as chemotaxis, is studied in the context of drug treatment at the single cell level using a microfluidic platform, complemented by cell viability assays and calcium imaging. Three representative drugs known to inhibit surface receptor expression, signaling enzyme activity, and the elevation of intracellular Ca2+ levels, each playing a significant role in neutrophil chemotactic pathways, are used to examine the in vitro drug effects on cellular behaviors. The microfluidic device establishes a stable concentration gradient of chemokines across a cell culture chamber so that neutrophil migration can be monitored under various drug-exposure conditions. Different time- and concentration-dependent regulatory effects were observed by comparing the motility, polarization, and effectiveness of neutrophil chemotaxis in response to the three drugs. Viability assays revealed distinct drug capabilities in reducing neutrophil viability while calcium imaging clarified the role of Ca2+ in the neutrophil chemotactic pathway. This study provides mechanistic insight into the drug effects on neutrophil function, facilitating comparison of current and potential pharmaceutical approaches.
INTRODUCTION
Neutrophils are the dominant white blood cells in the human body, and they play a significant role in the first line immunological response.1 Neutrophil dysfunction is often found to be involved in neutrophilic inflammation, including acute severe subtypes of asthma2,3 and chronic obstructive pulmonary disease (COPD),4,5 ranking as the fourth leading cause of death worldwide.6 Despite the fact that neutrophilic inflammation endangers human health, only a few pharmacological treatments are available and effective to treat neutrophilic inflammation. The pathophysiology of neutrophilic inflammation is characterized by neutrophil accumulation around infection sites due to aberrant neutrophil chemotaxis and impaired apoptotic pathways;5,7 as such, there is a clear need to understand the underlying neutrophil biology in hopes of developing alternative approaches to slow neutrophil chemotaxis and remove persistent neutrophils.8 Chemotaxis is a dynamic process whereby cells move in response to chemical gradients of signaling molecules called chemokines. Interleukin-8 (IL-8), one of the most well-documented primary chemokines that regulates neutrophil movement, is responsible for promoting neutrophil chemotaxis and activating the pathogenesis of neutrophil inflammatory diseases.9,10 The neutrophil intracellular pathway triggered by IL-8 offers several pharmaceutical targets, such as the receptor chemokine C-X-C motif receptor-2 (CXCR2), the signal transducer enzyme phosphoinositide 3-kinase (PI3K), and intracellular free Ca2+, all of which perform important functions in the neutrophil chemotactic cascade (Fig. 1). IL-8 initiates neutrophil chemotaxis through binding to seven-transmembrane domain receptors (CXCR1 and CXCR2) located on the surface of neutrophils. Although activation of both CXCR1 and CXCR2 is able to initiate a series of neutrophil signaling processes, the rate of receptor internalization is more rapid with CXCR2 than CXCR1, and a lower dose of IL-8 is required for CXCR2 activation.11,12 Following the translocation of CXCR receptors to the cytoplasmic granules mediated by G proteins, which are a family of proteins transmitting signals from extracellular stimuli to the interior of the cell - Gβγ subunits activate PI3K and phospholipase C (PLC) pathways to govern downstream signal transduction elements. PI3K and its main lipid products are involved in a variety of cellular processes, such as cell survival, cytoskeleton rearrangement, and cell transformation; more importantly, PI3K is responsible for the cell polarization that controls the direction of neutrophil migration.13 PLC-molecules can be divided into three categories (β, γ and δ), and the activation of the PLC-β isoform not only mediates the function of protein kinases, but also leads to an increased level of intracellular free Ca2+.14 The relationship between Ca2+ and chemotaxis is still in dispute, although it has been suggested that Ca2+ is involved in the contraction of the cell rear and uropod, which is an underlying step in the movements of cells.15 Clarification of the role of Ca2+ in neutrophil chemotaxis is necessary to understand and manipulate the signaling pathway.
Figure 1.
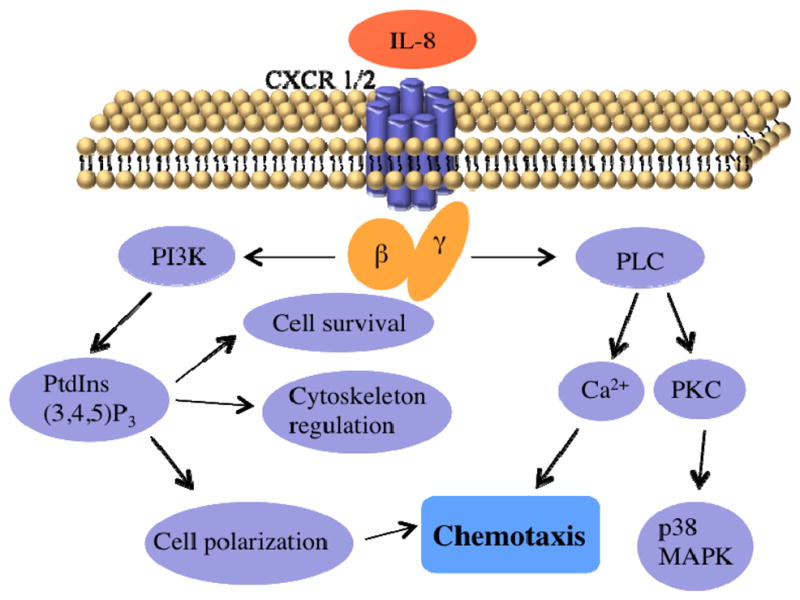
Simplified schematic diagram of the IL-8 signaling pathway in neutrophil chemotaxis.
In this work, we exploit single cell bioanalytical approaches to evaluate the physiological effects of three drugs aimed at the aforementioned targets. Inhibition of CXCR2 function with an antagonist downregulates the neutrophil migratory response in the biological cascade, potentially decreasing the number of cells infiltrating sites of interest. A number of CXCR2 antagonists have been identified by pharmaceutical companies, and some of them are already in preclinical trials.16 SB225002, a common CXCR2 antagonists, was employed herein to determine the impacts of receptor antagonism on neutrophil chemotaxis and viability. The PI3K inhibitor, LY294002, has been studied extensively during the past two decades;17,18 however, the precise role of this inhibitor in neutrophil chemotaxis, including temporal regulation and concentration selection, is still not clear. Also, LY294002 is expected to suppress neutrophil viability since PI3K has been identified as a survival factor for neutrophils.19 The connection between neutrophil chemotaxis and cytosolic Ca2+ levels can be determined by introducing the drug considered to influence both chemotactic behaviors and the mobilization of intracellular Ca2+. Theophylline is a common respiratory drug that alleviates the symptoms of COPD patients. Previous research has revealed that theophylline induces the inhibition of neutrophil chemotaxis in both healthy control and patient samples,20,21 likely by decreasing cytosolic Ca2+ concentration.22 A deep investigation about the impacts of theophylline on neutrophil chemotaxis and intracellular Ca2+ is required to test this hypothesized role of Ca2+ in neutrophil chemotaxis and accurately describe drug action mechanisms.
Conventional chamber-based assays, such as use of the Boyden chamber,23 Dunn Chamber24 and agarose gel assays,25 introduce chemokine concentration gradients between two separate chambers containing buffer and concentrated signaling molecules. Although these assays are straightforward and convenient, the variable chemical gradients decay with time and only ensemble measurements are obtained, limiting the systems and effects that can be probed with these methods. Microfluidics is a technology that enables the precise manipulation of fluid flows at the microscale.26 Simple microfluidic platforms can be used to create dynamic and stable chemical gradients with high spatiotemporal resolution due to the accurate and precise control over laminar flow in microchannels. Additionally, optically transparent microfluidic platforms allow tracking of individual cells during chemotaxis in a real-time and quantitative fashion. Furthermore, compared to the simplistic environment in traditional methods, microfluidic techniques sustain a more complicated in vivo-like milieu with dynamic fluid flow and complex biological media so that cellular behaviors can be monitored in a physiologically relevant environment.
Methods
Device Fabrication
Microfluidic devices were fabricated using standard photolithography protocols. First, a film (CAD/Art Service Inc., Bandon, OR) with lightproof background and transparent channel patterns was used to transfer the device design onto a chrome photomask plate via UV light exposure to an AZ1518 positive photoresist coating (Nanofilm, Westlake Village, CA). After exposure, the photomask was placed in 351 developer solution (Rohm and Hass Electronic Materials LLC, Marlborough, MA) to remove cross-linked photoresist in the channels, and the exposed chrome layer was etched down in the chrome etchant solution (Cyantek Corporation, Fremont, CA). The final step was carried out in the piranha solution (1:1 volume ratio of 30% hydrogen peroxide and 99.9% sulfuric acid, Avantor Performance Materials, Phillipsburg, NJ) to remove the remaining photoresist. Following photomask fabrication, a 4-inch silicon wafer was spin-coated with 100 μm thick negative photoresist SU-8 50 (Microchem, Newton, MA) and then underwent the first baking step. The channel patterns were then copied to the SU-8 mold through the previously prepared photomask by UV exposure. After the second baking process, the silicon wafer was developed in SU-8 developer (Microchem, Newton, MA) to dissolve the unexposed photoresist, and the device patterns remained on the substrate. A mixture of Sylgard 184 silicone elastomer base and curing agent (Ellsworth Adhesives, Germantown, WI) in 10:1 mass ratio was slowly poured on the completed SU-8 mold after degassing, and then incubated on the hot plate at 95°C overnight. The polydimethylsiloxane (PDMS) layer was cut and punched for inlet and outlet holes. Finally, the PDMS layer was attached to the glass substrate permanently using oxygen plasma at 100 L/h oxygen flow rate and 100 W for 10 seconds. The fabricated devices were sterilized by injecting 70% v/v ethanol solution into channels and exposed to UV light overnight before use.
Neutrophil Isolation
Freshly drawn whole human blood samples with ethylenediaminetetraacetic acid (EDTA) as an anticoagulant were prepared by Memorial Blood Center (St. Paul, MN) according to IRB protocol E&I ID no. 07809. All the samples were collected from healthy donors as demonstrated by a screening questionnaire that meets the Food and Drug Administration (FDA) guidelines, and neutrophil isolation was performed immediately following blood draws. 5 mL of blood sample was layered carefully over the same volume of mono-poly resolving medium (Fisher Scientific, Waltham, MA) and centrifuged to obtain distinct density gradients. The neutrophil band was collected and purified using red blood cell lysis buffer (Miltenyi Biotec Inc., Auburn, CA) according to the previously reported protocol.27 The final neutrophil pellet was re-suspended in Hank’s buffered salt solution (HBSS, Fisher Scientific, Waltham, MA) containing 2% human serum albumin (HSA, Sigma-Aldrich, St. Louis, MO).
Cell Viability Assay
Pure neutrophils were diluted to the density of 6 × 10⁵ cells/mL in HBSS medium and seeded in 96-well plate with 100 μL in each well. Neutrophils were incubated with different concentrations of drugs (CXCR2 antagonist SB225002, EMD Millipore, Billerica, MA; PI3K inhibitor LY294002 or theophylline, Sigma-Aldrich, St. Louis, MO) for specific time periods (30 min, 90 min, or 150 min) in the incubator at 37°C under 5% CO2. After incubation, the well plate was centrifuged to remove medium, and the cells were incubated with 100 μL of 0.5 mg/mL 3-(4,5-dimethylthiazol-2-yl)-2,5-diphenyltetrazolium bromide (MTT, Sigma-Aldrich, St. Louis, MO) solution for 2 h. The water-insoluble purple formazan crystals only produced by the living cells were dissolved in 150 μL of dimethyl sulfoxide (DMSO, Sigma-Aldrich, St. Louis, MO). The plate was placed on the orbital shaker for 20 min to facilitate complete crystal dissolution. Finally, 100 μL of DMSO solution was transferred to another new 96-well plate for UV-Vis absorption measurements. Optical density was monitored at 570 nm, with 655 nm as a reference, using a microplate reader (Bio Tek, Winnoski, VT), and the cell viability was calculated using equation (1). The data in each condition were recorded from five different blood samples (donors).
| (1) |
Fluorescence Imaging and Microfluidic Chemotaxis Experiments
The fluorescence imaging was undertaken by injecting 100 μM Rhodamine 6G (Sigma-Aldrich, St. Louis, MO) solution through the right medium inlet and HBSS buffer through the left medium inlet. The flow rates were kept at 100 μL/h to obtain stable fluorescence gradients in the cell culture chamber.
Prior to doing chemotaxis experiments, the channels were rinsed with sterilized Milli-Q water (Millipore, Billerica, MA), and 20 μL of 250 μg/mL human fibronectin (Sigma-Aldrich, St. Louis, MO) solution was injected through the cell inlet to cover the cell culture chamber. The devices were kept in the biosafety hood for 40 min before introducing neutrophils. Neutrophils at a density of 3–5 × 10⁶ cells/mL were incubated with specific concentrations of drugs at 37°C under 5% CO2 for 30 min, 90 min, or 150 min. After that, 5–10 μL of neutrophils were injected through the cell inlet to achieve suitable population (30–60 cells in the viewable 400 μm × 1280 μm area) in the microfluidic cell culture chamber, and then the device was kept in the biohood for another one hour to enhance neutrophil adhesion to the fibronectin-coated glass. Two medium inlets were connected to syringes containing 10 ng/mL IL-8 (Sigma-Aldrich, St. Louis, MO) solution and HBSS buffer to achieve a 0–10 ng/mL IL-8 gradient within the observation channel. The flow rate was kept at 100 μL/h, which will generate minimum shear-induced impact on neutrophil chemotaxis. The migratory patterns of neutrophils within the IL-8 gradient were recorded using time-lapse imaging mode (every 10 s for 20 min) in Metamorph imaging software on an inverted microscope with a 10× objective (Nikon, Melville, NY) and a CCD camera (QuantEM, Photometrics, Tucson, AZ). Three biological replicates were performed for each condition.
Analysis of Chemotaxis Data
In the cell culture chamber, the trajectories of 15 or more randomly-chosen neutrophils were analyzed (Fig. 2(a)). Neutrophil chemotaxis was quantified using three parameters, motility index (MI), chemotactic index (CI), and effective chemotactic index (ECI), which have been employed to describe neutrophil chemotaxis previously.28 The MI value describes the total possible movement of neutrophils and is defined as the ratio of final straight migratory distance (dfinal) and the maximum displacement (dmax).
Figure 2.

(a) Trajectories of neutrophils in the control sample. The highlighted migratory routine of single neutrophil shows how data was processed for analysis. (b) Schematic of microfluidic gradient device used in the experiment and confirmation of chemical gradient with fluorescence imaging. (Scale bar: 100 μm)
where dmax is the product of average velocity of the tracked cell and total observed time. CI represents the orientation of neutrophils during migration and is defined as the ratio of the final distance in the gradient direction (dx) and the entire migration distance of a cell (dtotal).
The third parameter, ECI, is defined as the product of MI and CI, and depicts the overall effectiveness of neutrophil chemotaxis. These three parameters from individual neutrophils were calculated and plotted as histograms reflecting average values and standard error of the mean (SEM). Unpaired t-tests with α =0.05 were used for statistical comparison.
Calcium Imaging
Neutrophils were prepared in HBSS buffer containing 2% HSA at the density of 4–5 ×10⁶ cells/mL. For loading cells with the intracellular Ca2+-sensitive fluorophore fura-2 AM (Sigma-Aldrich, St. Louis, MO), 1 mL of neutrophil suspension was incubated with 1 μL of 1 mM fura-2 AM at 37°C under 5% CO2 for 30 min. Neutrophils were centrifuged twice to remove extra fura-2 AM, and then divided into two tubes of 500 μL solution. One population was re-suspended using Ca2+-free HBSS medium (Sigma-Aldrich, St. Louis, MO) supplemented with 2% HSA and 2 mM ethylene glycol tetraacetic acid (EGTA, Sigma-Aldrich, St. Louis, MO), and the other one was kept in normal (Ca2+-containing) HBSS medium supplemented with 2% HSA. These two tubes were further split into 100 μL aliquots for incubation with different doses of theophylline. All the samples were put on ice in the dark until use. Before Ca2+ imaging, each sample was incubated at 37°C for 5 min and re-suspended in 100 μL of the same fresh media. A 100 μL neutrophil suspension in each tube was placed on the center of a petri dish without fixing agent and the fluorescence intensity was monitored at 495 nm using 340/380 nm dual wavelength excitation through a 40× oil immersion objective on an inverted microscope (Nikon, Melville, NY). The change in fluorescence intensity induced by addition of 2 μL 500 mg/mL IL-8 solution was recorded.
Calibration of Ca2+ concentrations was performed by pipetting 2 μL of 25 mM digitonin (Sigma-Aldrich, St. Louis, MO), a cell-permeabilizing agent, into the cell suspension for the maximum fluorescence ratio (Rmax) and then 5 μL of 0.4 M EGTA for the minimum fluorescence ratio (Rmin). Intracellular Ca2+ levels activated by IL-8 were calculated according to the equation (2).29
| (2) |
where Kd is the effective dissociation constant for the probe molecule (220 nM), Sf2 is the minimum excitation intensity at 380 nm, and Sb2 is the maximum excitation intensity at 380 nm. Neutrophil autofluorescence without added fura-2 AM was also measured following the same procedures and subtracted in the calculation.
Results and Discussion
Confirmation of Chemical Gradients in Microfluidic Device
The microfluidic device is composed of three inlets, many serpentine channels, and one cell culture chamber (Fig. 2(b)). At each node in the microfluidic serpentine channels, the fluid splits into two streams and mixes via diffusion, with the neighboring stream carrying a different concentration of chemokines. When the fluid arrives in the cell culture chamber at the end of the pyramidal network, all the streams combine and form a concentration gradient perpendicular to the direction of streams. The mixing behaviors of different streams flowing in the serpentine channels have been verified using COMSOL multiphysics 4.1 in our previous work,30 and a complete mixing process was achieved under the current experimental conditions. The concentration gradient profile is constant during experiments since the rate of molecular diffusion in each stream is much slower than the flow rate used in the experiment, which prevents the nondirectional diffusion of chemokine molecules across the cell culture chamber. The fluorescence imaging shown in Fig. 2(b) further confirms the formation of chemical gradients in the cell culture chamber with gradually increasing fluorescence intensity from left to right. This result can be extended to the condition of the IL-8 gradient since the IL-8 molecule has a higher molecular weight and slower diffusion rate than the model fluorescent molecule (rhodamine 6G), which causes less nondirectional movements in the chamber.
Neutrophil Viability after Drug Treatment
The effects of drugs, at varying doses and time periods, on neutrophil viability were evaluated using a traditional colorimetric MTT assay. The presence of 10 μM CXCR2 antagonist SB225002 for 100 μL of 6 × 10⁵ cells/mL neutrophils induced about 40% decrease in neutrophil viability versus the control condition after 150 min incubation, while 30 and 90 min incubation times caused smaller decreases in viability (Fig. 3(a)). These compromised viabilities are likely attributable completely to drug cytotoxicity as none of the incubation times are long enough to induce spontaneous neutrophil apoptosis.31 In addition, the same trends of viability reduction were observed while exposed to 1 μM and 100 nM SB225002. These results imply that SB225002 blocks the surface receptor sites accompanied with the internalization of antagonist, resulting in decreased neutrophil viability. The introduction of the PI3K inhibitor LY294002 only reveals moderate cytotoxic effects on neutrophils. Approximately a 20% reduction in neutrophil viability was observed after 90 and 150 min treatment at all the concentrations, and 30 min incubation had almost no effect on neutrophil viability (Fig. 3(b)). Previous studies suggested that PI3K played an important part in the anti-apoptotic system activated by granulocyte/macrophage colony-stimulating factor (GM-CSF),32,33 and LY294002 was revealed to suppress the survival effects of this cytokine. Since there was no GM-CSF in the neutrophil medium to activate the PI3K pathway, the cytotoxic effects of LY294002 on neutrophils were limited as precedent work suggests. The evaluation of neutrophil viability after theophylline incubation was also in agreement with the previous reports that indicated a significant drop in neutrophil viability.34 Unlike the dose-dependent effects displayed in previous reports, neither the therapeutic plasma concentration (10 μM) nor excessive amounts of theophylline (100 μM and 1 mM) showed any reduction in neutrophil viability with 30 min incubation. For 90 min incubation, theophylline induced a 40% reduction in viability at all the three concentrations, and all the drug concentrations induced a 50% decrease in neutrophil viability with 150 min incubation (Fig. 3(c)). Theophylline is known to down-regulate the expression of bcl-2, a protein in eosinophils and B cells that protects cells against apoptotic stimuli;35 however, this explanation cannot be employed herein due to the absence of bcl-2 expression in neutrophils. Another study demonstrated that theophylline augments granulocyte apoptosis by inhibiting the adenosine A2A receptor after 16 h culture,36 but this long time incubation made it impossible to discriminate between the contribution of spontaneous neutrophil apoptosis and drug-induced cell death. A detailed investigation of the immunomodulatory effects of theophylline on neutrophil apoptosis is clearly needed. Based on the results herein, the CXCR2 antagonist SB225002 and theophylline both greatly shorten neutrophil life span quickly while the PI3K inhibitor LY294002 was less effective at inducing neutrophil apoptosis. SB225002 and theophylline are more potent drugs than LY294002 in accelerating neutrophil apoptosis, but the risk of SB225002 acting on other CXCR2-expressing cells and the common cytotoxicity of theophylline on immune cells should be considered for the future use.
Figure 3.
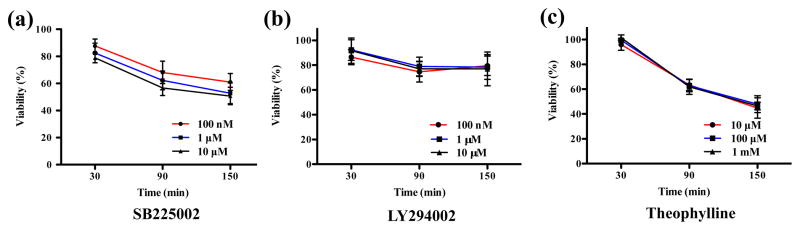
Cytotoxic effects of each drug on neutrophil viability, as determined by the MTT assay. (a) Percent of neutrophil viability compared to the control condition after incubation with 100 nM, 1 μM, and 10 μM of SB225002 at different time points. (b) Percent of neutrophil viability compared to the control condition after incubation with 100 nM, 1 μM, and 10 μM of LY294002 at different time points. (c) Percent of neutrophil viability compared to the control condition after incubation with 10 μM, 100 μM, and 1mM of theophylline at different time points.
Neutrophil Chemotaxis with Drug Incubation
Instead of traditional chamber-based assays, neutrophil chemotaxis under a 0–10 ng/mL IL-8 gradient was monitored in the gradient microfluidic device before and after drug treatment. Neutrophil migration patterns were quantified using the aforementioned three numerical parameters: MI, CI and ECI. Compared to the viability results reported above, neutrophil chemotaxis was not as sensitive to the low concentrations of CXCR2 antagonist, and no suppressive effect was observed under 100 nM and 1 μM drug conditions (Fig. S1(a) and (b)). The addition of 10 μM SB225002 resulted in a significant decrease in CI value after 90 and 150 min incubation while also causing an 80% decline in the ECI value after 150 min incubation (Fig. 4(a)). These results suggest that CXCR2 antagonism has remarkable impacts on the direction and effectiveness of neutrophil chemotaxis in a concentration- and time-dependent fashion without altering neutrophil motility. The IC50 of SB225002 for inhibiting neutrophil chemotaxis through CXCR2 antagonism is between 1 μM and 10 μM, which is much higher than the reported value (IC50 = 22 nM).37 This reported value was obtained using conventional chamber-based assays where all cells are assumed to be alive and responding to the chemokine signal; however, dead cells induced by CXCR2 antagonist cannot migrate into the chemokine chamber and are retained in the medium chamber. In this fashion, chamber-based assays overestimate the inhibitory effects of SB225002 on neutrophil chemotaxis by ignoring the cytotoxicity of the drug. On the contrary, defunct neutrophils cultured in the microfluidic device are removed by the fluid flow or barely move on the bottom; these cells were eliminated from the data analysis, and only effective neutrophil chemotaxis was collected and analyzed.
Figure 4.
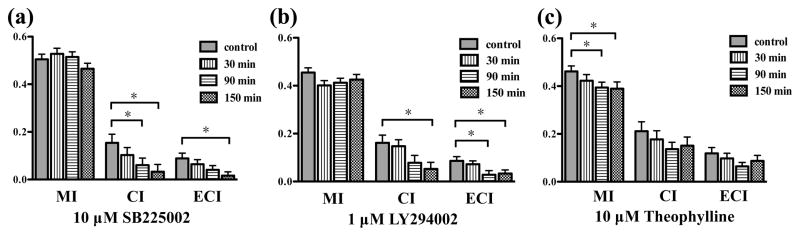
The inhibitory effects of each drug on neutrophil chemotaxis (*, pitalic>0.05, using a two-tailed unpaired t-test). (a) MI, CI, and ECI values after 10 μM SB225002 treatment for control, 30 min, 90 min, and 150 min. (b) MI, CI, and ECI values after 1 μM LY294002 treatment for control, 30 min, 90 min, and 150 min. (c) MI, CI, and ECI values after 10 μM theophylline treatment for control, 30 min, 90 min, and 150 min.
Neutrophils exposed to varying concentrations of LY294002 showed distinct chemotactic behaviors. Similar to SB225002, 100 nM LY294002 had no major effect on neutrophil chemotaxis (Fig. S1(c)), and 10 μM induced a significant decrease in the CI value after 150 min incubation (Fig. S1(d)), which confirms the conclusion that PI3K regulates the cellular polarization in the IL-8 signaling pathway and LY294002 interrupts the PI3K-involved neutrophil migration. Meanwhile, 1 μM of LY294002 resulted in about a 70% reduction in CI signal after 150 min incubation as well as a statistically significant drop in ECI values after 90 and 150 min treatment (Fig. 4(b)). These results suggest that PI3K modulates neutrophil chemotaxis via a positive feedback loop wherein two cytokines function both upstream and downstream of one another. Although there is no literature precedent for the involvement of PI3K in a positive feedback loop, the phospholipid product PtdInsP3 and downstream Rho GTPases have been reported to activate each other in a positive feedback relationship.38 Herein, we speculate that neutrophils exposed to 10 μM LY294002 are short of activated PI3K and PtdInsP3, which activates the positive feedback loop between PtdInsP3 and Rho GTPases to stimulate the production of PtdInsP3, thus preventing the inhibitory effects of LY294002. Unlike SB225002, the IC50 of LY294002 for inhibiting neutrophil chemotaxis in this study was around 1 μM, close to the known value (IC50 = 1.4 μM),39 since LY294002 induces smaller cytotoxic impacts on neutrophils than SB225002, and the contribution of cytotoxic effects to IC50 is limited for LY294002. This also supports our belief that the cytotoxic effects of drugs must be considered in the measured IC50 values.
Theophylline, a current medication for COPD, indicates a completely opposite trend in neutrophil chemotaxis inhibition compared to the other drugs. At therapeutic concentration, 10 μM theophylline caused a significant decrease in MI value after 90 and 150 min incubation, with no significant change in CI and ECI values (Fig. 4(c)). Two larger concentrations, 100 μM and 1 mM, did not indicate any significant difference in the three numerical parameters (Fig. S1(e) and (f)), which suggests that theophylline only lowers the motility of neutrophils around the optimal concentration without any influence on the polarization and effectiveness of neutrophil chemotaxis. These results contradict the observation found in the previous studies that theophylline is a potent inhibitor for neutrophil chemotaxis.20–22 As mentioned above, drug cytotoxicity can lead to overestimated chemotaxis in the traditional chamber-based assays by impeding neutrophil migration by increasing cell apoptosis rather than damaging chemotactic pathway. Theophylline induces a great drop in neutrophil viability instead of inhibiting neutrophil chemotaxis.
In sum, our results demonstrate that SB225002 and LY294002 decrease polarization and effectiveness of neutrophil chemotaxis at different optimal concentrations, but theophylline only decreases motility of neutrophils at therapeutic concentration.
Intracellular Calcium Imaging
To determine the role of Ca2+ in neutrophil chemotaxis, the effects of theophylline on the mobilization of intracellular Ca2+ during theophylline treatment were assessed using single cell ratiometric fluorescence imaging. In the medium containing Ca2+, the concentrations of intracellular Ca2+ after 10 ng/mL IL-8 activation were determined at varying doses and theophylline incubation times. Compared to the control sample, the presence of 1 mM theophylline induced a significant decrease in intracellular Ca2+ after 30 and 150 min incubation (Fig. 5(a)), which indicates that theophylline suppresses the elevation of Ca2+ level in the IL-8 signaling pathway. The fluorescence images clearly show that the number of bright cells increases greatly after IL-8 stimulation without theophylline treatment (Fig. 5(c)); however, the elevation of intracellular Ca2+ was almost totally inhibited with 1 mM theophylline treatment after 150 min (Fig. 5(d)). In addition to the high dose, 10 μM theophylline also significantly inhibited Ca2+ increase after 90 min incubation. Although there is no statistically significant inhibition for 100 μM of theophylline, the average value of intracellular Ca2+ level at each time point was lower than that of the control sample. Further examination with 500 μM and 50 μM theophylline also indicated significant decrease in intracellular Ca2+ level after long time exposure (Fig. S2), which reveals that the introduction of theophylline in a large concentration range inhibits the elevation of intracellular Ca2+ activated by the chemokine IL-8. Combined with theophylline’s apparent minimal effect on neutrophil chemotaxis, it appears that neutrophil chemotaxis is independent of the alteration in intracellular Ca2+. In the Ca2+-free medium, no significant change in intracellular Ca2+ levels was observed for any of the theophylline doses, accounting for the control cell behavior (where the influence of Ca2+ in the media was significant). These results suggest that the function of theophylline in IL-8 signaling pathway is to block the entry of Ca2+ into cells. First, the intracellular Ca2+ levels of the control conditions in Ca2+-free medium are much lower than those in Ca2+-containing medium, which indicates that IL-8 activation triggers the influx of extracellular Ca2+ and the absence of extracellular Ca2+ resulted in. the small Ca2+ concentrations for the control conditions. Second, the conclusion that theophylline inhibits influx of extracellular Ca2+ is also confirmed by the real-time calcium imaging curve (Fig. S3). After incubation with 1 mM theophylline for 150 min, the addition of digitonin, a cell-permeabilizing agent that allows entry of extracellular Ca2+, induced a tiny increase in Ca2+ level; however, the addition of digitonin resulted in the maximum fluorescence for the control condition.
Figure 5.

The effects of theophylline on mobilization of intracellular Ca2+ activated by 10 ng/mL IL-8 (*, pbold>0.05, using a two-tailed unpaired t-test). (a) Incubation with 10 μM, 100 μM, or 1 mM theophylline in the medium containing Ca2+. (b) Incubation with 10 μM, 100 μM, and 1 mM theophylline in Ca2+-free medium. (c) Fluorescence imaging of control sample before and after the addition of IL-8. (d) Fluorescence imaging of 150 min incubation sample with 1 mM theophylline before and after the addition of IL-8. (Scale bar in all the images: 50 μm)
Conclusions
Three representative drugs were employed in this work to determine the drug effects on neutrophil function. Through the drug cytotoxicity assays, we found that the CXCR2 antagonist SB225002 and theophylline induced significant decreases in neutrophil viability at all tested concentrations while the PI3K inhibitor LY294002 produced mild decrease in neutrophil viability. This indicates that SB225002 and theophylline are more potent drugs to accelerate neutrophil apoptosis. A microfluidic device with a highly stable chemokine gradient was employed to quantify neutrophil chemotaxis with and without drug treatment. More importantly, the microfluidic platform was used to monitor neutrophil chemotaxis independent of drug cytotoxicity, and demonstrated that the conventional chamber-based assays likely overestimate the inhibitory effects of drugs due to the unaccounted for drug cytotoxicity. SB225002 was shown to mediate neutrophil chemotaxis in a time- and concentration-dependent manner while LY294002 triggered a positive feedback loop of PtdInsP3 and Rho GTPases in the IL-8 signaling pathway at high doses. Theophylline indicated slight capability to slow neutrophil chemotaxis, and further investigation revealed that the alteration of intracellular Ca2+ had no effect on neutrophil chemotaxis but was inhibited by theophylline treatment. The exploration of drug effects on neutrophil function can be used to determine the biological implications of various relevant drugs and provide the significant insights on drug development for neutrophilic inflammation.
Supplementary Material
Table 1.
Results Summary for the Most Effective Concentrations of Each Drug on Neutrophil Chemotaxis Inhibition.
| 10 μM SB225002 | 1 μM LY294002 | 10 μM Theophylline | |||||||
|---|---|---|---|---|---|---|---|---|---|
|
| |||||||||
| 30 min | 90 min | 150 min | 30 min | 90 min | 150 min | 30 min | 90 min | 150 min | |
| Ncells | 65 | 63 | 58 | 71 | 74 | 69 | 57 | 67 | 64 |
| MI (%) | 104.6 | 101.9 | 92.23 | 93.15 | 90.54 | 93.35 | 91.55 | 85.40 | 84.34 |
| CI (%) | 66.90 | 39.60 | 21.30 | 91.05 | 48.18 | 32.64 | 83.89 | 64.71 | 71.62 |
| ECI (%) | 72.58 | 45.53 | 18.25 | 83.80 | 32.47 | 38.24 | 82.18 | 54.50 | 73.63 |
Data in bold are significant different (p<0.05, two-tailed unpaired t-test) with control.
Acknowledgments
This work was supported by a National Institutes of Health New Innovator Award (DP2 OD004258-01). Device fabrication was done in the Minnesota Nano Center at University of Minnesota.
References
- 1.Mantovani A, Cassatella MA, Costantini C, Jaillon S. Nat Rev Immunol. 2011;11:519–531. doi: 10.1038/nri3024. [DOI] [PubMed] [Google Scholar]
- 2.Douwes J, Gibson P, Pekkanen J, Pearce N. Thorax. 2002;57:643–648. doi: 10.1136/thorax.57.7.643. [DOI] [PMC free article] [PubMed] [Google Scholar]
- 3.Monteseirin J. J Invest Allergol Clin Immunol. 2009;19:340–354. [PubMed] [Google Scholar]
- 4.Quint JK, Wedzicha JA. J Allergy and Clin Immunol. 2007;119:1065–1071. doi: 10.1016/j.jaci.2006.12.640. [DOI] [PubMed] [Google Scholar]
- 5.Hoenderdos K, Condliffe A. Am J Respir Cell and Mol Biol. 2013;48:531–539. doi: 10.1165/rcmb.2012-0492TR. [DOI] [PubMed] [Google Scholar]
- 6.Hurd S. Chest. 2000;117:1–4. doi: 10.1378/chest.117.2_suppl.1s. [DOI] [PubMed] [Google Scholar]
- 7.Fahy JV. Proc Am Thorac Soc. 2009;6:256–259. doi: 10.1513/pats.200808-087RM. [DOI] [PubMed] [Google Scholar]
- 8.Barnes PJ. J Allergy Clin Immunol. 2007;119:1055–1062. doi: 10.1016/j.jaci.2007.01.015. [DOI] [PubMed] [Google Scholar]
- 9.Simpson JL, Phipps S, Gibson PG. Pharmacol Ther. 2009;124:86–95. doi: 10.1016/j.pharmthera.2009.06.004. [DOI] [PubMed] [Google Scholar]
- 10.Qazi BS, Tang K, Qazi A. Int J of Inflam. 2011;2011:908468. doi: 10.4061/2011/908468. [DOI] [PMC free article] [PubMed] [Google Scholar]
- 11.Richardson RM, Pridgen BC, Haribabu B, Ali H, Snyderman R. J Biol Chem. 1998;273:23830–23836. doi: 10.1074/jbc.273.37.23830. [DOI] [PubMed] [Google Scholar]
- 12.Zeilhofer HU, Schorr W. Curr Opin Hematol. 2000;7:178–182. doi: 10.1097/00062752-200005000-00009. [DOI] [PubMed] [Google Scholar]
- 13.Cicchetti G, Allen PG, Glogauer M. Critical Reviews in Oral Biology & Medicine. 2002;13:220. doi: 10.1177/154411130201300302. [DOI] [PubMed] [Google Scholar]
- 14.Rhee SG, Bae YS. J Biol Chem. 1997;272:15045–15048. doi: 10.1074/jbc.272.24.15045. [DOI] [PubMed] [Google Scholar]
- 15.Wu D, Huang CK, Jiang H. J Cell Sci. 2000;113:2935–2940. doi: 10.1242/jcs.113.17.2935. [DOI] [PubMed] [Google Scholar]
- 16.Chapman RW, Phillips JE, Hipkin RW, Curran AK, Lundell D, Fine JS. Pharmacol Ther. 2009;121:55–68. doi: 10.1016/j.pharmthera.2008.10.005. [DOI] [PubMed] [Google Scholar]
- 17.Vlahos CJ, Matter WF, Brown RF, Traynorkaplan AE, Heyworth PG, Prossnitz ER, Ye RD, Marder P, Schelm JA, Rothfuss KJ, Serlin BS, Simpson PJ. J Immunol. 1995;154:2413–2422. [PubMed] [Google Scholar]
- 18.Sapey E, Stockley JA, Greenwood H, Ahmad A, Bayley D, Lord JM, Insall RH, Stockley RA. Am J Respir Crit Care Med. 2011;183:1176–1186. doi: 10.1164/rccm.201008-1285OC. [DOI] [PubMed] [Google Scholar]
- 19.Akgul C, Moulding DA, Edwards SW. FEBS Letters. 2001;487:318–322. doi: 10.1016/s0014-5793(00)02324-3. [DOI] [PubMed] [Google Scholar]
- 20.Yasui K, Agematsu K, Shinozaki K, Hokibara S, Nagumo H, Yamada S, Kobayashi N, Komiyama A. J Leukocyte Biol. 2000;68:194–200. [PubMed] [Google Scholar]
- 21.Culpitt SV, de Matos C, Russell RE, Donnelly LE, Rogers DF, Barnes PJ. Am J Respir Crit Care Med. 2002;165:1371–1376. doi: 10.1164/rccm.2105106. [DOI] [PubMed] [Google Scholar]
- 22.Condinoneto A, Vilela MMS, Cambiucci EC, Ribeiro JD, Guglielmi AAG, Magna LA, Denucci G. Br J Clin Pharmacol. 1991;32:557–561. doi: 10.1111/j.1365-2125.1991.tb03951.x. [DOI] [PMC free article] [PubMed] [Google Scholar]
- 23.Li YH, Zhu C. Clin Exp Metastasis. 1999;17:423–429. doi: 10.1023/a:1006614232388. [DOI] [PubMed] [Google Scholar]
- 24.Zicha D, Dunn GA, Brown AF. J Cell Sci. 1991;99:769–775. doi: 10.1242/jcs.99.4.769. [DOI] [PubMed] [Google Scholar]
- 25.Toetsch S, Olwell P, Prina-Mello A, Volkov Y. Integr Biol. 2009;1:170–181. doi: 10.1039/b814567a. [DOI] [PubMed] [Google Scholar]
- 26.Whitesides GM. Nature. 2006;442:368–373. doi: 10.1038/nature05058. [DOI] [PubMed] [Google Scholar]
- 27.Oh H, Siano B, Diamond SJ. Visualized Exp. 2008;17:e745. doi: 10.3791/745. [DOI] [PMC free article] [PubMed] [Google Scholar]
- 28.Lin F, Nguyen CC, Wang SJ, Saadi W, Gross S, Jeon N. Ann Biomed Eng. 2005;33:475–482. doi: 10.1007/s10439-005-2503-6. [DOI] [PubMed] [Google Scholar]
- 29.Grynkiewicz G, Poenie M, Tsien RY. J Biol Chem. 1985;260:3440–3450. [PubMed] [Google Scholar]
- 30.Kim D, Haynes CL. Anal Chem. 2012;84:6070–6078. doi: 10.1021/ac3009548. [DOI] [PMC free article] [PubMed] [Google Scholar]
- 31.Xu Y, Loison F, Luo HR. Proc Natl Acad Sci. 2010;107:2950–2955. doi: 10.1073/pnas.0912717107. [DOI] [PMC free article] [PubMed] [Google Scholar]
- 32.Simon HU. Immunol Rev. 2003;193:101–110. doi: 10.1034/j.1600-065x.2003.00038.x. [DOI] [PubMed] [Google Scholar]
- 33.Fox S, Leitch AE, Duffin R, Haslett C, Rossi AG. J Innate Immun. 2010;2:216–227. doi: 10.1159/000284367. [DOI] [PMC free article] [PubMed] [Google Scholar]
- 34.Yasui K, Hu B, Nakazawa T, Agematsu K, Komiyama A. J Clin Invest. 1997;100:1677–1684. doi: 10.1172/JCI119692. [DOI] [PMC free article] [PubMed] [Google Scholar]
- 35.Mentz F, Mossalayi M, Ouaaz F, Baudet S, Issaly F, Ktorza S, Semichon M, Binet J, Merle-Beral H. Blood. 1996;88:2172–2182. [PubMed] [Google Scholar]
- 36.Yasui K, Agematsu K, Shinozaki K, Hokibara S, Nagumo H, Nakazawa T, Komiyama A. J Leukocyte Biol. 2000;67:529–535. doi: 10.1002/jlb.67.4.529. [DOI] [PubMed] [Google Scholar]
- 37.White JR, Lee JM, Young PR, Hertzberg RP, Jurewicz AJ, Chaikin MA, Widdowson K, Foley JJ, Martin LD, Griswold DE, Sarau HM. J Biol Chem. 1998;273:10095–10098. doi: 10.1074/jbc.273.17.10095. [DOI] [PubMed] [Google Scholar]
- 38.Weiner OD, Neilsen PO, Prestwich GD, Kirschner MW, Cantley LC, Bourne HR. Nat Cell Biol. 2002;4:509–513. doi: 10.1038/ncb811. [DOI] [PMC free article] [PubMed] [Google Scholar]
- 39.Vlahos CJ, Matter WF, Hui KY, Brown RF. J Biol Chem. 1994;269:5241–5248. [PubMed] [Google Scholar]
Associated Data
This section collects any data citations, data availability statements, or supplementary materials included in this article.