Abstract
We report on the emergence of spontaneously forming migrating bands of E.coli bacteria inside a microchannel containing microstructured ratchets. We show that a collection of bacteria is able to migrate against the funnel-shaped barriers by creating and maintaining a chemoattractant gradient. A transition between pure rectification and chemotaxis-driven collective motion is predicted from theoretical models, and is observed experimentally as the initial inoculation density is varied.
Complex collective phenomena may emerge from the seemingly simple behavior of the individual components of a biological system. For example, a self-propelled swimmer that runs in straight lines and reorients itself in tumbles will be redirected by and continue to swim along a microstructured wall, and will do so until it tumbles again [1]. Arranging the walls asymmetrically can bias a swimmer’s migration [2–5], and recent work has recently exploited this ratchetlike behavior to develop asymmetric micromachines that harness bacterial motion as an energy source [6,7]. Similar ratcheting devices, which rely on patterned surface chemistries, also guide nonswimming cells such as mammalian cells [8] or neurons [9].
However, when a system is allowed to interact with and modify its environment, the resulting dynamics may change drastically. In this Letter, we observe how emergent collective behavior of E.coli bacteria allows them to escape funnel-shaped barriers by forming traveling bands in microchannels. We derive a model describing E.coli bacteria in which rectification, caused by the interaction between bacteria and the ratchets’ walls, is in opposition with chemotactically driven collective motion. A transition between motion rectification and chemotactic band formation is observed as the cell density is increased, leading to cell escape from the asymmetric barriers for densities greater than 5 × 10⁶ cells/mL.
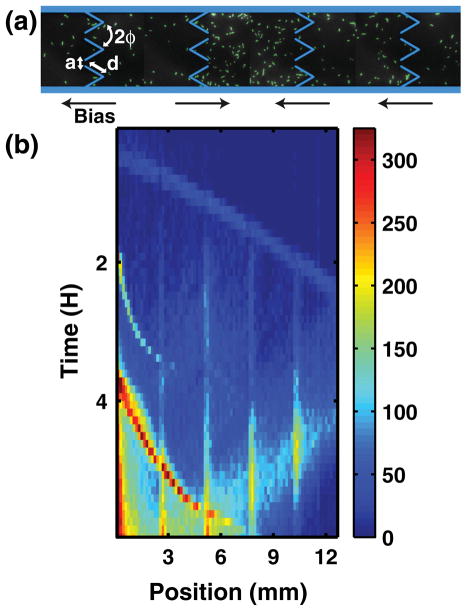
The device used is shown in Fig. 1(a). It consists of 85 chambers with a row of funnels connecting each pair of adjacent chambers, miniaturizing a previous design [4]. Funnel walls 40 μm long meet at an angle 2ϕ = 60° and neighboring funnels create apertures 5 μm wide. Chambers measure 100 μm wide by 150 μm long. Eighty of the funnel arrays accumulate cells toward the inoculation port, located on the left side of Fig. 1(a). Four arrays point in the opposite direction, creating local “traps” located 2.7, 5.4, 8.1, and 10.8 mm away from the inoculation port. Figure 1(a) shows a trap in action. Observation of a high density of cells inside the traps is used to confirm that the funnel arrays are indeed rectifying the motion of the cells.
FIG. 1.
(a) Fluorescence micrograph of individual cells (labeled green) inside the microchannel. Cell traps, where the rectification bias is reversed, have a higher concentration of cells. (b) False-color image showing the number of cells in each chamber as a function of time. Note that three spontaneously forming migrating bands of bacteria are observed, launching at T = 0, 2, and 4 h, and that the first one is scattered back after it reaches the end of the microchannel (between T = 4 and T = 6 h).
Device fabrication and preparation have been described elsewhere [10]. We first fill the device with lysogeny broth (LB), a rich medium, and inoculate E.coli cells producing green fluorescent protein on the left side of the device. A computer-controlled microscope scans the chamber array every 2 min, and a highly sensitive electron-multiplying CCD (Rolera MGi +, Qimaging) records digital stills of each chamber. The number of cells in each chamber is measured by applying a peak detection algorithm to the recorded epifluorescence micrographs.
Figure 1(b) plots the number of cells counted in each chamber as a function of time for an initial density b0 of 250 × 106 cells/mL. Although some cells are being trapped near the inoculation port and at each of the four traps, a significant fraction of the cells migrate against the funnel bias inside one of the three traveling bands observed to launch at T = 0.5, 2, and 4 h. These three bands observed in Fig. 1(b) are reminiscent of the three outwardly propagating rings observed in semisolid agar plates [11]. Adler et al. have shown that chemotaxis, a process by which cells’ motion is influenced by nutrient gradients, allows these rings to appear, and that the first ring consumes serine, the second aspartic acid, and the third threonine. Since we expected the cells to be rectified toward the inoculation port, this indicates that the presence of nutrient may be causing these bands to form. Indeed, replacing LB broth in our device by a motility buffer which contains no nutrient maintains the cell population near the inoculation port (data not shown).
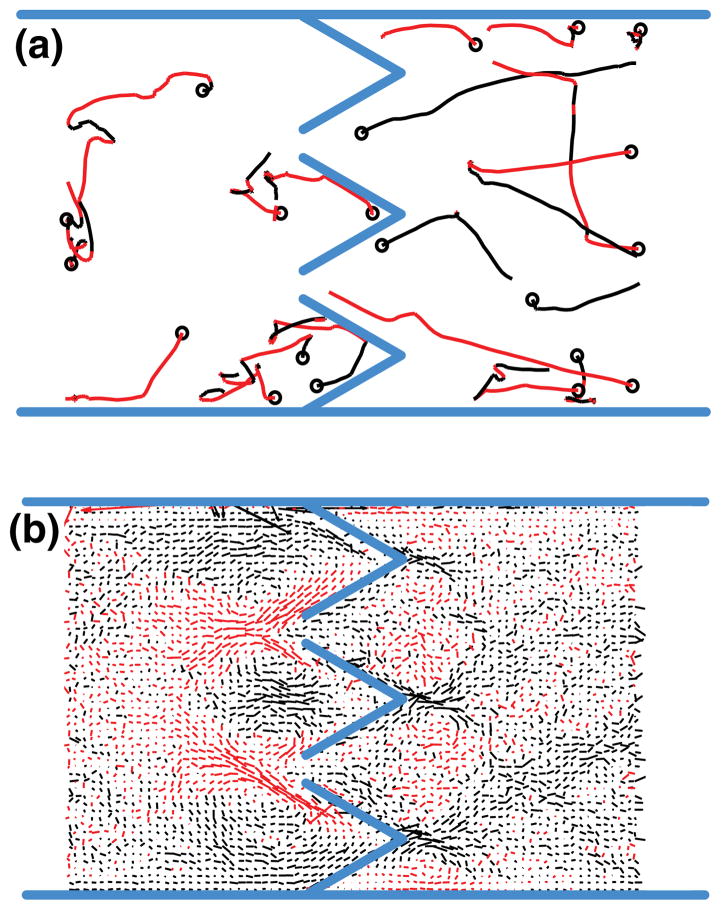
Although chemotaxis may be influencing the motion of cells over large scales, we still aim to determine whether it is also affected at the microscale by the funnel geometry. Indirect evidence of rectification by the ratchets is provided in Fig. 1(b), where we observe high concentrations of cells at the trap locations (the four vertical stripes). However, this does not indicate how the funnels affect the cell’s motion microscopically. We perform an experiment in a device containing rich medium and monitor the motion of individual cells in each chamber by recording 7.5-s videos at 10 frames per second. A path-reconstruction algorithm is used to trace the motion of each individual cell, as shown in Fig. 2(a). We reconstruct the paths of the cells throughout the experiments and compute the average speed and direction at each point in space. The resulting velocity field, which captures how the funnels act on a cell’s motion microscopically, is shown in Fig. 2(b). We observe large domains whose length scale is on the order of ~50 μm and over which the velocities are highly correlated spatially. This indicates that the funnel geometry does have an influence on the cells’ motion, but this effect is not strong enough to prevent cells from escaping the microscopic ratchets.
FIG. 2.
(a) Motion of individual bacteria during a single 7.5-s video recording. Red indicates motion toward the inoculation port (to the left of the figure), and a circle denotes the starting point of the recorded motion. (b) Average vector field of the cells’ motion. The red lines represent vectors pointing to the left, and black lines to the right.
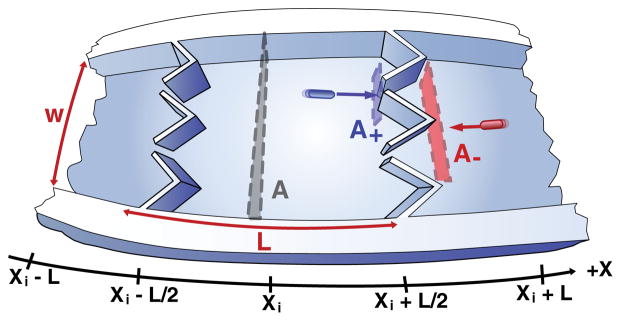
To understand how the traveling bands arise in spite of the presence of ratchets, we use a microscopic description of a cell’s swimming dynamics which includes both chemotaxis and the effect of the funnel geometry. Figure 3 illustrates a microchannel where the chambers, each of which are of width L with cross section A, are centered at x = {x1, x2, …, xi,…}. The chamber at xi contains n(xi) bacteria, so we write the concentration as b(xi) = n(xi)/(AL). We notate the flux of cells in the −x direction into the chamber at xi as . Chemotaxis and a funnel geometry lead to flux equations more sophisticated than expected for pure plug flow, as shown in Eq. (1):
| (1) |
where the fraction of cells moving toward the left (P− term) is modulated by the coefficients ν±, which denote the tumble rates for a cell traveling in the ±x direction, as . The tumbling rate of a single cell decreases as it moves in the direction of increasing attractant concentration. This allows a collection of cells to migrate toward regions of high attractant concentration [12]. An obstacle term is also included because cells swimming in the +x direction impinge from the left upon apertures of effective area A+, which is different from the cross section A− seen by cells moving in the −x direction [4].
FIG. 3.

Visualization of funnel rectification in terms of cross sections. Cells swimming toward funnels from the left encounter an effective cross section different from that encountered by cells swimming from the right.
We now physically interpret individual pieces of Eq. (1), first in the absence of chemotaxis. This describes a situation where the nutrient uptake is too slow or unimportant. In the language of Eq. (1), it means that the tumble rates ν± will be equal, so we suppress ν-containing terms. Upon solving the continuity equation for the bacterial density b, we get
| (2) |
in terms of coefficients α = (A− − A+)/2A and β = (A− + A+)/2A. The steady-state solution is
| (3) |
an exponential cell density profile with normalization constant b∞. This exponential trapping profile has been observed experimentally in devices for which the nutrient concentration is either homogeneous, as in [2], or where there were no chemoattractants at all, such as in our device filled with motility buffer and in [3].
On the other hand, if we consider Eq. (1) with A− = A+, while keeping the chemotaxis factor, the model describes migration inside a symmetric channel in the presence of nutrients. We define the fraction of cells in the ±x direction P± as , with an arbitrary function χ, following a slightly more general description than [13]. Solving the continuity equation, we obtain
| (4) |
in terms of the swimming velocity v. Equation (4) is usually accompanied by an equation describing the nutrient dynamics [14]. The nutrient c, in this case, is taken to be serine—i.e., the nutrient that produces the first band. Taken together, these two expressions are an example of the well-known Keller-Segel equations [15,16].
Equation (1) allows for both bandlike migration and exponential trapping. It is not clear, however, which phenomenon dominates in our microfluidics device: chemotaxis or rectification of motion by the ratchets. The analysis above shows that each acts at a different length scale. The length scale of exponential trapping, given by
| (5) |
only depends on the geometry of the device.
Previous work has studied factors influencing the shape of a band of bacteria and its ability to propagate, including nutrient diffusion, the precise form of the motility μ, chemotactic sensitivity χ, and the form of the consumption rate coefficient k [17–19]. For example, Keller and Segel derive in [16] that the width W of the traveling band, once it relaxes to a steady shape, depends on the motility μ, the consumption rate k, and the initial attractant and bacterial concentrations c0 and b0 according to
| (6) |
assuming that all the cells inoculated in the first chamber contribute to the band.
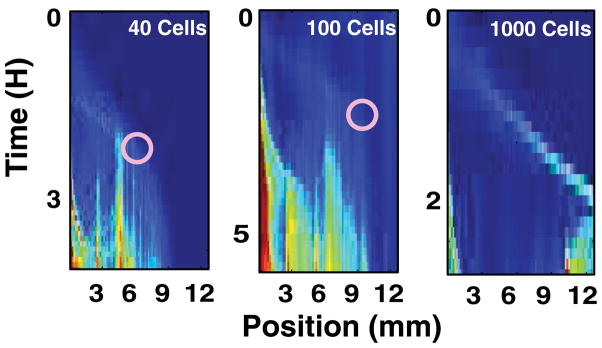
The observation of chemotactic bands in the presence of an array of funnels requires that the scale at which a nutrient gradient is created and sustained by the cells is smaller than that at which cells are being rectified by the funnel geometry—i.e., W < ℓ. Equation (6) shows that the width W is inversely proportional to the initial density b0, while Eq. (5) indicates that the trapping length ℓ is fixed by the device dimensions. To determine whether a transition from Keller and Segel dynamics at high inoculation densities to exponential trapping at low densities is occurring in our device, we perform a series of experiments where we vary the initial density of cells b0 from 104 to 109 cells/mL.
Figure 4 plots the number of cells counted in each chamber as a function of time for three experiments, each inoculated with a different initial number of cells. In all three devices, cells travel away from the inoculation port. In the highest-density experiment, a band reaches the other side of the device, 12 mm away, in about 2 h. In the lowest-density experiment, however, cells spread over no more than half the device. The lowest density for which exponential trapping is not strong enough to inhibit chemotactic escape occurs at approximately 200 cells/chamber. This density corresponds to a packing fraction of ~0.004, using a cell volume roughly 0.7 μm3 [20]. These large scale correlations in the cells’ motion, which are on the order of many cell lengths, do not occur at the packing fractions expected for steric interactions described in the literature. Reichhardt and co-workers reported numerical simulations of steady-state swimmer concentrations on two sides of a funnel array, and this rectification ratio began dropping off at a packing fraction around 0.05 [5]. Sokolov’s experiment in a thin film showed swimmer-motion correlation primarily at packing fractions 0.28 and greater [21]. Allowing cells to interact and modify their microenvironments therefore leads to the emergence of highly complex dynamics, which are not observed in experiments where the environment is kept homogeneous.
FIG. 4.

In these experimental plots, the labeled number of cells refers to the cells initially placed into the chamber closest to the inoculation port. The circle shows the position at which a packet stopped migrating, according to visual inspection.
In summary, we observed the collective escape of E.coli bacteria from an array of rectifying barriers. Microscopic analysis of the cells’ motion during escape has shown that the asymmetric barriers do influence the microscopic behavior of cells, but the large scale, population-wide dynamics are not like those observed in [2,3]. Self-propelled bacteria become trapped by funnels, but our model suggested that escape from an array of rectifying barriers is possible for high enough densities. A density threshold, above which sufficient nutrient uptake leads to the creation of an attractant gradient, has been shown to exist. Similar emergent density-dependent self-organization of biological systems has also been reported in cell crowding [22,23] and in three-dimensional flights of birds [24]. Our results show that microorganisms also express complex behaviors—namely, collective escape from microscopic ratchets—when populations are interacting with their environment.
Acknowledgments
We thank Ned Wingreen and Raymond E. Goldstein for valuable discussions. This work was performed in part at the Cornell NanoScale Facility, a member of the National Nanotechnology Infrastructure Network, which is supported by the National Science Foundation (Grant No. ECS 03-35765). National Science Foundation Grant No. PHY 0750323 supported this research. The research described was supported by Grant No. U54CA143803 from the National Cancer Institute. The content is solely the responsibility of the authors and does not necessarily represent the official views of the National Cancer Institute or the National Institutes of Health.
Footnotes
PACS numbers: 87.17.Jj, 05.40.Fb, 47.63.Gd
References
- 1.Di Luzio WR, et al. Nature (London) 2005;435:1271. [Google Scholar]
- 2.Galajda P, et al. J Bacteriol. 2007;189:8704. doi: 10.1128/JB.01033-07. [DOI] [PMC free article] [PubMed] [Google Scholar]
- 3.Hulme SE, et al. Lab Chip. 2008;8:1888. [Google Scholar]
- 4.Galajda P, et al. J Mod Opt. 2008;55:3413. [Google Scholar]
- 5.Wan MB, Olson Reichhardt CJ, Nussinov Z, Reichhardt C. Phys Rev Lett. 2008;101:018102. doi: 10.1103/PhysRevLett.101.018102. [DOI] [PubMed] [Google Scholar]
- 6.Angelani L, Leonardo RD, Ruocco G. Phys Rev Lett. 2009;102:048104. doi: 10.1103/PhysRevLett.102.048104. [DOI] [PubMed] [Google Scholar]
- 7.Sokolov A, Apodaca MM, Grzybowski BA, Aranson IS. Proc Natl Acad Sci USA. 2010;107:969. doi: 10.1073/pnas.0913015107. [DOI] [PMC free article] [PubMed] [Google Scholar]
- 8.Mahmud G, et al. Nature Phys. 2009;5:606. [Google Scholar]
- 9.Feinerman O, Rotem A, Moses E. Nature Phys. 2008;4:967. [Google Scholar]
- 10.Keymer JE, Galajda P, Lambert G, Liao D, Austin RH. Proc Natl Acad Sci USA. 2008;105:20269. doi: 10.1073/pnas.0810792105. [DOI] [PMC free article] [PubMed] [Google Scholar]
- 11.Adler J. Science. 1966;153:708. doi: 10.1126/science.153.3737.708. [DOI] [PubMed] [Google Scholar]
- 12.Segall JE, Block SM, Berg HC. Proc Natl Acad Sci USA. 1986;83:8987. doi: 10.1073/pnas.83.23.8987. [DOI] [PMC free article] [PubMed] [Google Scholar]
- 13.Schnitzer M. Phys Rev E. 1993;48:2553. doi: 10.1103/physreve.48.2553. [DOI] [PubMed] [Google Scholar]
- 14.This expression neglects nutrient diffusion and assumes nutrient concentrations do not limit nutrient uptake rate k.
- 15.Keller EF, Segel LA. J Theor Biol. 1970;26:399. doi: 10.1016/0022-5193(70)90092-5. [DOI] [PubMed] [Google Scholar]
- 16.Keller EF, Segel LA. J Theor Biol. 1971;30:235. doi: 10.1016/0022-5193(71)90051-8. [DOI] [PubMed] [Google Scholar]
- 17.Holz M, Chen S. Biophys J. 1978;23:15. doi: 10.1016/S0006-3495(78)85429-0. [DOI] [PMC free article] [PubMed] [Google Scholar]
- 18.Scribner TL, Segel LA, Rogers EH. J Theor Biol. 1974;46:189. doi: 10.1016/0022-5193(74)90147-7. [DOI] [PubMed] [Google Scholar]
- 19.Novick-Cohen A, Segel LA. J Math Biol. 1984;19:125. doi: 10.1007/BF00275935. [DOI] [PubMed] [Google Scholar]
- 20.Kubitschek HE. J Bacteriol. 1990;172:94. doi: 10.1128/jb.172.1.94-101.1990. [DOI] [PMC free article] [PubMed] [Google Scholar]
- 21.Sokolov A, Aranson I, Kessler J, Goldstein R. Phys Rev Lett. 2007;98:158102. doi: 10.1103/PhysRevLett.98.158102. [DOI] [PubMed] [Google Scholar]
- 22.Cho H, et al. PLoS Biol. 2007;5:e302. doi: 10.1371/journal.pbio.0050302. [DOI] [PMC free article] [PubMed] [Google Scholar]
- 23.Park S, et al. Proc Natl Acad Sci USA. 2003;100:13 910. [Google Scholar]
- 24.Ballerini M, et al. Proc Natl Acad Sci USA. 2008;105:1232. doi: 10.1073/pnas.0711437105. [DOI] [PMC free article] [PubMed] [Google Scholar]


