Abstract
Background
Allergic sensitization is an important risk factor for the development of atopic disease. The National Health and Nutrition Examination Survey (NHANES) 2005–2006 provides the most comprehensive information on IgE-mediated sensitization in the general US population.
Objective
We investigated clustering, sociodemographic and regional patterns of allergic sensitization and examined risk factors associated with IgE-mediated sensitization.
Methods
Data for this cross-sectional analysis were obtained from NHANES 2005–2006. Participants aged ≥1 year (N=9440) were tested for sIgEs to inhalant and food allergens; participants ≥6 years were tested for 19 sIgEs, and children aged 1–5 years for 9 sIgEs. Serum samples were analyzed using the ImmunoCAP System. Information on demographics and participant characteristics was collected by questionnaire.
Results
Of the study population aged 6 and older, 44.6% had detectable sIgEs, while 36.2% of children aged 1–5 years were sensitized to ≥1 allergen. Allergen-specific IgEs clustered into 7 groups that might have largely reflected biological cross-reactivity. Although sensitization to individual allergens and allergen types showed regional variation, the overall prevalence of sensitization did not differ across census regions, except in early childhood. In multivariate modeling, young age, male gender, non-Hispanic black race/ethnicity, geographic location (census region), and reported pet avoidance measures were most consistently associated with IgE-mediated sensitization.
Conclusions
The overall prevalence of allergic sensitization does not vary across US census regions, except in early life, although allergen-specific sensitization differs by sociodemographic and regional factors. Biological cross-reactivity may be an important, but not a sole, contributor to the clustering of allergen-specific IgEs.
Clinical implications
IgE-mediated sensitization shows clustering patterns and differs by sociodemographic and regional factors, but the overall prevalence of sensitization may not vary across US census regions.
Keywords: allergen, allergy, allergic sensitization, serum IgE
INTRODUCTION
The increased prevalence of allergic diseases is a major public health concern worldwide.1 In the United States (US), millions of people are affected by immunoglobulin E (IgE) –mediated diseases, which not only impact the quality of life, but also place considerable economic burden on patients and society.2, 3
The common hallmark of atopic disease is the production of specific IgE (sIgE) against allergens. Assessment of sIgE antibodies with in vivo skin test challenges or in vitro serologic analyses confirm allergic sensitization, while the patient’s clinical history and physical examination remain important cornerstones of the diagnosis of atopic disease.4 Monitoring the prevalence and patterns of IgE-mediated sensitization in populations over time is important because allergic sensitization is a significant risk factor for the development of atopic disease.1 In the US, prevalence of allergic sensitization in the general population has been estimated in three National Health and Nutrition Examination Surveys (NHANES).5–8 In NHANES II (1976–1980) and III (1988–1994) allergy testing was conducted by skin prick tests, whereas NHANES 2005–2006 measured sIgE levels in serum. The NHANES 2005–2006 provides the largest and most recent nationally representative data on IgE-mediated sensitization in the US population. Participants aged 6 years and older were tested for 19 sIgE antibodies, and those ages 1–5 were tested for a subset of the antibodies (9 sIgEs). The NHANES 2005–2006 not only tested a greater number of allergens across a wider age range than the prior studies, but also provided quantitative information on extent of allergic sensitization.
This article provides a comprehensive report on clustering, sociodemographic and regional patterns of allergic sensitization in the US population. Patterns of sensitization in NHANES 2005–2006 were compared with NHANES III data. We also identified factors independently associated with IgE-mediated sensitization in the general population.
METHODS
Data
Data were obtained from NHANES 2005–2006, which is designed to assess the health and nutritional status of the civilian, noninstitutionalized US population. The NHANES 2005–2006, which includes 10,348 individuals, over-sampled persons of low-income, adolescents 12–19 years, persons 60 years of age and older, African Americans, and Mexican Americans, in order to assure adequate samples for subgroup analyses. To protect participant confidentiality, all data analysis using restricted, not publicly available, variables (census region, level of urbanization) was conducted at the National Center for Health Statistics (NCHS) Atlanta Research Data Center (RDC). The survey protocol was approved by the NCHS Ethics Review Board,9 and written informed consent was obtained from all participants. A detailed description of the survey design and methods is online at http://www.cdc.gov/nchs/nhanes/nhanes2005_2006/nhanes05_06.htm.10 To examine sensitization patterns over time, we used NHANES III data for comparisons. Study procedures and methods for the NHANES III data have been previously described.7
Assessment of allergen-specific IgEs and atopy
Participants aged 1 year and older were eligible for serum IgE testing. Blood samples were analyzed using the Pharmacia Diagnostics ImmunoCAP 1000 System (Kalamazoo, Michigan), now known as Thermo Scientific™ ImmunoCAP Specific IgE. Participants aged 6 years and older were tested for allergen-specific IgE antibodies to 15 inhalant (i.e., indoor, outdoor) allergens [Alternaria alternata, Aspergillus fumigatus, Bermuda grass (Cynodon dactylon), birch (Betula verrucose), cat dander, cockroach (Blatella germanica), dog dander, dust mite (Dermatophagoides farinae and D. pteronyssinus), mouse urine proteins, oak (Quercus alba), ragweed (Ambrosia elatior), rat urine proteins, Russian thistle (Salsola kali), rye grass (Lolium perenne)] and 4 food allergens [egg white, cow’s milk, peanut (Arachis hypgaea), and shrimp (Pandalus borealis)]. Because of smaller quantities of serum, the IgE panel for children under age 6 years was limited to 9 allergens [Alternaria alternata, cat dander, cockroach (Blatella germanica), dog dander, dust mite (Dermatophagoides farinae and D. pteronyssinus), egg white, cow’s milk, and peanut (Arachis hypgaea)]. Of the participants 6 and older (N=8086), 89.9% (N=7268) had data for all 19 specific IgEs, and of the children aged 1–5 years, 63.2% (N=856) had complete data for the partial IgE panel.
The threshold for a positive test, which was considered indicative of sensitization, was the level of detection (≥ 0.35 kUa/L). Subjects with at least 1 positive sIgE were considered atopic. Detailed description of the laboratory procedures is presented elsewhere.11, 12
Statistical Analyses
Descriptive analyses and predictive modeling were performed using SAS (version 9.2, Cary, NC) and SUDAAN (version 10.0, Research Triangle Park, NC). Cluster analysis was conducted using the R system for statistical computing (version 2.10.1). To account for the complex survey design, survey nonresponse, and post-stratification, sampling weights and design variables were applied to all analyses (NHANES 205–2006, NHANES III) in order to obtain unbiased national prevalence and variance estimates.
Participants aged 6 and older and 1–5 year olds were analyzed separately because of the differences in IgE panels. Differences in the prevalence of positive allergen-specific IgE tests by general population characteristics were tested with chi-square statistics. Among atopic individuals, we used F-statistics to test differences in geometric mean (GM) concentrations of sIgEs across population characteristic categories. When evaluating racial/ethnic differences, we focused on the three main groups: non-Hispanic whites, non-Hispanic blacks, and Mexican-Americans, excluding the group ‘others’ because of racial/ethnic heterogeneity. To examine clustering of sIgEs, we used different statistical methods, including hierarchical clustering, factor analysis, and multidimensional scaling.
We used logistic regression analysis to identify predictors of specific IgE positivity (i.e., sensitization) in the general population. For the predictor modeling, we used sociodemographic and other characteristics associated with skin test positivity in NHANES III.7 We also included reported pet avoidance measures because avoidance and/or removal of pets because of allergy or asthma was strongly associated with the overall prevalence of sensitization (data not shown). In the full model, we included age, gender, race/ethnicity, poverty/income ratio, education, serum cotinine level, body mass index, year home constructed, census region, level of urbanization, number of household members, household crowding, presence of cats and/or dogs in the home, and reported pet avoidance, and used backward elimination for model selection. All of the remaining predictors in the final model had p-value ≤ 0.05. We also evaluated potential two-way interactions between age, gender, and race/ethnicity, but no strong evidence for effect modification was found.
Sensitivity analyses were conducted to determine whether the modeling results were influenced by using a different cut point for a positive serum IgE test. We also investigated whether similar risk factors were associated with elevated sIgEs among atopic individuals. We considered specific IgE levels elevated if any of the sIgE concentrations exceeded 17.5 kUa/L among subjects ages 6 and older and 3.5 kUa/L among the 1–5 year olds. The cut-offs were not based on clinical relevance; however, they distinguished those with the highest sIgE levels (<10%) among the atopic subjects. Since the additional analyses resulted in similar results (data not shown), we present results only from the logistic regression using the cutoff of 0.35 kUa/L for a positive test.
RESULTS
Prevalence and distributions of allergen-specific IgEs
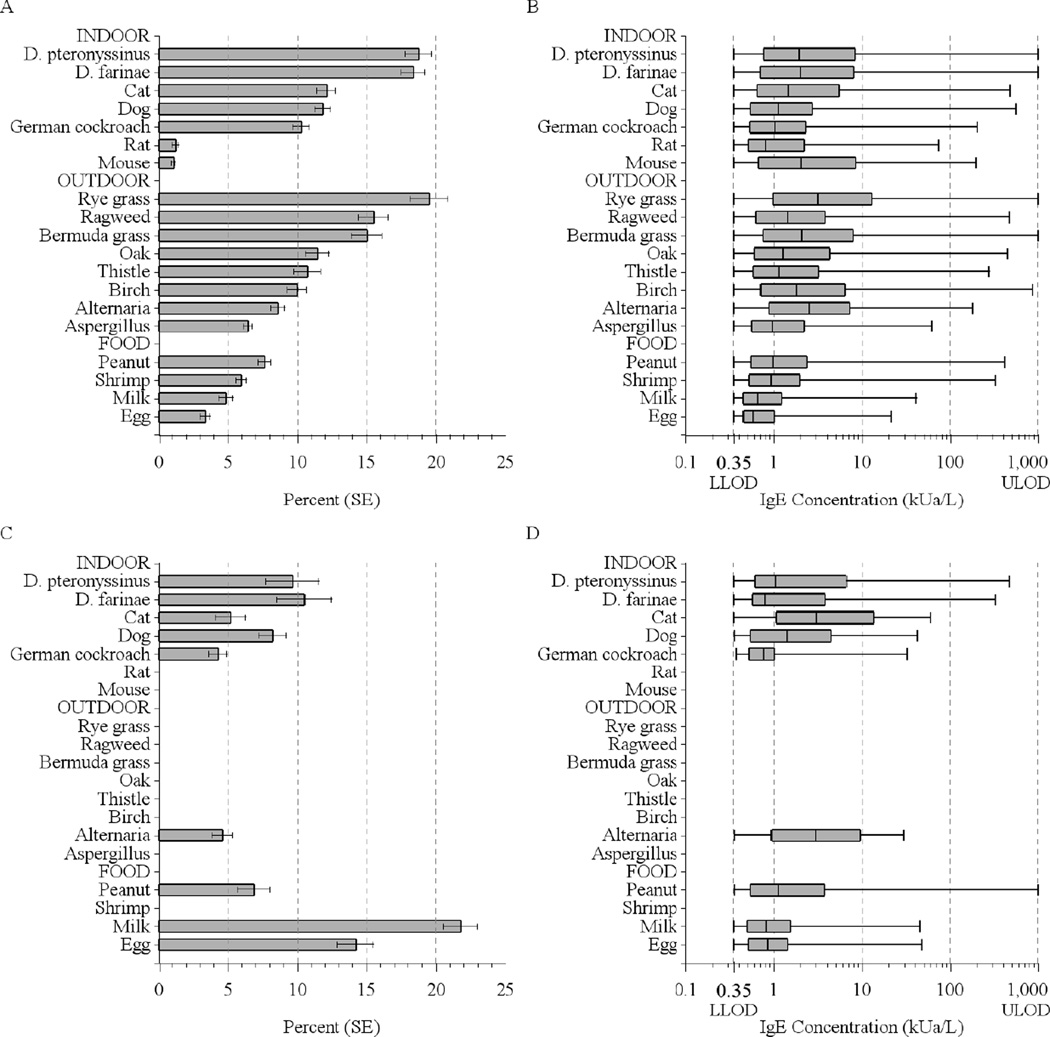
Among the US population aged 6 years and older, 44.6% tested positive to at least one of the 19 allergens, and 36.2% of children aged 1–5 were sensitized to at least one of the 9 allergens tested. The median number of positive tests was 3 among those 6 and older, and 2 among 1–5 year olds. Figure 1 illustrates the prevalence of positive tests and distributions of sIgE concentrations in the US population. Among those 6 and older, the prevalence of a positive IgE test varied from 1.1% (mouse) to 19.5% (rye grass). Sensitization to any indoor and any outdoor allergens was equally common (30%) and more prevalent than sensitization to foods (16.2%) (Table E1 Online Repository). Prevalence of food sensitization (28%) was significantly higher among children younger than 6 years than in older age groups, as previously reported.13 Detailed data on sIgEs, including prevalences and geometric means (GMs), are presented in the Online Repository (Tables E1, E2, E3, and E4).
Figure 1.
Prevalence of positive serum IgE tests and distributions of the allergen-specific antibody concentrations in the US population (A, B: Subjects aged 6 years and older; C,D: Subjects aged 1–5 years). Box plots display the minimum and maximum values and the 25th, 50th, and 75th percentiles. The measuring range was 0.35–1000 kUa/L.
Clustering of positive IgE tests
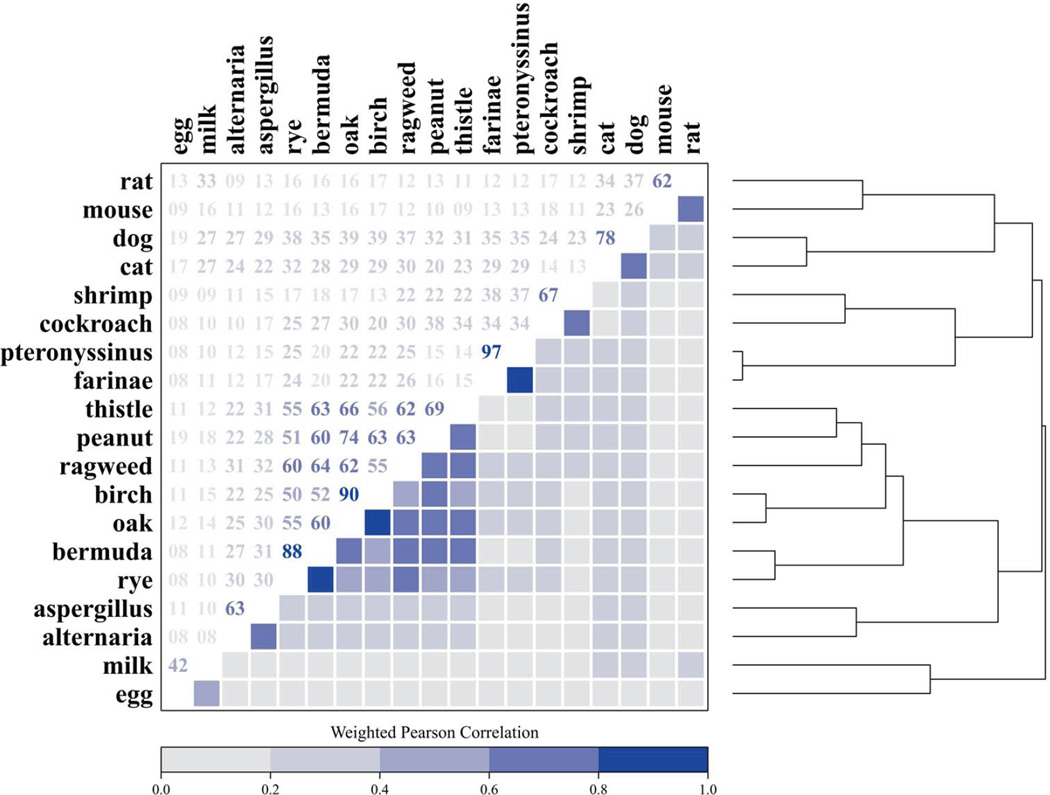
We previously reported in abstract form that the 19 specific IgEs group into clusters;14 Figure 2 illustrates details from the cluster analysis. The dust mite-specific IgEs were most highly correlated (Pearson correlation coefficient of 0.97). In the plant cluster, grass- and tree-specific IgEs, and in the pet cluster, cat- and dog-specific IgEs were also highly correlated (Pearson correlation coefficients ≥ 0.78). Of those aged 6 years and older, 27.1% were sensitized to plant-related (grass-, tree, weed-, and peanut-specific) allergens; 20.3% to dust mites (D. farinae and D. pteronyssinus); 15.7% to pets (dog, cat); 11.7% to cockroach and/or shrimp; 10.4% to molds (Alternaria, Aspergillus); 6.6% to egg white and/or cow’s milk; and 1.8% to rodents (mouse, rat). The percentage of the population with positive cluster responses decreased with increasing number of the clusters. Among those 6 and older, 19.8% had positive responses originating from 1 cluster, and 10.8% from 2, 7.4% from 3, 3.9% from 4, 1.8% from 5, 0.6% from 6, and 0.2% from 7 clusters.
Figure 2.
Clustering of the allergen-specific IgEs. The dendrogram (right) employs hierarchical clustering to group similar sIgEs based on the log-transformed correlation matrix (left). Hierarchical cluster analysis identified 7 IgE clusters: 1) plants (grass-, tree-, weed-, and peanut-specific IgEs); 2) dust mites (D. farinae and D. pteronyssinus); 3) pets (dog and cat); 4) cockroach and shrimp; 5) molds (Alternaria and Aspergillus); 6) foods (egg white, cow’s milk); and 7) rodents (mouse and rat).
Demographic characteristics of allergic sensitization
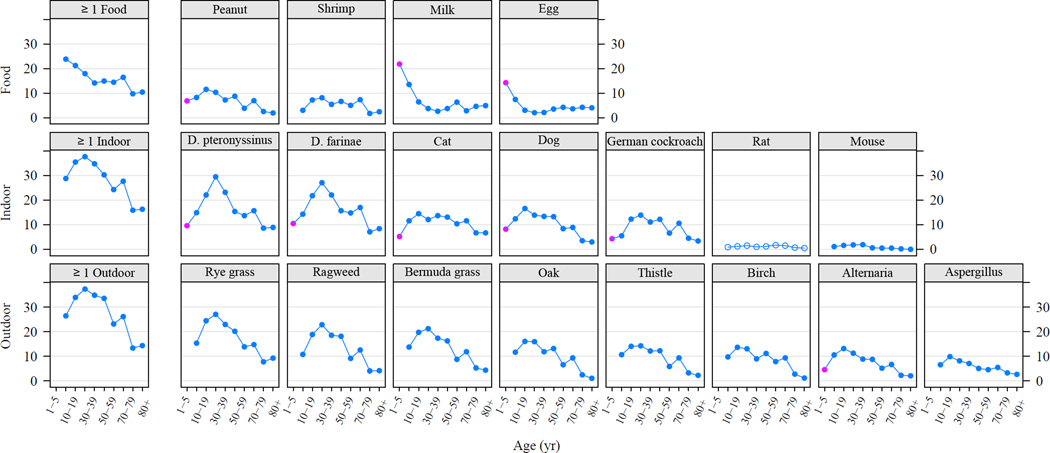
The prevalence of allergic sensitization differed significantly by age for each of the tested allergens except for rat. For inhalant allergens, prevalence of sensitization generally peaked in the second or third decades of life and declined towards late adulthood (Fig 3). In contrast, sensitization to milk and egg was most prevalent among 1–5 year olds, but declined sharply after age 6 throughout childhood.
Figure 3.
Prevalence of positive serum IgE tests by age among the US population. Solid symbols represent statistically significant differences, whereas prevalences that are not statistically different are marked with open symbols. Red symbols indicate the subgroup of allergens that were measured in 1–5 year old children.
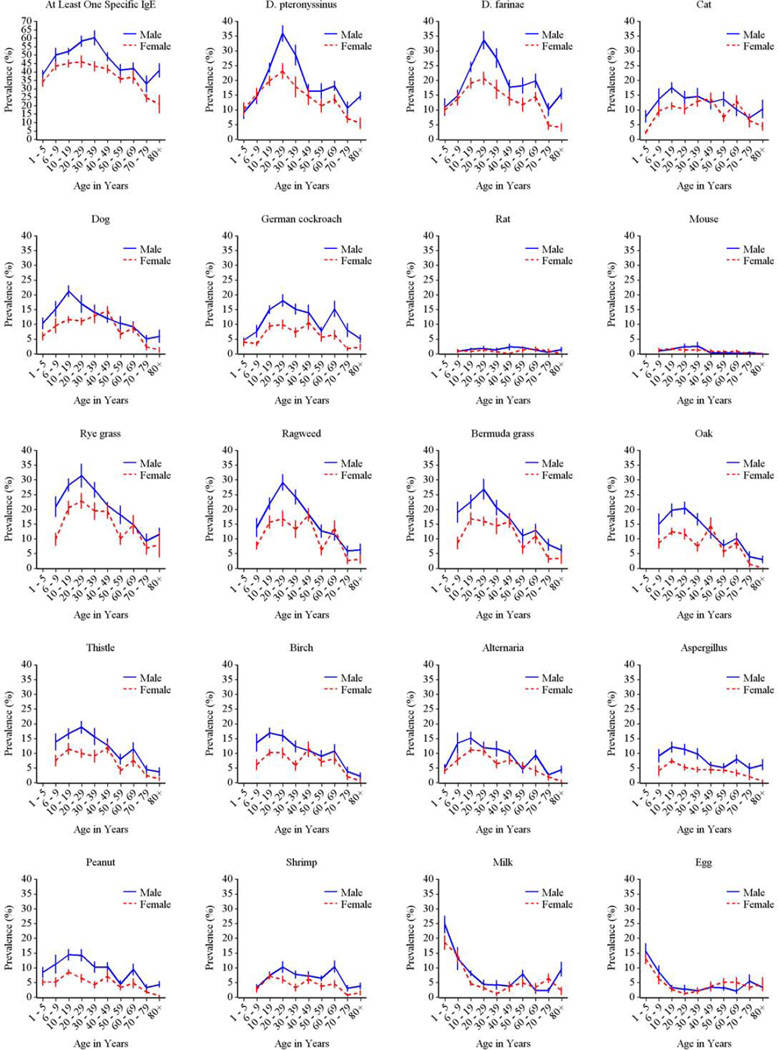
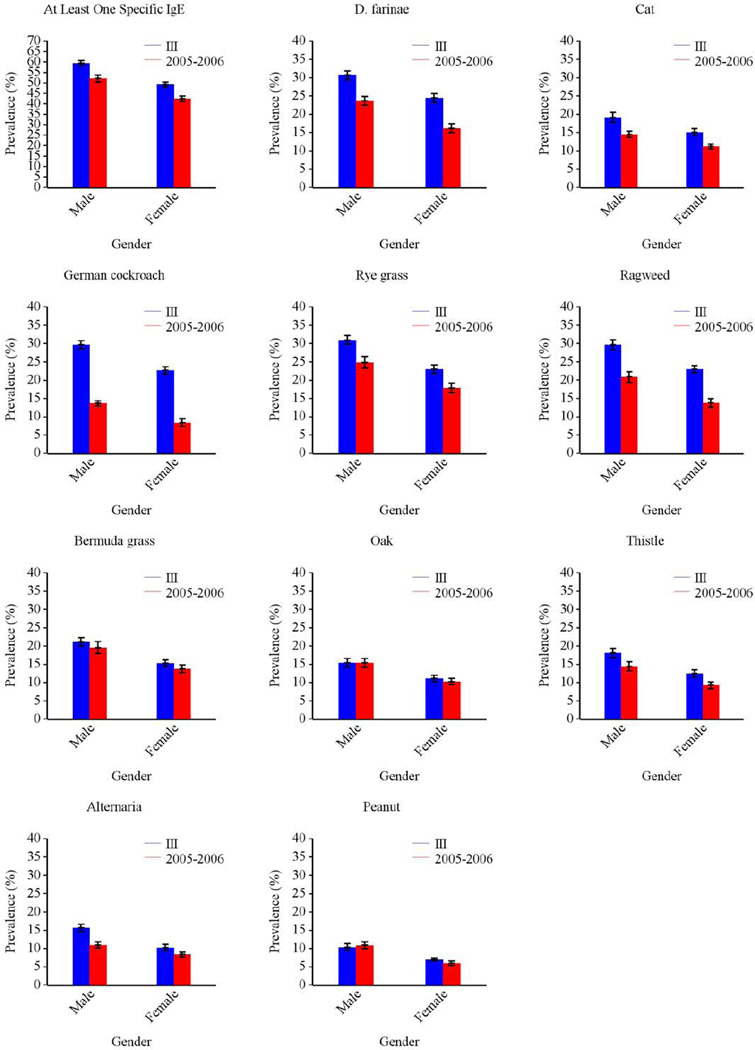
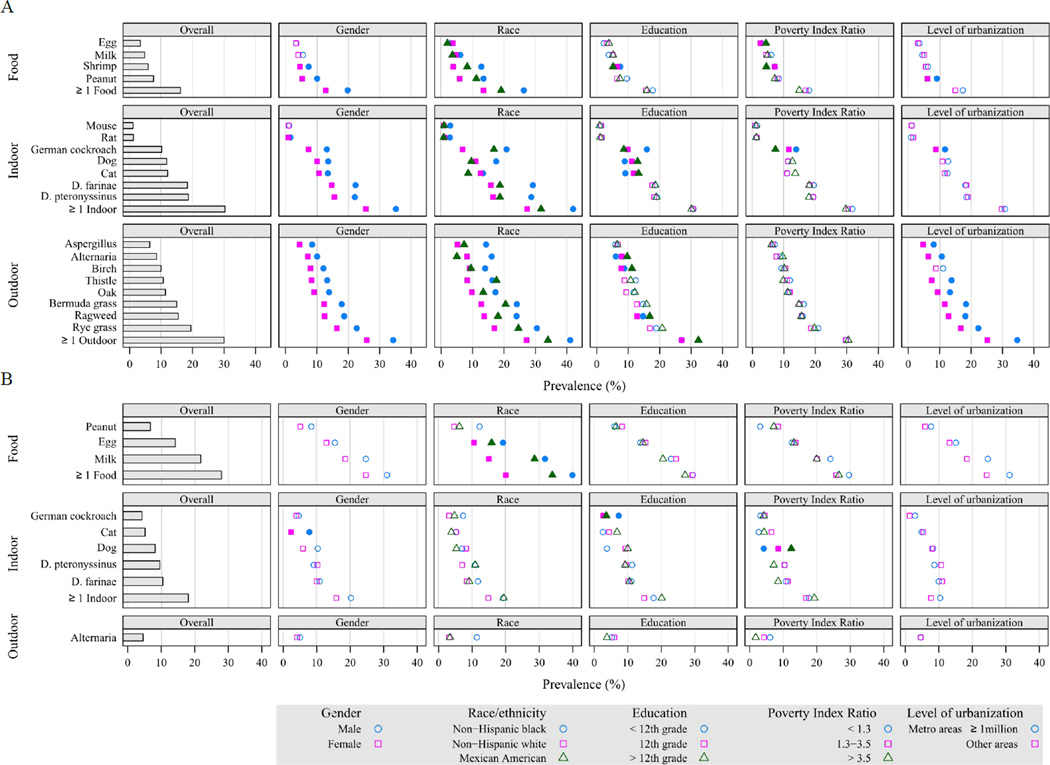
Overall, the prevalence of allergic sensitization was higher in males than in females (Fig 4), but the difference was not always present at each age category (Fig E1 Online Repository). Among the youngest age group (1–5 year olds) greatest gender differences were seen for pet allergens, especially for cat.
Figure 4.
Prevalence of positive serum IgE tests by demographic characteristics in the US population (A: Subjects aged 6 years and older; B: Subjects aged 1–5 years). Solid symbols represent statistically significant differences, whereas prevalences that are not statistically different are marked with open symbols.
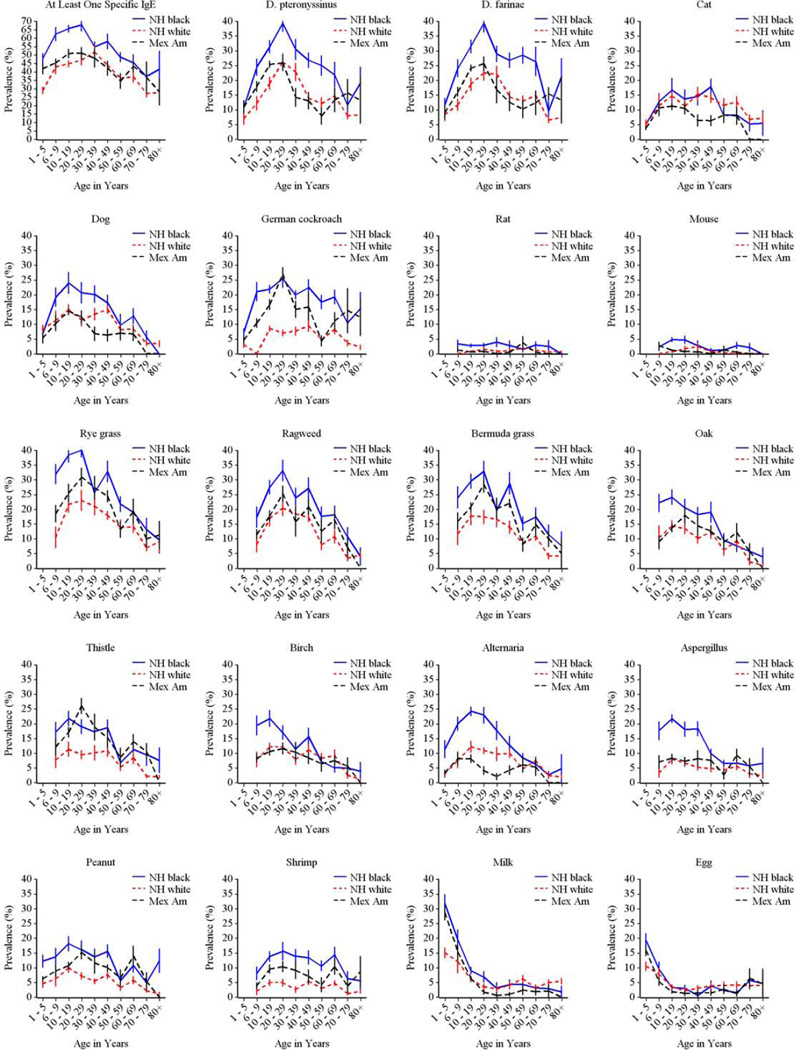
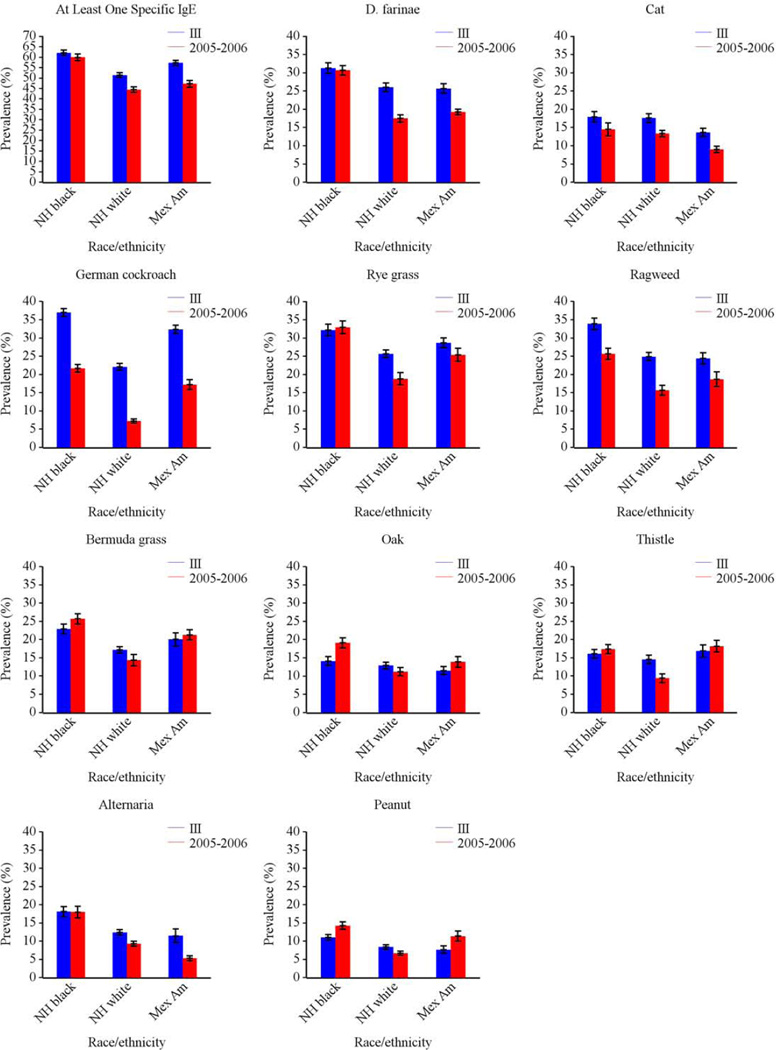
The prevalence of allergic sensitization to all types of allergens varied significantly by race-ethnicity (Fig 4). Among those 6 and older, non-Hispanic blacks had the highest prevalence of sensitization to all tested allergens, except for Russian thistle and egg. Among 1–5 year olds, allergic sensitization tended to be less prevalent in non-Hispanic whites than in other race/ethnic groups, although differences did not always reach statistical significance for individual sIgEs. Figure E2 in the Online Repository illustrates race/ethnic variation by age.
Socioeconomic patterns of allergic sensitization were less consistent (Fig 4). However, sensitization to German cockroach and shrimp were associated with indicators of lower socioeconomic status (SES), whereas sensitization to dog and cat allergens was more prevalent among higher SES groups. Although sensitization to outdoor allergens was more prevalent in higher SES groups, most differences were not statistically significant.
Differences in allergic sensitization across levels of urbanization
Among those 6 and older, sensitization to allergens was more prevalent in metropolitan areas than in less urbanized areas (Fig 4). In central metropolitan areas (population ≥ 1 million), 50.0% of the population, was sensitized to at least one allergen, whereas in non-metropolitan areas the prevalence of sensitization was less than 40.0% (Table E1). The most consistent associations were observed for outdoor allergens; in large, central metropolitan areas, 37.8% was sensitized to outdoor allergens, while less than one-fourth (22.9–24.9%) of the non-metropolitan population was sensitized to outdoor allergens. Among 1–5 year olds, sensitization to all types of allergens was more prevalent in large metropolitan areas than other areas, but none of the differences were statistically significant (Table E3).
Differences in allergic sensitization across census regions
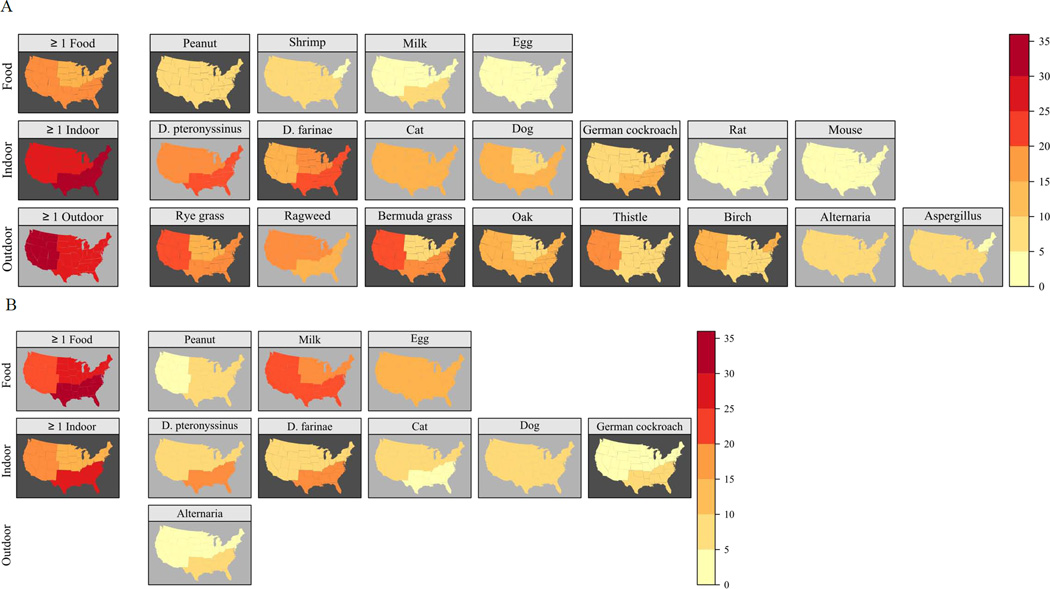
Although the overall prevalence of sensitization did not differ significantly by census region, there were regional differences for individual allergens and allergen types (Fig 5, Tables E1, E3). Sensitization to indoor allergens, was most prevalent in the South (34.5% among 6 and older, 26.5% among 1–5 year olds), in particular to dust mite and cockroach allergens. For most outdoor allergens, prevalence of sensitization was highest in the West (36.0%), especially for Russian thistle (17.9%) and grasses (21.4–25.0%). Among those 6 and older, sensitization to food allergens was most prevalent in the South. Of the food-specific IgEs, only peanut in the 6 and older group showed regional variation (Tables E1, E3).
Figure 5.
Prevalence of positive serum IgE tests by census region in the US population (A: Subjects aged 6 years and older; B: Subjects aged 1–5 years).
Concentrations of allergen-specific IgE
The GMs of the sIgE concentrations (kUa/L) ranged from 0.74 (egg) to 3.89 (rye grass) among persons with a positive test to the specific allergen (Tables E2 and E4). Levels of sIgEs tended to decrease with increasing age group, after peaking in childhood and early adulthood. The majority of the GMs did not differ significantly by gender. Among those 6 and older, non-Hispanic blacks did not always have the highest levels of sIgE, but the GMs of dust mite-, cockroach-, mold-, and shrimp-specific IgEs were significantly higher in non-Hispanic blacks than in other groups. Among 1–5 year olds, only cockroach-specific IgE levels were lower in non-Hispanic whites than in other groups. Across all age groups, lower SES was consistently associated with higher cockroach-specific IgE levels. While the level of urbanization was not associated with sIgE levels in early years of life, except for peanut, levels of several sIgEs (i.e., pet-, cockroach-, weed-, tree-, mold-, shrimp- and peanut- specific IgEs) in the older age groups varied significantly across urbanization levels. Variation across census regions was apparent for indoor- and outdoor- specific IgE concentrations, but not for food-specific IgE levels.
Predictors of allergic sensitization
Table I shows participant characteristics that were independently associated with 1 or more positive test responses (A subjects aged 6 and older; B 1–5 year old children). The odds of specific IgE positivity increased throughout childhood and early adulthood, and were consistently higher among males (except in early years of life), among non-Hispanic blacks, and among those who reported avoidance and/or removal of pets. Although the odds of specific IgE positivity were highest in the South in early childhood, no significant regional differences were found in older age groups. Age, gender, race/ethnicity and census region were also consistently associated with elevated sIgE levels among atopic individuals (data not shown).
TABLE I.
Prevalences and odds ratios for the independent predictors of specific IgE positivity in the NHANES 2005–2006 population: A. Subjects aged 6 years and older; B. Subjects aged 1–5 years
| Predictor | Prevalence of atopy* % (SE) |
Adjusted odds ratio† OR (95% CI) |
Wald F test P-value† |
|---|---|---|---|
| A. Subjects 6 and older | |||
| Age group | <0.001 | ||
| 6–9 | 46.7 (2.87) | 1.8 (1.1–2.9) | |
| 10–19 | 48.7 (1.48) | 2.1 (1.5–3.0) | |
| 20–29 | 52.1 (2.46) | 2.6 (1.8–3.7) | |
| 30–39 | 51.6 (2.96) | 2.5 (1.6–4.0) | |
| 40–49 | 45.3 (1.79) | 1.9 (1.4–2.6) | |
| 50–59 | 38.2 (2.37) | 1.5 (1.1–1.9) | |
| 60–69 | 39.4 (2.84) | 1.6 (1.1–2.3) | |
| 70–79 | 28.2 (2.27) | 0.9 (0.6–1.4) | |
| 80+ | 28.6 (3.29) | 1.0 (reference) | |
| Gender | <0.001 | ||
| Female | 39.8 (1.31) | 1.0 (reference) | |
| Male | 49.8 (1.40) | 1.6 (1.4–1.8) | |
| Race/ethnicity | <0.001 | ||
| Non-Hispanic White | 41.6 (1.25) | 1.0 (reference) | |
| Non-Hispanic Black | 57.4 (1.55) | 1.9 (1.5–2. 4) | |
| Mexican American | 46.5 (1.59) | 1.0 (0.8–1.3) | |
| Other | 49.8 (3.42) | 1.3 (1.0–1.7) | |
| Presence of cat(s) | 0.010 | ||
| No | 46.2 (1.01) | 1.0 (reference) | |
| Yes | 40.0 (2.39) | 0.8 (0.7–1.0) | |
| Presence of dog(s) | 0.049 | ||
| No | 44.3 (1.47) | 1.0 (reference) | |
| Yes | 45.2 (1.27) | 1.2 (1.0–1.4) | |
| Pet avoidance | <0.001 | ||
| No | 42.9 (1.23) | 1.0 (reference) | |
| Yes | 69.5 (3.24) | 3.2 (2.4–4.4) | |
| Serum cotinine (ng/ml) | <0.001 | ||
| 0.011 (< LOD) | 44.8 (2.85) | 1.0 (reference) | |
| 0.035–0.100 | 44.7 (1.58) | 0.9 (0.7–1.1) | |
| 0.100–10.00 | 47.0 (1.72) | 0.8 (0.6–1.1) | |
| 10.00–1156.0 | 42.5 (1.18) | 0.7 (0.6–0.9) | |
| B. Subjects aged 1–5 years | |||
| Race/ethnicity | <0.001 | ||
| Non-Hispanic White | 28.9 (2.00) | 1.0 (reference) | |
| Non-Hispanic Black | 47.9 (3.13) | 2.0 (1.6–2.6) | |
| Mexican American | 41.9 (3.21) | 1.9 (1.4–2.5) | |
| Other | 49.9 (5.49) | 2.7 (1.7–4.1) | |
| Census region | 0.008 | ||
| Midwest | 30.8 (2.38) | 1.0 (reference) | |
| Northeast | 32.5 (2.42) | 1.0 (0.7–1.4) | |
| South | 45.3 (4.08) | 1.6 (1.1–2.3) | |
| West | 32.0 (2.90) | 0.8 (0.6–1.1) | |
| Pet avoidance | 0.034 | ||
| No | 35.4 (1.53) | 1.0 (reference) | |
| Yes | 58.1 (9.92) | 2.6 (1.1–6.3) |
Atopy: among subjects 6 and older, having detectable levels (≥ 0.35 kUa/L) of specific IgE to any of the 19 allergens; among children 1–5 years old, having detectable levels of specific IgE to any of the 9 allergens tested in this age group
Adjusted for each variable in the tables A and B
Comparisons between NHANES 2005–2006 and NHANES III
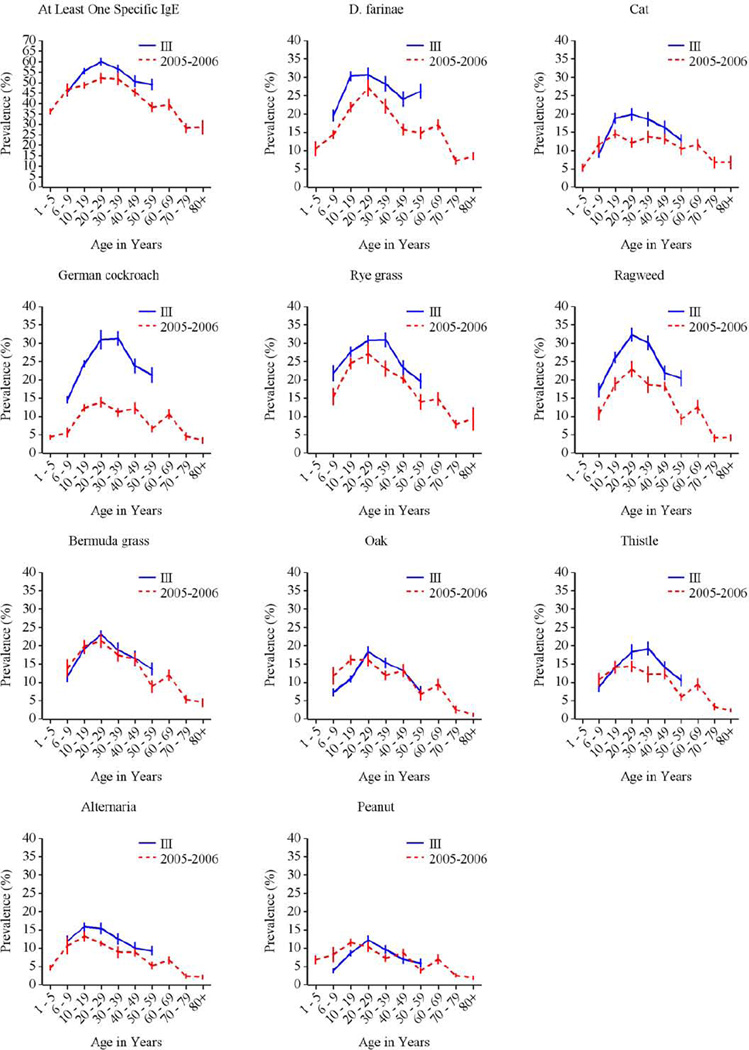
In NHANES 2005–2006, grass, dust mite, and ragweed allergens were the most common sensitizers among subjects aged ≥ 6 years, consistent with NHANES III.7 Figures E3–E5 in the Online Repository illustrate similar patterns of allergic sensitization by age, gender, and race/ethnicity in both surveys. In contrast, patterns of sensitization across census regions showed greater variability in NHANES 2005–2006; regional variation was observed for all types of allergens (Tables E1, E3) in NHANES 2005–2006, whereas only sensitization to outdoor allergens varied by census region in NHANES III.7 The overall prevalence of sensitization did not vary across census regions in NHANES 2005–2006 as it did in NHANES III.
DISCUSSION
The NHANES 2005–2006 provides the most detailed information on IgE-mediated sensitization in the US population, including quantitative information on extent of allergic sensitization. It is the first nationwide study to examine allergic sensitization from early years of life (children aged 1–5 years) to old age (aged ≥ 75 years). Almost half of the US population 6 and older and more than one third of children aged 1–5 had positive sIgE responses to at least one allergen. In NHANES 2005–2006, allergen-specific IgEs clustered into 7 biologically relevant groups. Across the US, sensitization to individual allergens and allergen types showed regional variation, whereas the overall prevalence of sensitization did not, except in early years of life. In multivariate models, age, gender, race/ethnicity, census region, and reported pet avoidance measures were consistently associated with IgE-mediated sensitization, although gender differences were less pronounced in early life.
The NHANES 2005–2006 data offered a unique opportunity to explore clustering of sIgEs in the general US population. Although IgE-mediated allergy is known to aggregate in clusters of allergens;15, 16 few population-based studies have examined clustering patterns. Structural similarity of allergenic epitopes, the major determinant of cross-reactivity,17 might be a key contributor to the clustering. However, sIgE patterns may also reflect individual’s propensity to co-exposure/sensitization that can occur without sequence homology and/or common epitopes (e.g., egg- and milk-sIgEs).17, 18 As expected, highest correlations were observed for dust mite-, grass- and tree-specific allergens, which share groups of cross-reactive allergens.17 The clustering of cockroach and shrimp-specific IgEs may reflect indirect sensitization to a cross-reactive allergen, tropomyosin. In a recent study, the correlation between cockroach- and shrimp-specific allergens among inner-city children was associated with residential exposure to cockroach allergen.19 Although peanut is traditionally considered a food allergen, it was not surprising that peanut-specific IgE grouped together with plant-specific IgEs, because peanut allergens show extensive IgE cross-reactivity between homologous pollen allergens.20, 21 Studies have shown that peanut-sensitized individuals are often also sensitized to pollens.21, 22 Consistent with the previous reports,21, 22 sensitization to plant-related allergens was highly prevalent among peanut-sensitized NHANES 2005–2006 participants. The vast majority of those with positive test response to peanut were sensitized to grass- (88.7%), tree- (88.6%) or weed-specific (90.6%) allergens (data not shown). However, a large proportion of serological cross-reactivity may not be clinically relevant. For example, a recent study showed that children sensitized to both peanut and birch were less likely to report symptoms to peanut than those who were sensitized to peanut, but not to birch pollen.21
In NHANES 2005–2006, the patterns of sensitization across sociodemographic factors were similar to previous NHANES reports.7, 8 IgE-mediated sensitization was strongly associated with age. The prevalence and levels of inhalant allergen-specific IgEs peaked in childhood and early adulthood, whereas sensitization to foods (i.e., milk and egg) was most prevalent prior to age 6.13 The declining trends in the prevalence of sensitization and sIgE levels in older age groups may reflect changes in the immune system that accompany aging. Studies have demonstrated age-associated alterations in many aspects of immune function (e.g., T- and B-cell functions), although immunosenescence may vary by the atopic phenotype.23, 24
Gender differences in prevalence are common in atopic disorders.25 Although gender-specific differences in immune responses emerge in early childhood, the clinical expression and diagnostic markers of atopic disease are influenced by genetic, hormonal, and environmental factors throughout life.26, 27 In NHANES 2005–2006, males were more likely to have positive sIgE tests as well as elevated levels of sIgEs than females, except among 1–5 year olds. Some studies have suggested that differences in the production of IgE may be associated with gender-related genetic differences in IgE control.28
The NHANES 2005–2006 data demonstrated racial/ethnic differences from infancy. Among 1–5 year olds, sensitization to allergens - particularly, sensitization to food allergens that often precedes the progression of allergic diseases29 - was significantly lower in non-Hispanic whites than other race/ethnic groups. Among those 6 and older, non-Hispanic blacks were most likely to have positive test responses and to have elevated levels of sIgEs. Although several studies have reported racial and ethnic disparities in prevalence of allergic sensitization, there is limited information on how genetic, socioeconomic, cultural, environmental or other factors contribute to the observed disparities.30 A recent study suggested that the racial disparity might primarily result from environmental rather than genetic factors.31
Although many large epidemiological studies have reported substantial geographical variation in the prevalence of sensitization,7, 32, 33 the overall prevalence of allergic sensitization did not vary regionally in NHANES 2005–2006, except in early life. In population-based studies, atopy is often assessed using test panels limited to inhalant allergens,32, 33 whereas in NHANES 2005–2006, the panel consisted of a variety of indoor, outdoor and food allergens. The use of a larger test panel may have influenced the sensitivity of the assessment of allergic sensitization. Even though the majority of the outdoor allergens showed significant regional variability in sensitization patterns, the panel included several allergens (e.g., pets, rodents, ragweed, molds, and most foods) that did not show variation by region. In NHANES 2005–2006, chances of capturing mono-sensitized individuals may have been increased because egg and milk were the most common sensitizers among mono-sensitized participants (data not shown). In contrast, in NHANES III, the regional variation in the overall prevalence of sensitization may have reflected higher sensitization rates to outdoor allergens in the Western US. The majority of the tested allergens in NHANES III were outdoor allergens, of which many had significantly higher sensitization rates in the West (e.g., grasses, Russian thistle). The overall prevalence of sensitization, however, may vary geographically in early life. Among 1–5 year old NHANES 2005–2006 participants, those living in the South were most likely to have positive sIgE responses. Differences in indoor allergen sensitization rates may contribute to the regional variation in this age group, because sensitization to dust mite and cockroach allergens was significantly higher in the South compared to the other census regions. Although regional differences were also observed in sIgE levels, caution is warranted when interpreting the results of the youngest age group because of highly variable sIgE concentrations and a small sample size. Among atopic individuals aged 6 years and older, grass-specific IgEs reached particularly high levels in the West.
Pet avoidance, reported avoidance and/or removal of pets from home because of allergies or asthma, was strongly associated with positive sIgE responses and elevated levels of specific IgEs. Although the relationship between the development of atopic disorders and exposure to pets and pet allergens remains controversial,34–36 pet allergens are triggers for many atopic individuals and can influence disease severity among sensitized patients.37–39 Individuals or families with allergies often avoid owning pets, either because pets trigger symptoms or as a precaution. Studies report that higher parental awareness of risk factors for allergic disease can influence the likelihood of pet avoidance.40 Because this study is cross-sectional, participants may have modified their behavior due to their atopic status. Thus, the interpretation of pet related associations is complicated. Although associations are adjusted for pet avoidance measures, the data may not have captured avoidance measures throughout life. The inverse association between sensitization and the presence of cat(s) may be partially explained by reverse causation; sensitization precedes and causes the absence of cats. Atopic individuals might have been more likely to remove cats than dogs from home. In NHANES 2005–2006, only 34.0% of those who removed a cat from home in the past 12 months were sensitized to cat allergen, whereas almost half (48.4%) of those who removed a dog were sensitized to dog allergen (data not shown). Studies suggest that selective avoidance is often more common to cats than dogs.40, 41
Although several studies have reported an inverse association between smoking and atopy, 7, 32, 42 the association of smoking on allergic sensitization has been inconsistent in the literature.43 The inverse association may either reflect selective avoidance of smoking or immuno-suppressive effects of tobacco smoke. 42, 44 Some studies report that those with asthma and allergies in childhood are less likely to initiate smoking than their healthy peers.44
Allergic sensitization was more prevalent in large, central metropolitan areas compared to other areas. Supporting the existing literature,8, 45 differences were most consistent for outdoor allergens. Level of urbanization was not an independent predictor in the logistic regression models, perhaps due to lesser variation of other types of sIgEs. Microclimatic differences associated with urbanization, most notably a CO2 concentration and temperature increase, have been associated with faster growth, earlier flowering, and greater aboveground biomass and pollen production of plants (e.g., ragweed) in urban areas compared to rural locations.46 Numerous studies report that plant-related aeroallergen exposures are influenced by increasing CO2 concentrations, climate change, or both, leading to longer pollen seasons, greater pollen loads, and changes in allergenicity and spatial distributions of allergens.47, 48 Data also demonstrate complex interactions between urban air pollution, aeroallergens, and allergic diseases; air pollution may not only contribute to the etiology of some atopic disorders but may also modify the effect of aeroallergens on atopic diseases.49, 50 Recent nationally representative studies report that respiratory allergies are positively associated with air pollution in the US.51, 52 It is also possible that differences across levels of urbanization reflect other environmental effects; many studies have reported protective effects of growing up in a farming environment from the subsequent development of atopic disorders.53, 54
The cross-sectional design of NHANES 2005–2006 precludes the assessment of temporal relationships. Further, the presence of allergen-specific IgE antibodies does not necessarily correspond to clinical allergy (i.e., symptoms), but multiple studies have demonstrated that the likelihood of clinical allergy correlates with the results from allergy testing.55–57 The methodological differences between NHANES 2005–2006 and previous NHANES studies make it difficult to compare population-based prevalence of allergic sensitization over time. Because the performance characteristics of serum-specific IgE and skin prick tests vary,58, 59 results from these two tests are not interchangeable. For example, cockroach has substantially lower sensitivity when performance characteristics of ImmunoCAP are compared to skin prick tests.58 Although the sensitivity of the assay has improved over the past decade, we were not able to evaluate sensitization below the cut-off of 0.35 kUa/L, which may be suboptimal.60 Due to missing sIgE data, the small sample size of the youngest participants likely compromised statistical power in subgroup analyses. Despite these limitations, NHANES 2005–2006 extends the knowledge on allergic sensitization in the US population; none of the previous surveys have examined quantitative sensitization patterns and used this many allergens across participants from infancy to old age.
In summary, a large portion of the US population is sensitized to indoor, outdoor and food allergens. Sensitization showed clustering patterns that might have largely reflected biological cross-reactivity. Although the overall prevalence of sensitization did not vary across census regions, except in early life, the NHANES 2005–2006 data demonstrated regional differences in the prevalence of sensitization to individual allergens and allergen types. Positive sIgE responses and elevated levels of sIgEs were most consistently associated with age, gender, race/ethnicity, census region, and reported pet avoidance measures. The NHANES 2005–2006 provides valuable information on IgE-mediated sensitization patterns in the US population, highlighting the sociodemographic and regional variability of allergic sensitization.
Supplementary Material
ACKNOWLEDGEMENTS
We acknowledge the analysts Stephanie Robinson and Ajay Yesupriya at the National Center for Health Statistics (NCHS) Atlanta Research Data Center (RDC) for their assistance with conduct of the data analysis. We also thank Drs. Charles Dillon and David Lacher at the National Center for Health Statistics (NCHS) in Hyattsville for their support and helpful comments during the manuscript preparation.
The findings and conclusions in this paper are those of the author(s) and do not necessarily represent the views of the Research Data Center, the National Center for Health Statistics, or the Centers for Disease Control and Prevention.
This research was supported in part by the Intramural Research Program of the NIH, National Institute of Environmental Health Sciences.
Abbreviations used
- IgE
immunoglobulin E
- NCHS
National Center for Health Statistics
- NHANES
National Health and Nutrition Examination Survey
- sIgE
serum specific immunoglobulin E
- LLOD
lower limit of detection
- ULOD
upper limit of detection
Footnotes
Publisher's Disclaimer: This is a PDF file of an unedited manuscript that has been accepted for publication. As a service to our customers we are providing this early version of the manuscript. The manuscript will undergo copyediting, typesetting, and review of the resulting proof before it is published in its final citable form. Please note that during the production process errors may be discovered which could affect the content, and all legal disclaimers that apply to the journal pertain.
REFERENCES
- 1.World Allergy Organization (WAO) Milwaukee, WI: World Allergy Organization; 2011. [Cited 2012 Mar 11]. White Book on Allergy. Available from http://www.worldallergy.org/UserFiles/file/WAO-White-Book-on-Allergy_web.pdf. [Google Scholar]
- 2.Meltzer EO, Blaiss MS, Derebery MJ, Mahr TA, Gordon BR, Sheth KK, et al. Burden of allergic rhinitis: results from the Pediatric Allergies in America survey. The Journal of allergy and clinical immunology. 2009;124:S43–S70. doi: 10.1016/j.jaci.2009.05.013. [DOI] [PubMed] [Google Scholar]
- 3.Ebert CS, Jr, Pillsbury HC., 3rd Epidemiology of allergy. Otolaryngologic clinics of North America. 2011;44:537–548. doi: 10.1016/j.otc.2011.03.001. vii. [DOI] [PubMed] [Google Scholar]
- 4.Hamilton RG. Clinical laboratory assessment of immediate-type hypersensitivity. The Journal of allergy and clinical immunology. 2010;125:S284–S296. doi: 10.1016/j.jaci.2009.09.055. [DOI] [PubMed] [Google Scholar]
- 5.Salo PM, Calatroni A, Gergen PJ, Hoppin JA, Sever ML, Jaramillo R, et al. Allergy-related outcomes in relation to serum IgE: results from the National Health and Nutrition Examination Survey 2005–2006. The Journal of allergy and clinical immunology. 2011;127:1226–1235. e7. doi: 10.1016/j.jaci.2010.12.1106. [DOI] [PMC free article] [PubMed] [Google Scholar]
- 6.Gergen PJ, Turkeltaub PC. The association of individual allergen reactivity with respiratory disease in a national sample: data from the second National Health and Nutrition Examination Survey, 1976–80 (NHANES II) The Journal of allergy and clinical immunology. 1992;90:579–588. doi: 10.1016/0091-6749(92)90130-t. [DOI] [PubMed] [Google Scholar]
- 7.Arbes SJ, Jr, Gergen PJ, Elliott L, Zeldin DC. Prevalences of positive skin test responses to 10 common allergens in the US population: results from the third National Health and Nutrition Examination Survey. The Journal of allergy and clinical immunology. 2005;116:377–383. doi: 10.1016/j.jaci.2005.05.017. [DOI] [PubMed] [Google Scholar]
- 8.Gergen PJ, Turkeltaub PC, Kovar MG. The prevalence of allergic skin test reactivity to eight common aeroallergens in the U.S. population: results from the second National Health and Nutrition Examination Survey. The Journal of allergy and clinical immunology. 1987;80:669–679. doi: 10.1016/0091-6749(87)90286-7. [DOI] [PubMed] [Google Scholar]
- 9.Hyattsville, MD: National Center for Health Statistics; 2012. [Cited 2013 Mar 1]. NCHS Research Ethics Review Board (ERB) Approval. Available from http://www.cdc.gov/nchs/nhanes/irba98.htm.]. [Google Scholar]
- 10.Hyattsville, MD: National Center for Health Statistics; 2005. [Cited 2013 Mar 1]. Public data general release file documentation. Available from http://www.cdc.gov/nchs/data/nhanes/nhanes_05_06/general_data_release_doc_05_06.pdf. [Google Scholar]
- 11.Laboratory Procedures Manual. Elmhurst, IL: 2008. [Cited 2013 September 12]. Available from http://www.cdc.gov/nchs/data/nhanes/nhanes_05_06/al_ige_d_met_specific_ige_total_ige.pdf. [Google Scholar]
- 12.Allergen Specific IgE(s) and Total IgE in Serum (AL_IGE_D) Hyattsville, MD: 2009. [Cited 2013 September 12]. Available from http://www.cdc.gov/nchs/nhanes/nhanes2005-2006/AL_IGE_D.htm. [Google Scholar]
- 13.Liu AH, Jaramillo R, Sicherer SH, Wood RA, Bock SA, Burks AW, et al. National prevalence and risk factors for food allergy and relationship to asthma: results from the National Health and Nutrition Examination Survey 2005–2006. The Journal of allergy and clinical immunology. 2010;126:798–806. e13. doi: 10.1016/j.jaci.2010.07.026. [DOI] [PMC free article] [PubMed] [Google Scholar]
- 14.Calatroni A, Arbes SJ, Jr, Gergen PJ, Mitchell HE, Zeldin DC. Classification of 19 allergen-specific IgE antibodies tested in NHANES 2005–2006. J Allergy Clin Immunol. 2009;123:S193. [Google Scholar]
- 15.Soeria-Atmadja D, Onell A, Kober A, Matsson P, Gustafsson MG, Hammerling U. Multivariate statistical analysis of large-scale IgE antibody measurements reveals allergen extract relationships in sensitized individuals. The Journal of allergy and clinical immunology. 2007;120:1433–1440. doi: 10.1016/j.jaci.2007.07.021. [DOI] [PubMed] [Google Scholar]
- 16.Scala E, Alessandri C, Bernardi ML, Ferrara R, Palazzo P, Pomponi D, et al. Cross-sectional survey on immunoglobulin E reactivity in 23,077 subjects using an allergenic molecule-based microarray detection system. Clin Exp Allergy. 2010;40:911–921. doi: 10.1111/j.1365-2222.2010.03470.x. [DOI] [PubMed] [Google Scholar]
- 17.Ferreira F, Hawranek T, Gruber P, Wopfner N, Mari A. Allergic cross-reactivity: from gene to the clinic. Allergy. 2004;59:243–267. doi: 10.1046/j.1398-9995.2003.00407.x. [DOI] [PubMed] [Google Scholar]
- 18.Radauer C, Bublin M, Wagner S, Mari A, Breiteneder H. Allergens are distributed into few protein families and possess a restricted number of biochemical functions. The Journal of allergy and clinical immunology. 2008;121:847–852. e7. doi: 10.1016/j.jaci.2008.01.025. [DOI] [PubMed] [Google Scholar]
- 19.Wang J, Calatroni A, Visness CM, Sampson HA. Correlation of specific IgE to shrimp with cockroach and dust mite exposure and sensitization in an inner-city population. The Journal of allergy and clinical immunology. 2011;128:834–837. doi: 10.1016/j.jaci.2011.07.045. [DOI] [PMC free article] [PubMed] [Google Scholar]
- 20.Cabanos C, Tandang-Silvas MR, Odijk V, Brostedt P, Tanaka A, Utsumi S, et al. Expression, purification, cross-reactivity and homology modeling of peanut profilin. Protein Expr Purif. 2010;73:36–45. doi: 10.1016/j.pep.2010.03.005. [DOI] [PubMed] [Google Scholar]
- 21.Asarnoj A, Ostblom E, Ahlstedt S, Hedlin G, Lilja G, van Hage M, et al. Reported symptoms to peanut between 4 and 8 years among children sensitized to peanut and birch pollen - results from the BAMSE birth cohort. Allergy. 2010;65:213–219. doi: 10.1111/j.1398-9995.2009.02138.x. [DOI] [PubMed] [Google Scholar]
- 22.Niggemann B, Schmitz R, Schlaud M. The high prevalence of peanut sensitization in childhood is due to cross-reactivity to pollen. Allergy. 2011;66:980–981. doi: 10.1111/j.1398-9995.2011.02561.x. [DOI] [PubMed] [Google Scholar]
- 23.Meyer KC. Aging. Proc Am Thorac Soc. 2005;2:433–439. doi: 10.1513/pats.200508-081JS. [DOI] [PubMed] [Google Scholar]
- 24.Mediaty A, Neuber K. Total and specific serum IgE decreases with age in patients with allergic rhinitis, asthma and insect allergy but not in patients with atopic dermatitis. Immun Ageing. 2005;2:9. doi: 10.1186/1742-4933-2-9. [DOI] [PMC free article] [PubMed] [Google Scholar]
- 25.Chen W, Mempel M, Schober W, Behrendt H, Ring J. Gender difference, sex hormones, and immediate type hypersensitivity reactions. Allergy. 2008;63:1418–1427. doi: 10.1111/j.1398-9995.2008.01880.x. [DOI] [PubMed] [Google Scholar]
- 26.Uekert SJ, Akan G, Evans MD, Li Z, Roberg K, Tisler C, et al. Sex-related differences in immune development and the expression of atopy in early childhood. The Journal of allergy and clinical immunology. 2006;118:1375–1381. doi: 10.1016/j.jaci.2006.09.008. [DOI] [PubMed] [Google Scholar]
- 27.Bottema RW, Reijmerink NE, Koppelman GH, Kerkhof M, Postma DS. Phenotype definition, age, gender in the genetics of asthma and atopy. Immunol Allergy Clin North Am. 2005;25:621–639. doi: 10.1016/j.iac.2005.07.002. [DOI] [PubMed] [Google Scholar]
- 28.Johnson CC, Peterson EL, Ownby DR. Gender differences in total and allergen-specific immunoglobulin E (IgE) concentrations in a population-based cohort from birth to age four years. Am J Epidemiol. 1998;147:1145–1152. doi: 10.1093/oxfordjournals.aje.a009413. [DOI] [PubMed] [Google Scholar]
- 29.Gordon BR. The allergic march: can we prevent allergies and asthma? Otolaryngologic clinics of North America. 2011;44:765–777. doi: 10.1016/j.otc.2011.03.006. xi. [DOI] [PubMed] [Google Scholar]
- 30.Wegienka G, Johnson CC, Zoratti E, Havstad S. Racial differences in allergic sensitization: recent findings and future directions. Curr Allergy Asthma Rep. 2013;13:255–261. doi: 10.1007/s11882-013-0343-2. [DOI] [PMC free article] [PubMed] [Google Scholar]
- 31.Yang JJ, Burchard EG, Choudhry S, Johnson CC, Ownby DR, Favro D, et al. Differences in allergic sensitization by self-reported race and genetic ancestry. The Journal of allergy and clinical immunology. 2008;122:820–827. e9. doi: 10.1016/j.jaci.2008.07.044. [DOI] [PMC free article] [PubMed] [Google Scholar]
- 32.Chan-Yeung M, Anthonisen NR, Becklake MR, Bowie D, Sonia Buist A, Dimich-Ward H, et al. Geographical variations in the prevalence of atopic sensitization in six study sites across Canada. Allergy. 2010;65:1404–1413. doi: 10.1111/j.1398-9995.2010.02399.x. [DOI] [PubMed] [Google Scholar]
- 33.Bousquet PJ, Chinn S, Janson C, Kogevinas M, Burney P, Jarvis D. Geographical variation in the prevalence of positive skin tests to environmental aeroallergens in the European Community Respiratory Health Survey I. Allergy. 2007;62:301–309. doi: 10.1111/j.1398-9995.2006.01293.x. [DOI] [PubMed] [Google Scholar]
- 34.Wegienka G, Johnson CC, Havstad S, Ownby DR, Zoratti EM. Indoor pet exposure and the outcomes of total IgE and sensitization at age 18 years. The Journal of allergy and clinical immunology. 2010;126:274–279. 9 e1–9 e5. doi: 10.1016/j.jaci.2010.05.001. [DOI] [PMC free article] [PubMed] [Google Scholar]
- 35.Lodrup Carlsen KC, Roll S, Carlsen KH, Mowinckel P, Wijga AH, Brunekreef B, et al. Does pet ownership in infancy lead to asthma or allergy at school age? Pooled analysis of individual participant data from 11 European birth cohorts. PLoS One. 2012;7:e43214. doi: 10.1371/journal.pone.0043214. [DOI] [PMC free article] [PubMed] [Google Scholar]
- 36.Chen CM, Tischer C, Schnappinger M, Heinrich J. The role of cats and dogs in asthma and allergy--a systematic review. Int J Hyg Environ Health. 2010;213:1–31. doi: 10.1016/j.ijheh.2009.12.003. [DOI] [PubMed] [Google Scholar]
- 37.Lewis SA, Weiss ST, Platts-Mills TA, Burge H, Gold DR. The role of indoor allergen sensitization and exposure in causing morbidity in women with asthma. Am J Respir Crit Care Med. 2002;165:961–966. doi: 10.1164/ajrccm.165.7.2103044. [DOI] [PubMed] [Google Scholar]
- 38.Langley SJ, Goldthorpe S, Craven M, Morris J, Woodcock A, Custovic A. Exposure and sensitization to indoor allergens: association with lung function, bronchial reactivity, and exhaled nitric oxide measures in asthma. The Journal of allergy and clinical immunology. 2003;112:362–368. doi: 10.1067/mai.2003.1654. [DOI] [PubMed] [Google Scholar]
- 39.Chapman MD, Wood RA. The role and remediation of animal allergens in allergic diseases. The Journal of allergy and clinical immunology. 2001;107:S414–S421. doi: 10.1067/mai.2001.113672. [DOI] [PubMed] [Google Scholar]
- 40.Bertelsen RJ, Carlsen KC, Granum B, Carlsen KH, Haland G, Devulapalli CS, et al. Do allergic families avoid keeping furry pets? Indoor Air. 2010;20:187–195. doi: 10.1111/j.1600-0668.2009.00640.x. [DOI] [PubMed] [Google Scholar]
- 41.Svanes C, Zock JP, Anto J, Dharmage S, Norback D, Wjst M, et al. Do asthma and allergy influence subsequent pet keeping? An analysis of childhood and adulthood. The Journal of allergy and clinical immunology. 2006;118:691–698. doi: 10.1016/j.jaci.2006.06.017. [DOI] [PubMed] [Google Scholar]
- 42.Hancox RJ, Welch D, Poulton R, Taylor DR, McLachlan CR, Greene JM, et al. Cigarette smoking and allergic sensitization: a 32-year population-based cohort study. The Journal of allergy and clinical immunology. 2008;121:38–42. e3. doi: 10.1016/j.jaci.2007.09.052. [DOI] [PubMed] [Google Scholar]
- 43.Havstad SL, Johnson CC, Zoratti EM, Ezell JM, Woodcroft K, Ownby DR, et al. Tobacco smoke exposure and allergic sensitization in children: a propensity score analysis. Respirology. 2012;17:1068–1072. doi: 10.1111/j.1440-1843.2012.02201.x. [DOI] [PMC free article] [PubMed] [Google Scholar]
- 44.Accordini S, Janson C, Svanes C, Jarvis D. The role of smoking in allergy and asthma: lessons from the ECRHS. Curr Allergy Asthma Rep. 2012;12:185–191. doi: 10.1007/s11882-012-0260-9. [DOI] [PubMed] [Google Scholar]
- 45.D'Amato G, Cecchi L, D'Amato M, Liccardi G. Urban air pollution and climate change as environmental risk factors of respiratory allergy: an update. J Investig Allergol Clin Immunol. 2010;20:95–102. quiz following. [PubMed] [Google Scholar]
- 46.Shea KM, Truckner RT, Weber RW, Peden DB. Climate change and allergic disease. The Journal of allergy and clinical immunology. 2008;122:443–453. doi: 10.1016/j.jaci.2008.06.032. quiz 54–5. [DOI] [PubMed] [Google Scholar]
- 47.Ziska LH, Beggs PJ. Anthropogenic climate change and allergen exposure: The role of plant biology. The Journal of allergy and clinical immunology. 2012;129:27–32. doi: 10.1016/j.jaci.2011.10.032. [DOI] [PubMed] [Google Scholar]
- 48.Reid CE, Gamble JL. Aeroallergens, allergic disease, and climate change: impacts and adaptation. Ecohealth. 2009;6:458–470. doi: 10.1007/s10393-009-0261-x. [DOI] [PMC free article] [PubMed] [Google Scholar]
- 49.D'Amato G. Effects of climatic changes and urban air pollution on the rising trends of respiratory allergy and asthma. Multidiscip Respir Med. 2011;6:28–37. doi: 10.1186/2049-6958-6-1-28. [DOI] [PMC free article] [PubMed] [Google Scholar]
- 50.D'Amato G, Liccardi G, D'Amato M, Cazzola M. Outdoor air pollution, climatic changes and allergic bronchial asthma. Eur Respir J. 2002;20:763–776. doi: 10.1183/09031936.02.00401402. [DOI] [PubMed] [Google Scholar]
- 51.Parker JD, Akinbami LJ, Woodruff TJ. Air pollution and childhood respiratory allergies in the United States. Environ Health Perspect. 2009;117:140–147. doi: 10.1289/ehp.11497. [DOI] [PMC free article] [PubMed] [Google Scholar]
- 52.Weir CH, Yeatts KB, Sarnat JA, Vizuete W, Salo PM, Jaramillo R, et al. Nitrogen Dioxide and Allergic Sensitization in the 2005–2006 National Health and Nutrition Examination. Survey Respir Med. 2013;107:1763–1772. doi: 10.1016/j.rmed.2013.08.010. [DOI] [PMC free article] [PubMed] [Google Scholar]
- 53.Poole JA. Farming-associated environmental exposures and effect on atopic diseases. Ann Allergy Asthma Immunol. 2012;109:93–98. doi: 10.1016/j.anai.2011.12.014. [DOI] [PMC free article] [PubMed] [Google Scholar]
- 54.Bufford JD, Gern JE. The hygiene hypothesis revisited. Immunol Allergy Clin North Am. 2005;25:247–262. v–vi. doi: 10.1016/j.iac.2005.03.005. [DOI] [PubMed] [Google Scholar]
- 55.Soderstrom L, Kober A, Ahlstedt S, de Groot H, Lange CE, Paganelli R, et al. A further evaluation of the clinical use of specific IgE antibody testing in allergic diseases. Allergy. 2003;58:921–928. doi: 10.1034/j.1398-9995.2003.00227.x. [DOI] [PubMed] [Google Scholar]
- 56.Cox L, Williams B, Sicherer S, Oppenheimer J, Sher L, Hamilton R, et al. Pearls and pitfalls of allergy diagnostic testing: report from the American College of Allergy, Asthma and Immunology/American Academy of Allergy, Asthma and Immunology Specific IgE Test Task Force. Ann Allergy Asthma Immunol. 2008;101:580–592. [PubMed] [Google Scholar]
- 57.Cox L. Overview of serological-specific IgE antibody testing in children. Curr Allergy Asthma Rep. 2011;11:447–453. doi: 10.1007/s11882-011-0226-3. [DOI] [PubMed] [Google Scholar]
- 58.Calabria CW, Dietrich J, Hagan L. Comparison of serum-specific IgE (ImmunoCAP) and skin-prick test results for 53 inhalant allergens in patients with chronic rhinitis. Allergy and asthma proceedings : the official journal of regional and state allergy societies. 2009;30:386–396. doi: 10.2500/aap.2009.30.3258. [DOI] [PubMed] [Google Scholar]
- 59.Bousquet PJ, Castelli C, Daures JP, Heinrich J, Hooper R, Sunyer J, et al. Assessment of allergen sensitization in a general population-based survey (European Community Respiratory Health Survey I) Ann Epidemiol. 2010;20:797–803. doi: 10.1016/j.annepidem.2010.05.012. [DOI] [PubMed] [Google Scholar]
- 60.Linden CC, Misiak RT, Wegienka G, Havstad S, Ownby DR, Johnson CC, et al. Analysis of allergen specific IgE cut points to cat and dog in the Childhood Allergy Study. Ann Allergy Asthma Immunol. 2011;106:153–158. e2. doi: 10.1016/j.anai.2010.11.004. [DOI] [PMC free article] [PubMed] [Google Scholar]
Associated Data
This section collects any data citations, data availability statements, or supplementary materials included in this article.


