

Abstract
Reliable sensory-motor integration is a pre-requisite for optimal movement control; the functionality of this integration changes during development. Previous research has shown that motor performance of school-age children is characterized by higher variability, particularly under conditions where vision is not available, and movement planning and control is largely based on kinesthetic input. The purpose of the current study was to determine the characteristics of how kinesthetic-motor internal representations interact with visuo-motor representations during development. To this end, we induced a visuo-motor adaptation in 59 children, ranging from 5 to 12 years of age, as well as in a group of adults, and measured initial directional error (IDE) and endpoint error (EPE) during a subsequent condition where visual feedback was not available, and participants had to rely on kinesthetic input. Our results show that older children (age range 9–12 years) de-adapted significantly more than younger children (age range 5–8 years) over the course of 36 trials in the absence of vision, suggesting that the kinesthetic-motor internal representation in the older children was utilized more efficiently to guide hand movements, and was comparable to the performance of the adults.
Keywords: Motor adaptation, kinesthesia, proprioception, internal models, motor development, feedback
1. Introduction
To perform goal-directed arm movements, the central nervous system needs to integrate information about target location and arm/hand location in order to compute motor commands that drive the limb to the desired goal. It is widely accepted that movements are encoded in vectorial space (Buneo, Jarvis, Batista, & Andersen, 2002; Georgopoulos, Schwartz, & Kettner, 1986; Pouget, Ducom, Torri, & Bavelier, 2002), based on a gaze-centered coordinate frame, mapping visual space onto motor space. These representations are likely multisensory in nature, with coordinate frames sharing visual, kinesthetic, and auditory modalities (Fiehler, Rösler, & Henriques, 2010; Henriques, Klier, Smith, Lowy, & Crawford, 1998; Kagerer & Contreras-Vidal, 2009; Pouget et al., 2002). Planning and execution of limb movements usually involves visuo-kinesthetic information, such as coding of initial hand position, and of the evolving state of the effector. Previous research has proposed that both (hypothetical) visual and proprioceptive movement vectors are likely fused at their origin (Rossetti, Desmurget, & Prablanc, 1995; Yan, Thomas, Stelmach, & Thomas, 2000), providing us with an integrated and optimal estimate of where the end effector is in space (van Beers, Wolpert, & Haggard, 2002). At the same time, the two sensory inputs are weighted depending on task demands, such that in the absence of vision the system up-weights sensory input from kinesthesia in order to optimize movement control processes and enabling us to reach toward targets without vision of the effector (Fiehler et al., 2010; Henriques et al., 1998; Rossetti et al., 1995).
Previous research has examined sensorimotor integration in young to middle-aged adults where it is reasonable to assume that mechanisms pertaining to sensorimotor integration, and the resulting formation of internal models, are relatively stable. This is not true for children whose motor performance is generally less accurate and more variable than adults (Contreras-Vidal, Bo, Boudreau, & Clark, 2005; Yan et al., 2000), and improves as a function of age. This has been shown not only for visually guided drawing tasks (Contreras-Vidal et al., 2005; Ferrel-Chapus, Hay, Olivier, Bard, & Fleury, 2002), but also for force adaptation (Konczak, Jansen-Osmann, & Kalveram, 2003), or postural tasks in infants (Chen, Metcalfe, Jeka, & Clark, 2007). One possible explanation for this higher variability in children is that sensorimotor internal models in children are not yet as well tuned as they are in adults; this might be due to increased noise in the sensory and motor systems, or to increased noise in the integration process itself, or to a combination of these factors. The first option, that internal models can be expected to become less accurate when the unimodal input itself is not well defined, is supported by a recent study in 7–13 year old children, testing the accuracy of the unimodal estimates of vision and proprioception. Using a localization task, the study showed that proprioceptive-based estimates become increasingly more reliable in older children (King, Pangelinan, Kagerer, & Clark, 2010; Pickett & Konczak, 2009); as a result, younger children up-weight visual information, whereas older children up-weight proprioceptive input when task demands require this. An earlier study in 5–11 year old children using a localization task in connection with a tendon vibration perturbation (Hay, Bard, Ferrel, Olivier, & Fleury, 2005) showed an interesting pattern of movement amplitude accuracy: constant amplitude errors showed a U-shaped function of age, with the highest accuracy at 5 and 11 years of age, and lower accuracy at 7 and 9 years. The authors attributed the lower spatial error in the young children to their successful use of feedforward control, and that of the older children to their increased integration of proprioceptive feedback processes, whereas the younger children were more dependent on visual feedback processes. Variability of the amplitude error showed a linear decrease with age, speaking to the generally higher noise in the developing motor system of young children.
Using a kinesthetically-guided center-out reaching task in 6–10 year old children, Contreras-Vidal showed that the 6-year-olds performed with larger endpoint errors when they had to rely on kinesthetic feedback than the 10-year-old children, suggesting a less well defined kinesthetic-motor internal representation in the younger than in the older children or the adults, affecting predominantly movement execution (Contreras-Vidal, 2006; van Beers et al., 2002). Overall, these findings indicate that the acuity of proprioceptive or kinesthetic estimates, and their integration with other modalities increases with age (Bo, Contreras-Vidal, Kagerer, & Clark, 2006; Smits-Engelsman & Duysens, 2008; Visser & Geuze, 2000). As stated earlier, internal representations are multisensory in nature, and appear to be shared between different modalities; this has been shown specifically for auditory-motor internal representations in adults (Kagerer & Contreras-Vidal, 2009; Zwiers, Van Opstal, & Paige, 2003) and in 9–11 year old children (King, Kagerer, Harring, Contreras-Vidal, & Clark, 2011). How kinesthetic-motor internal representations interact with visuo-motor representations, however, is not known.
The purpose of this study was to 1) expand on this issue of sensorimotor integration, and determine how an established kinesthetic-motor map would interact with a newly acquired visuo-motor map, and 2) how this cross-modal interaction was shaped through development. In order to address this, we tested a large sample of children across a developmental landscape from 5–12 years of age, the window in which processes of internal motor map formation and refinement appear to be active (Bo et al., 2006; Teasdale, Bard, Fleury, Young, & Proteau, 1993). By applying a visual feedback perturbation we required participants to update their established internal mapping between motor and visual signals. We used this perturbation to determine the effects of the subsequent adaptation on the kinesthetic-motor mapping. We hypothesized that when, in the post-adaptation phase, visual feedback was removed and participants had to rely predominantly on kinesthetic information, younger children would de-adapt slower, due to their inability to up-weight kinesthetic information enough to reverse the altered visuo-motor mapping.
2. Methods
2.1. Participants
Fifty-nine typically developing children between five and 12 years of age, as well as a group of nine 19 to 25 year old adults participated in the study (see Table 1 for details). Parents or guardians of the children provided informed consent prior to participation; additionally, the children gave assent. All participants were right-handed, as determined by their preferred hand used to complete everyday activities, and had normal or corrected vision. Previous to their participation in the experiment, all children were screened with the Movement Assessment Battery for Children (MABC) (Henderson & Sugden, 1992); a score at or above the 20th percentile was necessary for inclusion. The Institutional Review Board at the University of Maryland, College Park, approved the experimental procedures.
Table 1.
Participant demographics
| Age group [yrs] | n | Gender | Age range [yrs] | Mean age (SD) |
|---|---|---|---|---|
| 5–6 | 12 | 7 f, 5 m | 5.08–6.83 | 6.01 (0.60) |
| 7–8 | 17 | 9 f, 8 m | 7.08–8.58 | 7.89 (0.54) |
| 9–10 | 20 | 6 f, 14 m | 9.08–10.67 | 9.80 (0.52) |
| 11–12 | 12 | 4 f, 8 m | 11.0–12.83 | 11.80 (0.60) |
| Adults | 9 | 5 f, 4 m | 18.9–24.6 | 22.1 (1.63) |
2.2. Apparatus and Procedure
Participants were seated in front of table with a digitizing tablet (Wacom InTuos™) on it, covered by a wooden stand supporting a 15″ computer LCD screen placed horizontally on top of it. The experimental set-up was oriented such that the cursor position displayed on the computer screen was directly above the actual pen position on the digitizing tablet. This setup prevented vision of the hand during task performance. OASIS software 8.29 (Kikosoft, Nijmegen) was used for stimulus presentation and data acquisition. The time series of the x/y-position of the pen were sampled at 200 Hz.
The experiment used a center-out task, with two conditions: In the visuo-motor condition participants received visual feedback of the starting position and the targets on the screen display, as well as the pen trace during the movement. In the kinesthetic-motor condition only the home position and targets were visible, but the pen trace was not displayed during the movement to the targets, and the movement back to the home position, until the pen was within 2 cm of the home position, so that participants were able to home in to the starting position.
Participants were required to position the pen on the digitizing tablet such that the cursor on the display above it appeared inside a red dot indicating the home position. In the visuo-motor condition, once the pen was stationary in the home position, a blue dot appeared either at 25, 90, or 155 degrees relative to the home position, with the 90-degree target positioned straight ahead of the home position. In the kinesthetic-motor condition, the dots appeared at 45 or 135 degrees. We choose different angles for the kinesthetic condition in order to avoid a simple transfer from the visual to the kinesthetic condition. In both conditions, the targets were 9 cm away from the home position (see Fig. 1); home position and targets were 0.5 cm in diameter.
Figure 1.

Stimulus display on the monitor; the gray targets denote the targets to which participants had to move in visuo-motor conditions, the empty targets the ones in the kinesthetic-motor condition; movements always started from the home position. While the home position was always visible, only one target at a time was displayed at each trial. The solid straight line to the right target is an example of an ideal movement path. The dashed straight line illustrates the movement direction required during the 60° visual feedback rotation when the cursor had to be brought to the right visual target. The curved line is an example of a typical movement path during exposure, with the curvature decreasing with trials. The elliptic shape at the bottom marks the position of the chinrest.
During the visuo-motor baseline phase (pre-exposure), veridical on-line visual feedback of the pen position was provided on the monitor (18 trials, 6 per target). This was followed by the kinesthetic-motor baseline, where visual feedback in form of the pen trace was removed (18 trials, 9 per target). This phase served as reference for participants accuracy with respect to movement direction and amplitude when they could base their hand position estimate only on kinesthesia. During the adaptation phase (exposure), visual feedback of the pen trace was present again, but was rotated counterclockwise by 60 degrees (126 trials, 42 per target), requiring participants to adapt to the visuo-motor perturbation. This was followed by a kinesthetic-motor baseline phase (post-exposure), with visual feedback of the pen trace being removed, again requiring participants to rely on their kinesthetic feedback when moving to the targets (36 trials, 18 per target). As a result of the previous adaptation, post-exposure was characterized by aftereffects, resulting in angular deviations of the center-out movements that were in opposite direction to those in the exposure phase.
Participants were asked to move the pen “as fast and straight as possible into the target”. It is important to note that there was of course a certain amount of speed-accuracy trade-off, since they could not just overshoot the target and return. However, we made sure that, particularly in the visual conditions, movements started out swiftly. During the visual conditions, they had to hit the target with the pen, and stay inside it for 500 ms. For the kinesthetic-motor conditions, they were instructed to stop the movement when they thought their movement endpoint matched the position of the target shown on the display above their hand (without actually getting feedback about the pen position). After remaining motionless for 500 ms, the target disappeared, and participants returned to the home position for the next trial. For each baseline condition, we gave participants six practice trials in order for them to get familiar with the procedure.
2.3. Kinematic and statistical analysis
The x/y position data were filtered with an 8th order, dual pass Butterworth filter with a 10 Hz cutoff. Based on the filtered tangential velocity time series, movement onset and offset were determined using an interactive, algorithm-based procedure (Contreras-Vidal, 2006; Teasdale et al., 1993). Variables of interest were root mean square error (RMSE, in cm), defined as the perpendicular distance at each sample point between the actual movement path and the direct vector between home and target, initial directional error (IDE, in degrees), defined as the angular deviation of the actual movement from the ideal, straight movement vector between home position and target. End point error (EPE, in cm), defined as the Euclidian distance between the pen position at movement offset and the respective target in each trial, was a relevant error measurement in the kinesthetic condition only, since in the visual condition it was required to reach the target. IDE was measured at 90 ms after movement onset (i.e., the pen had left the home position); since at this point in time no sensory feedback is available to the system yet, IDE can be seen as measure of a feedforward directional estimate. Additionally, for both baselines, movement time (MT, in sec), defined as the difference between movement offset and onset, was assessed.
Prior to statistical analysis, trials were averaged across blocks of six; each pre-exposure phase would therefore be reduced to 3, exposure to 21, and post-exposure to 6 trial blocks. For baseline statistical analysis we used the mean of the last two blocks (12 trials) of each condition. For analysis of exposure and post-exposure, the respective first and last blocks of trials were used; depending on the analysis, blocks would be compared using a two-way ANOVA (with block as within-subjects, and age group as between-subjects factor), or a one-way ANOVA; all post-hoc tests were Bonferroni corrected.
3. Results
During both visuo- and kinesthetic-motor baselines, participants of all five age groups performed quite similarly; while there were statistically significant group differences in MT, RMSE and EPE (in the kinesthetic-motor condition), no significant group differences for IDE in either condition were found. The latter finding indicates that during baseline participants moved to the targets in a reasonably straight and accurate fashion, independent of age. The following two paragraphs describe these results in more detail.
3.1. Visual pre-exposure
For the visual baseline, MT, RMSE, and IDE were assessed; since visual feedback of the movement path was available, and the target had to be hit in order to initiate the next trial, end point error was not a variable of interest in this condition. A one way ANOVA on MT showed a significant main effect for group (F(4,63)=10.46, p<0.001; Bonferroni-adjusted pairwise comparisons showed that the 5–6 year-old children moved significantly slower than the 9–10 and 11–12 year-olds, and the 7–8 year-old children significantly slower than the 11–12 year-olds (all p=<0.1). Both of the younger groups moved also significantly slower than the adults (5–6 year olds: p<0.001, 7–8 year olds: p=0.02).
For RMSE, there was also a significant main effect for group (F(4,63)=4.49, p=0.01), with the youngest age group displaying significantly higher RMSE values than the 9–10 year-olds, (p<0.001), and the 11–12 year-olds (p=0.01).
While IDE values of the 5–6 year-old children were slightly higher than those of the other age groups, the difference did not reach statistical significance. The positive IDE values indicate that movements tended to start out just a few degrees to the left of the target vector (see Fig. 2 Pre-exposure visual panel for IDE, and Table 2 for group means and standard deviations of the variables).
Figure 2.

IDE group means as a function of trials; the regression lines in the pre- and post-exposure panels represent a linear fit for the group mean per trial for each age group. For the exposure phase, a quadratic fit is displayed for the data of each group. The shaded areas indicate the trial blocks that were used for statistical analysis. The post-exposure phase has been blown up to make the linear fits for the different age groups better visible.
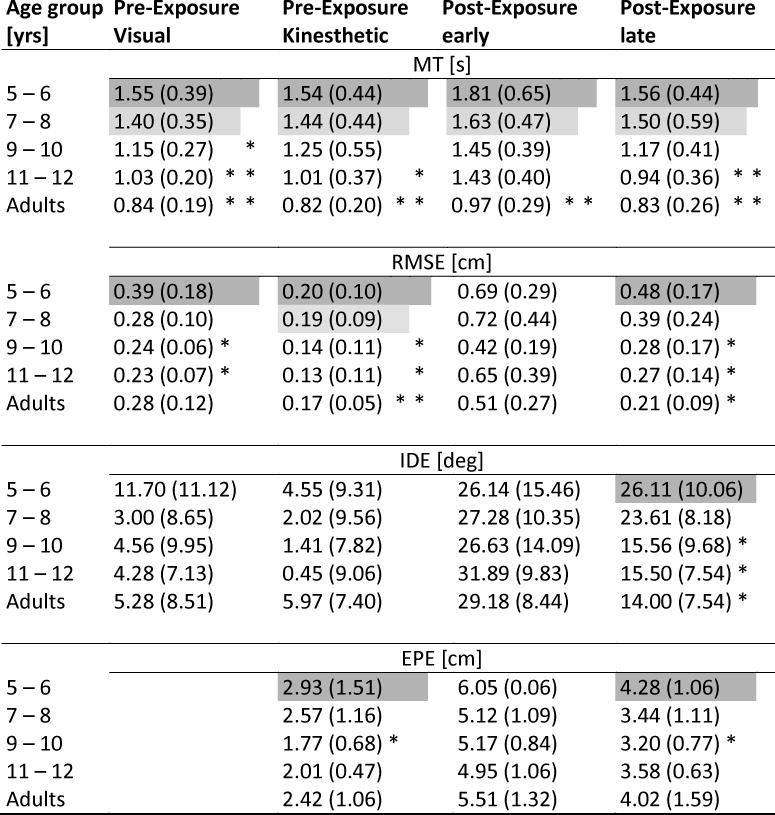
Table 2.
RMSE, IDE, and EPE group means (SD) for pre- and post-exposure. Shaded cells indicate that this group’s means were significantly different from those below (in the same section) marked with asterisks.
|
3.2. Kinesthetic pre-exposure
In this condition MT, RMSE, IDE, and EPE were assessed; in the absence of vision of the movement path, end point error was of interest as an indicator of spatial accuracy with respect to the targets. A one way ANOVA on MT showed a significant main effect for group (F(4,63)=5.16, p<0.001; Bonferroni-adjusted pairwise comparisons showed that again the 5–6 year-old children moved significantly slower than the 11–12 year-olds (p<0.05), and the adults (p<0.001).
For RMSE, an ANOVA showed a significant main effect for group (F(4, 63)=6.10, p<0.001), based on the 5–6 year-olds having significantly higher RMSE scores than the 9–10, and the 11–12 year olds (both p=0.01), as well as the adults (p<0.001).
For IDE no statistically significant differences were found (p>0.5) between the groups, indicating their similar performance (see Fig. 2 Pre-exposure kinesthetic panel for IDE, and Table 2 for all variables).
EPE was highest in the in the 5–6 year old children, as evidenced by a significant main effect for group (F(4,63)=2.80, p=0.03); pairwise comparisons showed the 5–6 year-olds had significantly higher endpoint errors than the 9–10 year-olds (p<0.05).
3.3. Exposure
The variables of interest for exposure were RMSE and IDE (again, EPE is not of interest here, because hitting the target was a prerequisite for initiating the next trial, and MT is foreseeably slower in this condition). At the beginning of exposure all subjects showed large angular deviations from a straight movement path due to the visual feedback perturbation, but adapted across the 126 trials administered during that condition. By the end of exposure, participants had adapted to the perturbation, as indicated by reduced RMSE and IDE values across groups (for IDE, see Fig. 2 Exposure visual panel). Separate repeated measures ANOVA comparing the first and last trial block (within-subjects factor), with age group as between-subjects factor did not reveal significant main effects for group, or an interaction between block and group for either variable (all p>0.2). Across groups, the mean and standard deviation (SD) of the early/late blocks for RMSE were 2.24 (0.71)/0.68 (0.37), and for IDE −48.63 (11.67)/−18.07 (15.79). Main effects for block were present for RMSE (F(1,63)=305.45, p<0.001), and IDE (F(1,62)=198.26, p<0.001), indicating that in all groups spatial movement variability, and angular errors were significantly lower by the end of adaptation compared to early adaptation.
3.4. Post-exposure: Aftereffects and De-adaptation
Once visual feedback (and with it the visual feedback rotation) of the movement path was removed, all groups showed clear aftereffects from the adaptation to the visual feedback rotation, resulting in increased RMSE, IDE, and EPE values during the first block of trials of post-exposure, compared to kinesthetic baseline. At the same time, the post-exposure phase informs us about how the updated visuo-motor map interacts with the kinesthetic-motor map that participants now need to rely on when vision of the movement path is no longer available: if, under these circumstances, the system up-weights kinesthetic information, movements should be driven back towards normality. If the system does not, or cannot, up-weight kinesthetic information sufficiently, trajectory planning and execution will continue to draw from the newly acquired visuo-motor map, even in the absence of visual feedback. Aftereffects and de-adaptation were assessed with separate repeated measures ANOVAs on RMSE, IDE, and EPE comparing kinesthetic pre-exposure, and the first and last block of post-exposure across the five age groups.
For RMSE, there were significant main effects for group across the three phases pre-exposure, early and late post-exposure (F(4,65)=4.30, p<0.001) and phase (F(1,126)=61.52, p<0.001). Concerning the main effect for phase, comparisons between pre-exposure and early post exposure showed significantly higher RMSE across all groups (mean difference: −0.35cm, p=0.02), reflecting aftereffects, and significantly lower RMSE for late compared to early exposure (mean difference 0.27cm, p=0.02). Regarding the group differences – the one for pre-exposure had already been established (see under 3.2), therefore we tested for the first and last post-exposure blocks using one-way ANOVAs, and found no group differences for early post-exposure (p>0.2). For late post-exposure, however, post-hoc tests showed that the 5–6 year olds had significantly higher RMSE than the 9–10, the 11–12 year olds, and the adults (p<0.05, p=0.05, p=0.01, respectively).
For IDE, a repeated measures ANOVA between the three phases showed a significant main effect for phase (F(2,162)=118.11, p<0.001), and a significant phase by group interaction (F(8,126)=2.22, p=0.03). A post-hoc comparison between pre-exposure and early post-exposure showed that all groups had significantly higher IDE during early post-exposure, reflecting aftereffects (mean difference −25.42°, p<0.001); a comparison between early and late post-exposure showed that the phase by block interaction was between those two phases, reflecting the higher IDE values for the youngest children versus the lower values of the older children and the adults at the end of post-exposure. This was confirmed by Bonferroni-adjusted pairwise post-hoc comparisons on late post-exposure: in that last block of trials, the 5–6 year old children showed a significantly higher IDE than the 9–10, the 11–12 year olds, and the adults (p=0.01, p=0.04, p=0.02, respectively). The 7–8 year olds showed a tendency for higher IDE values compared to the 9–10 year olds and the adults (both p=0.08). It is important to note in this context that all groups started out at more or less the same level at early post-exposure (Fig. 2 Post-exposure), but ended up at different levels at the end of post-exposure.
To illustrate de-adaptation characteristics of the different age groups further, we calculated individual linear regressions across the 36 post-exposure trials and compared the slope values between the five age groups (see Fig. 3). We found that the regressions for the 5–6 year olds showed significantly more shallow slopes than those for the 11–12 year-old children (p<0.001), and the adults (p=0.01, both Bonferroni-adjusted); the slopes of the 7–8 year olds were significantly shallower than those of the 11–12 year old children (p=0.02). This indicates that the young children de-adapted to a substantially lesser degree than the older children over the course of the post-exposure phase.
Figure 3.

Post-exposure slope means for each age group; error bars represent standard deviations.
For EPE, there were significant effects for group (F(4,63)=3.80, p=0.01) and for block (F(2,126)=200.36, p<0.001); no statistically significant interactions were present. The block main effect reflects the fact that, across groups, EPE was significantly higher during early post-exposure compared to the kinesthetic pre-exposure (mean difference 3.00cm, p<0.001), and that groups showed significantly smaller EPE at late post-exposure compared to early post-exposure (mean difference 1.69cm, p<0.001). The group effect reflects the higher constant error values of the youngest age group compared to the 9–10 year olds at pre-exposure, and at post-exposure. During early post-exposure, all groups performed very similar, confirming a similar level of adaptation to the visuo-motor perturbation.
As can be seen from Fig. 4, the EPE locations are mostly oriented along the axis of the vector between movement start and endpoint. In order to get information on the variability of EPE, it can be divided into a distance component (along the y-axis: EPY), reflected by the long axis of the ellipses fitted to the EPE distribution, and a direction component (along the x-axis: EPX), reflected by the short axis of the ellipses. A repeated measures ANOVA on EPX comparing the first and last block of post-exposure (in Fig. 4 represented by the left and right columns, respectively) between the four age groups showed the expected significant effect for block (F(1,63)=94.74, p<0.001), and a significant main effect for group (F(4,63)=3.45, p=0.01) (Fig. 5A), but no interactions involving group; a separate analysis of EPY showed a significant block effect (F(1,63)=20.34, p<0.001), but no effect for group, or interactions involving group (Fig. 5B).
Figure 4.

EPE distributions: for each age group, during the early phase of post-exposure (left column) and the late phase (right column). The gray dots marked with T1, T2 denote the position of the kinesthetic targets (which matched the visual target positions displayed on the monitor above the workspace). The dashed lines from the black circles (home position) to the targets denote the target vector. The confidence ellipses are centered on the sample means of EPX and EPY, with the unbiased sample standard deviations of x and y determining their major axes.
Figure 5.

Group means for EPX and EPY; A: EPX, representing movement direction error; B: EPY, representing movement extent error. Early refers to the first block, and late to the last block during post-exposure; error bars represent standard deviations. C: Group averages of the movement paths for the 5–6 and the 11–12 year-old children, and the adults, for visual and kinesthetic pre-exposure, early and late visual exposure, and kinesthetic early and late post-exposure. The shaded areas indicate the averaged spatial variability of the movements. The open circles in the kinesthetic conditions denote the target positions. The arrows in the late post-exposure phase point out the slightly curved movement paths of the young children; movement paths of the older children and the adults are straighter, and end closer to the target circles, particularly for the dominant hand.
4. Discussion
In this study, we used a cross-modal paradigm to investigate the development of multisensory-motor integration in 5–12 year-old children. More specifically, we were interested in how kinesthetic-motor representation of active hand movements interacted with a previously acquired visuo-motor internal representation, and how this interaction changed across age.
The pre-exposure results replicate earlier findings (Contreras-Vidal, 2006; Smeets, van den Dobbelsteen, de Grave, van Beers, & Brenner, 2006), showing that young children tend to move slower, with overall lower endpoint accuracy in conditions without visual feedback of the end-effector movement than that of older children. These positional estimation errors are likely the result of noisy signals from proprioceptors (or processes involving proprioception), or signal integration from other sources, such as efference copy. It is important in this context to note that the instructions emphasized the importance of both movement speed and accuracy with respect to the visual target displayed directly above the workspace. Variability was generally higher in the kinesthetic-motor baseline condition; this speaks to the results of an earlier study by Smeets and colleagues (Smeets et al., 2006), using veridical feedback similar to the conditions in our pre-exposure phases. They argued that without vision of hand position, the proprioceptive estimate of hand position relative to target position becomes increasingly less precise, due to an accumulation of uncertainty in the absence of visual feedback. In this context, the fact that RMSE and EPE were lower in the oldest children would suggest that there was less uncertainty in their proprioceptive estimates at the endpoint than in those of the younger children.
During exposure, children of all age groups adapted to the visual feedback perturbation and reduced their IDE, reflecting an improvement of their forward model, and their RMSE over the 126 trials; the rate of change during exposure was very similar for all age groups. At the end of exposure, all four age groups of children, as well as the adults, had adapted to the visual feedback rotation, and had updated their visuo-motor model map to more or less the same degree. This was reflected by a similar magnitude of aftereffects in all groups at the beginning of the post-exposure phase. This is in contrast to an earlier study also using a visuo-motor adaptation paradigm (Contreras-Vidal et al., 2005): In this study only the oldest children (8 years) showed these aftereffects, but not the younger ones (4 and 6 years). Their study, however, used only half as many adaptation trials as the current study, which might have prevented the younger children from adapting sufficiently well to the perturbation. The relatively high number of adaptation trials in our study is likely the reason that the children of all ages and the adults reach about the same level of adaptation, and therefore all show aftereffects.
The post-exposure phase was of particular interest: Participants performed under kinesthetic-motor baseline conditions again, where the cursor was shown when the pen was in the starting position, but disappeared when the movement began. This required them to rely primarily on kinesthesia in order to compute a movement vector that drove the limb to an end-effector position that would match that of the visually presented targets. During the early stages of post-exposure, the children continued to move along the rotated movement vector, resulting in high IDE and EPE values, independent of age. With ongoing trials, however, age-dependent performance differences emerged. Although the aftereffect magnitude of IDE was similar for all groups at the beginning of post-exposure, the rate of de-adaptation (i.e., the rate at which IDE decreased) during post-exposure was different. Our results show that the younger children de-adapted substantially slower than the older children, or the adults. Without visual feedback of the movement, the younger children more or less maintained the aftereffect-specific initial angular deviation at movement onset: They appeared to be locked in the movement mode experienced last with vision, suggesting a high reliance on visual feedback being available. The reliance of young children on vision over proprioception (when both are available) has been documented in earlier research (Contreras-Vidal et al., 2005; Hofsten & Rösblad, 1988); as a result of this, and of their higher proprioceptive variability (Ernst & Banks, 2002; van Beers, Sittig, & Gon, 1999), it is likely that young children tend to up-weight visual information relative to kinesthetic information.
At the same time, however, it is interesting to note that although there was a statistically significant group interaction during post-exposure for movement direction immediately after movement onset (as measured by IDE), there was no such interaction for the directional component of the endpoint error (as measured by EPX). This indicates that, in the late phase of post-exposure, although the younger children started out in the wrong direction, they made slight adjustments based on kinesthetic feedback in a later phase of the movement, ending up with a directional endpoint error that was similar to that of the other groups. This is illustrated in the movement paths shown in Fig. 5C, where, in the late post-exposure phase, the slightly curved movement paths are visible for the 5–6 year-old group (indicated by arrows), whereas the movement paths of the 11–12 year-old children and the adults are fairly straight. Assuming that target-oriented movements that depend primarily on kinesthetic input show similar feedforward- and feedback-dominated phases as visually guided movements (Jeannerod, 1988), and that accurate kinesthetic guidance of an effector depends on the integration of feedforward and feedback signals (Desmurget & Grafton, 2000), this result would suggest that the integration of kinesthetic feedback and feedforward operates less efficiently in the younger children. This possibility is supported by an earlier study in children with a similar age range that suggests that feedback information is utilized better (and would therefore be better available for subsequent feedforward processes) with increasing age (Hay et al., 2005).
In contrast, in the older children directional accuracy gravitated towards baseline levels faster after the visuo-motor perturbation, indicating that the forward kinesthetic-motor representation necessary for movement planning was being updated more effectively, despite the absence of visual feedback. This suggests an increased kinesthetic functioning, possibly through better integration of feedforward and feedback processes. The resulting up-weighting of this kinesthetic information appears to lead to an increased and more accurate contribution of this modality when vision is not available. This is supported by earlier research arguing that the CNS likely uses probabilistic mechanisms to reduce uncertainty of sensory information, and re-weights this information to produce the lowest-variance estimates (Ernst & Banks, 2002; van Beers et al., 1999). In this context, a recent study using a finger matching task also showed that older children up-weight proprioceptive information, whereas younger children up-weighted visual information (King, Kagerer, Contreras-Vidal, & Clark, 2009).
An alternative explanation for the results of our study could be that the older children simply relied more on explicit learning during the visuomotor adaptation phase than the younger children did. Consequently, the different rates of de-adaptation could be seen as a result of different learning strategies. However, we think there are two important points that go against this argument: First, none of the participants could describe the nature of the visuomotor perturbation when asked after the experiment. Neither the young, nor the older children, nor the adults were able to conceptualize rules or strategies that could have been used to compensate for the rotated visual feedback. Secondly, if the young and the old children (and adults) had employed different strategies, the learning curves during exposure would look different, and they very likely would not arrive at the same adaptation levels at the end of exposure, nor would the younger and the older children exhibit similarly large aftereffects during early post-exposure – which would clearly be in contrast to our results.
Also, for reaching tasks similar to the one we employed, its has been suggested that recalibration processes and effector-specific factors both contribute to aftereffects (Simani, McGuire, & Sabes, 2007). Although we cannot rule out effector-specific effects, these would, by definition, be a common to both the visuo-motor and the kinesthetic-motor representations. Kinesthesia is based on signals from peripheral receptors, such as muscle spindles, Golgi tendon organs, and skin stretch receptors. There are, to our knowledge, no studies on the functional development of these receptors. On a behavioral level, decreased kinesthetic sensitivity in children, compared to adults, has been shown in experiments using passive movements (Pickett & Konczak, 2009); it is conceivable that this decreased sensitivity could give rise to noisier signals, and a kinesthetic-motor internal model that is less robust in competing with other, e.g., visuo-motor, internal representations.
Conclusion
When children were exposed to a novel (rotated) visuo-motor relationship over 126 trials, they adapted to it similarly well, irrespective of age. The adaptation in the visuo-motor domain affected the kinesthetic-motor representations in that the children continued to move along the previously acquired paths once vision was not available any longer. Over time, the rotated movement paths gravitated back towards those before the visuo-motor perturbation. However, this de-adaptation was age-dependent. Whereas the movements of the younger children continued to be shaped by the updated visuo-motor map, and, over the course of 36 trials, their trajectory planning did not change substantially when they had to relied on kinesthetic feedback, the older children could obviously utilize their kinesthetic estimates more efficiently when vision was not available, most likely through up-weighting kinesthetic information, and could thus recalibrate their kinesthetic-motor representation to levels close to those present prior to the visuo-motor adaptation. These results expand on earlier findings on proprioception in localization tasks, and show that, with increasing age, the interaction of kinesthetic-motor and visuo-motor internal representations shifts from higher reliance on visuo-motor maps in younger children to better utilization of kinesthetic information in older children when task requirements demand this.
Acknowledgments
This research was supported by National Institute of Child Health and Human Development Grants R01-HD-42527 to J. E. Clark and R03-HD-050372 to F. A. Kagerer.
Footnotes
Publisher's Disclaimer: This is a PDF file of an unedited manuscript that has been accepted for publication. As a service to our customers we are providing this early version of the manuscript. The manuscript will undergo copyediting, typesetting, and review of the resulting proof before it is published in its final citable form. Please note that during the production process errors may be discovered which could affect the content, and all legal disclaimers that apply to the journal pertain.
Contributor Information
Florian A. KAGERER, Email: fkagerer@msu.edu.
Jane E. CLARK, Email: jeclark@umd.edu.
References
- Bo J, Contreras-Vidal JL, Kagerer FA, Clark JE. Effects of increased complexity of visuo-motor transformations on children’s arm movements. Human Movement Science. 2006;25(4–5):553–567. doi: 10.1016/j.humov.2006.07.003. [DOI] [PubMed] [Google Scholar]
- Buneo CA, Jarvis MR, Batista AP, Andersen RA. Direct visuomotor transformations for reaching. Nature. 2002;416(6881):632–636. doi: 10.1038/416632a. [DOI] [PubMed] [Google Scholar]
- Chen LC, Metcalfe JS, Jeka JJ, Clark JE. Two steps forward and one back: Learning to walk affects infants’ sitting posture. Infant Behavior & Development. 2007;30(1):16–25. doi: 10.1016/j.infbeh.2006.07.005. [DOI] [PubMed] [Google Scholar]
- Contreras-Vidal JL. Development of forward models for hand localization and movement control in 6- to 10-year-old children. Human Movement Science. 2006;25(4–5):634–645. doi: 10.1016/j.humov.2006.07.006. [DOI] [PubMed] [Google Scholar]
- Contreras-Vidal JL, Bo J, Boudreau JP, Clark JE. Development of visuomotor representations for hand movement in young children. Experimental Brain Research. 2005;162(2):155–164. doi: 10.1007/s00221-004-2123-7. [DOI] [PubMed] [Google Scholar]
- Desmurget M, Grafton S. Forward modeling allows feedback control for fast reaching movements. Trends in Cognitive Sciences. 2000;4(11):423–431. doi: 10.1016/s1364-6613(00)01537-0. [DOI] [PubMed] [Google Scholar]
- Ernst MO, Banks MS. Humans integrate visual and haptic information in a statistically optimal fashion. Nature. 2002;415(6870):429–433. doi: 10.1038/415429a. [DOI] [PubMed] [Google Scholar]
- Ferrel-Chapus C, Hay L, Olivier I, Bard C, Fleury M. Visuomanual coordination in childhood: adaptation to visual distortion. Experimental Brain Research. 2002;144(4):506–517. doi: 10.1007/s00221-002-1064-2. [DOI] [PubMed] [Google Scholar]
- Fiehler K, Rösler F, Henriques DYP. Interaction between gaze and visual and proprioceptive position judgements. Experimental Brain Research. 2010;203(3):485–498. doi: 10.1007/s00221-010-2251-1. [DOI] [PubMed] [Google Scholar]
- Georgopoulos AP, Schwartz AB, Kettner RE. Neuronal population coding of movement direction. Science (New York, NY) 1986;233(4771):1416–1419. doi: 10.1126/science.3749885. [DOI] [PubMed] [Google Scholar]
- Hay L, Bard C, Ferrel C, Olivier I, Fleury M. Role of proprioceptive information in movement programming and control in 5 to 11-year old children. Human Movement Science. 2005;24(2):139–154. doi: 10.1016/j.humov.2005.05.002. [DOI] [PubMed] [Google Scholar]
- Henderson S, Sugden D. The Movement Assessment Battery for Children. London, UK: Psychological Cooperation; 1992. [Google Scholar]
- Henriques DY, Klier EM, Smith MA, Lowy D, Crawford JD. Gaze-centered remapping of remembered visual space in an open-loop pointing task. The Journal of Neuroscience. 1998;18(4):1583–1594. doi: 10.1523/JNEUROSCI.18-04-01583.1998. [DOI] [PMC free article] [PubMed] [Google Scholar]
- von Hofsten C, Rösblad B. The integration of sensory information in the development of precise manual pointing. Neuropsychologia. 1988;26(6):805–821. doi: 10.1016/0028-3932(88)90051-6. [DOI] [PubMed] [Google Scholar]
- Jeannerod M. The neural and behavioural organization of goal directed movements. Oxford: Clarendon Press; 1988. [Google Scholar]
- Kagerer FA, Contreras-Vidal JL. Adaptation of sound localization induced by rotated visual feedback in reaching movements. Experimental Brain Research. 2009;193(2):315–321. doi: 10.1007/s00221-008-1630-3. [DOI] [PMC free article] [PubMed] [Google Scholar]
- King BR, Kagerer FA, Contreras-Vidal JL, Clark JE. Evidence for multisensory spatial-to-motor transformations in aiming movements of children. Journal of Neurophysiology. 2009;101(1):315–322. doi: 10.1152/jn.90781.2008. [DOI] [PMC free article] [PubMed] [Google Scholar]
- King BR, Kagerer FA, Harring JR, Contreras-Vidal JL, Clark JE. Multisensory adaptation of spatial-to-motor transformations in children with developmental coordination disorder. Experimental Brain Research. 2011;212(2):257–265. doi: 10.1007/s00221-011-2722-z. [DOI] [PMC free article] [PubMed] [Google Scholar]
- King BR, Pangelinan MM, Kagerer FA, Clark JE. Improvements in proprioceptive functioning influence multisensory-motor integration in 7- to 13-year-old children. Neuroscience Letters. 2010;483(1):36–40. doi: 10.1016/j.neulet.2010.07.056. [DOI] [PMC free article] [PubMed] [Google Scholar]
- Konczak J, Jansen-Osmann P, Kalveram KT. Development of force adaptation during childhood. Journal of Motor Behavior. 2003;35(1):41–52. doi: 10.1080/00222890309602120. [DOI] [PubMed] [Google Scholar]
- Pickett K, Konczak J. Measuring kinaesthetic sensitivity in typically developing children. Developmental Medicine and Child Neurology. 2009;51(9):711–716. doi: 10.1111/j.1469-8749.2008.03229.x. [DOI] [PubMed] [Google Scholar]
- Pouget A, Ducom JC, Torri J, Bavelier D. Multisensory spatial representations in eye-centered coordinates for reaching. Cognition. 2002;83(1):B1–11. doi: 10.1016/s0010-0277(01)00163-9. [DOI] [PubMed] [Google Scholar]
- Rossetti Y, Desmurget M, Prablanc C. Vectorial coding of movement: vision, proprioception, or both? Journal of Neurophysiology. 1995;74(1):457–463. doi: 10.1152/jn.1995.74.1.457. [DOI] [PubMed] [Google Scholar]
- Simani MC, McGuire LMM, Sabes PN. Visual-shift adaptation is composed of separable sensory and task-dependent effects. Journal of Neurophysiology. 2007;98(5):2827–2841. doi: 10.1152/jn.00290.2007. [DOI] [PMC free article] [PubMed] [Google Scholar]
- Smeets JBJ, van den Dobbelsteen JJ, de Grave DDJ, van Beers RJ, Brenner E. Sensory integration does not lead to sensory calibration. Proceedings of the National Academy of Sciences of the United States of America. 2006;103(49):18781–18786. doi: 10.1073/pnas.0607687103. [DOI] [PMC free article] [PubMed] [Google Scholar]
- Smits-Engelsman B, Duysens J. The line copy task for kinesthesia and internal movement representation: application in children. Human Movement Science. 2008;27(5):682–694. doi: 10.1016/j.humov.2008.03.005. [DOI] [PubMed] [Google Scholar]
- Teasdale N, Bard C, Fleury M, Young DE, Proteau L. Determining movement onsets from temporal series. Journal of Motor Behavior. 1993;25(2):97–106. doi: 10.1080/00222895.1993.9941644. [DOI] [PubMed] [Google Scholar]
- van Beers RJ, Sittig AC, Gon JJ. Integration of proprioceptive and visual position-information: An experimentally supported model. Journal of Neurophysiology. 1999;81(3):1355–1364. doi: 10.1152/jn.1999.81.3.1355. [DOI] [PubMed] [Google Scholar]
- van Beers RJ, Wolpert DM, Haggard P. When feeling is more important than seeing in sensorimotor adaptation. Current Biology: CB. 2002;12(10):834–837. doi: 10.1016/s0960-9822(02)00836-9. [DOI] [PubMed] [Google Scholar]
- Visser J, Geuze RH. Kinaesthetic acuity in adolescent boys: a longitudinal study. Developmental Medicine and Child Neurology. 2000;42(2):93–96. doi: 10.1017/s0012162200000189. [DOI] [PubMed] [Google Scholar]
- Yan JH, Thomas JR, Stelmach GE, Thomas KT. Developmental features of rapid aiming arm movements across the lifespan. Journal of Motor Behavior. 2000;32(2):121–140. doi: 10.1080/00222890009601365. [DOI] [PubMed] [Google Scholar]
- Zwiers MP, Van Opstal AJ, Paige GD. Plasticity in human sound localization induced by compressed spatial vision. Nature Neuroscience. 2003;6(2):175–181. doi: 10.1038/nn999. [DOI] [PubMed] [Google Scholar]