Abstract
Objective
To evaluate gestational age-dependent changes in the T2 relaxation time in normal murine placentas in vivo. The role of susceptibility-weighted imaging (SWI) in visualization of the murine fetal anatomy was also elucidated.
Methods
Timed-pregnant CD-1 mice at gestational day (GD) 12 and GD17 underwent magnetic resonance imaging. Multi-echo, spin echo, and SWI data were acquired. The placental T2 values on GD12 and GD17 were quantified. To account for the influence of systemic maternal physiological factors on placental perfusion, maternal muscle was used as a reference for T2 normalization. A linear mixed-effects model was used to fit the normalized T2 values, and the significance of the coefficients was tested. Fetal SWI images were processed and reviewed for venous vasculature and skeletal structures.
Results
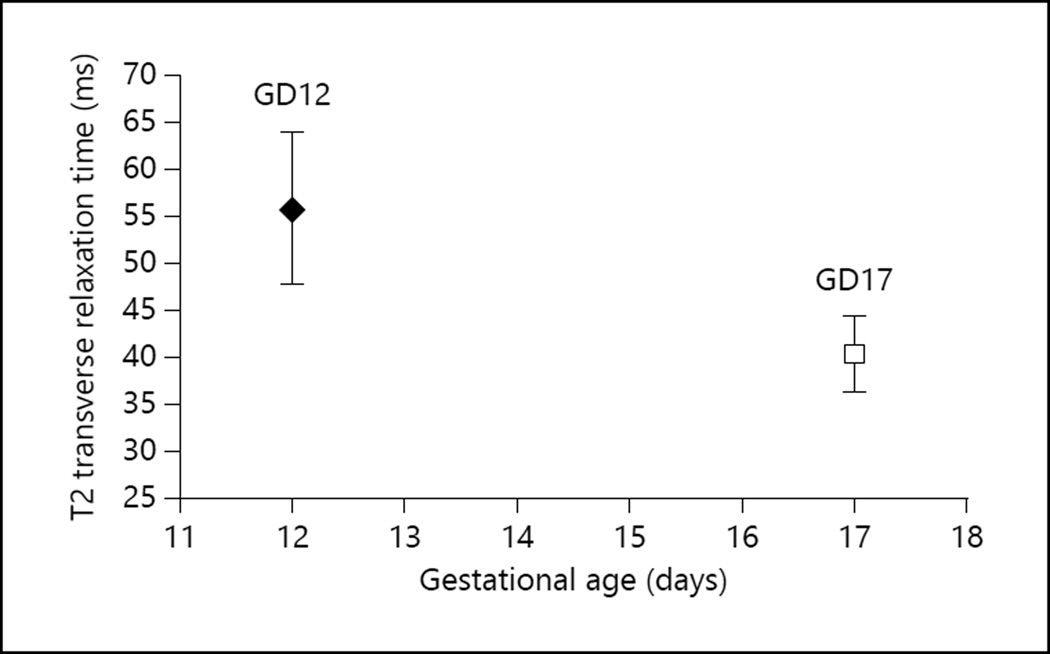
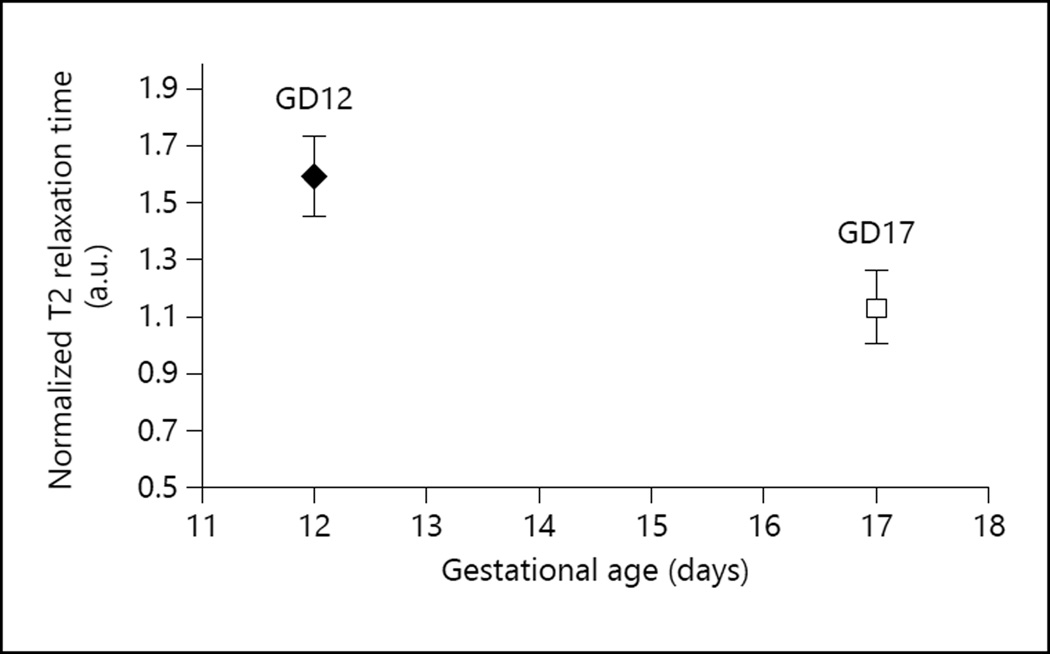
The average placental T2 value decreased significantly on GD17 (40.17 ± 4.10 ms) compared to the value on GD12 (55.78 ± 8.13 ms). The difference in normalized T2 values also remained significant (p = 0.001). Using SWI, major fetal venous structures like the cardinal vein, the subcardinal vein, and the portal vein were visualized on GD12. In addition, fetal skeletal structures could also be discerned on GD17.
Conclusion
The T2 value of a normal murine placenta decreases with advancing gestation. SWI provided clear visualization of the fetal venous vasculature and bony structures.
Keywords: Transverse relaxation time, Susceptibility-weighted imaging, Venography, Magnetic resonance imaging, Murine embryo
Introduction
The chorioallantoic placenta is a highly vascularized organ that forms the interface between the maternal and fetal circulations in eutherian mammals. The extent of feto-maternal contact varies widely among mammals depending on the type of placental interface, feto-maternal interdigitation, and the placental shape [1, 2]. Besides working as a barrier, the placenta facilitates directional nutrient, gas, and waste product transport between the mother and her offspring. Moreover, the placenta is a rich source of fetal hormones, growth factors, and cytokines that modulate the maternal metabolism and immune functions. Therefore, a normal functioning placenta plays a pivotal role in supporting embryonic and fetal development, maternal-fetal immune tolerance, and the maintenance of pregnancy [3–9]. Placental dysfunction may lead to various clinical phenotypes, such as intrauterine growth restriction (IUGR), the delivery of small-for-gestational-age neonates, preterm birth, and preeclampsia [9–15]. A growing body of evidence supports the concept that IUGR may be due to a decreased utero-placental blood flow and subsequent chronic hypoxia and/or ischemia-reperfusion injury of the placenta, as well as a reduced placental transport function [16– 18]. Murine models are commonly used to understand and mimic the mechanisms of disease in human obstetrical syndromes, such as preeclampsia, IUGR, and preterm birth [19–22]. Although mice have hemochorial placentation, some structural and functional aspects are different compared to humans [1, 5]. For example, the murine placenta contains 3 major zones: (1) the maternal decidual zone; (2) the junctional zone, where maternal and fetal cells intermingle, and (3) the inner labyrinthine zone, where gas and nutrient exchanges occur [5]. The latter zone is equivalent to the villous placenta in humans. However, in spite of these anatomical differences, the molecular mechanisms of placental gas and nutrient transport overlap in these species [5, 8, 23, 24] and thus murine models can be employed to investigate changes in fetal growth and placental function in complications of human pregnancy.
The magnetic resonance imaging (MRI)-based transverse relaxation (T2) time has been shown to correlate with the microvascular perfusion status of human tissue, and it is sensitive to changes in perfusion and tissue morphology [25, 26]. The placental T2 relaxation time has the potential to be a noninvasive biomarker for IUGR in both human and animal models [12, 27]. The T2 relaxation time is sensitive to blood volume and local tissue characteristics such as water diffusion and blood oxygenation [28, 29]. Prior MRI studies conducted in animal models have used dynamic contrast-enhanced MRI to assess the functional behavior of the placenta [30–32] ; however, this is not feasible in humans due to concerns about contrast agent use during pregnancy. The quantitative T2 relaxation time is sensitive to placental hypoxia in pregnancy complications (in both human and animal models) [27, 33]. However, human studies have shown that the placental T2 relaxation time could change physiologically at different gestational ages [27, 34], which may also be the case in murine pregnancy. Therefore, knowledge of the normal progression of placental T2 relaxation times at different gestational ages is necessary to understand changes that occur in various pathological conditions in animal models. In this study, we aimed to evaluate normal changes in the T2 relaxation time of the murine placenta on 2 different gestational days (GD) (i.e. GD12 and GD17).
Another key area of investigation is the fetal vasculature, which is among the first systems to develop during embryonic life [35]. MRI examination of smaller structures (especially vascular ones) adds value to the understanding of fetal development [36], the detection of phenotypes when using genetically engineered models [37], and the assessment of functionality in normal and pathological conditions [38–40]. However, in order to visualize and perform quantitative analyses of these structures, advanced imaging sequences are necessary. Visualization of small structures is largely limited not only by the imaging resolution but also by the lack of sufficient contrast. It is anticipated that susceptibility-induced phase variations between the venous vasculature and background tissue might augment this contrast [41, 42]. Susceptibility-weighted imaging (SWI) is a high-resolution, flow-compensated, blood-oxygen-level-dependent (BOLD)-based gradient echo (GRE) acquisition which uses MR phase data to enhance tissue contrast based on local differences in their magnetic susceptibility [43–45]. SWI images are more sensitive to the BOLD signal due to the unique combination of T2*-weighted magnitude data and phase data. The phase images utilize paramagnetic deoxyhemoglobin as an endogenous contrast agent to enhance visualization of the venous structures [46]. Therefore, SWI phase images have value in visualizing and distinguishing bony structures, which are diamagnetic in nature, from paramagnetic venous structures [47]. SWI has been extensively used as a venographic technique in adult humans, and it has evolved for use in pediatric [48, 49] and neonatal venography [50]. More recently, this technique has also been used to visualize the venous vasculature of the fetal brain [51] and to highlight fetal microbleeds and intracranial hemorrhage during pregnancy [52]. In this study, we report our preliminary experience with SWI-based MR venography to visualize the fetal venous vasculature in the normal murine pregnancy.
Materials and Methods
Animal Care and Handling
The study protocol was approved by the Institutional Animal Care and Use Committee (IACUC) of Wayne State University. Animal care and handling followed the standards set forth by the National Research Council of the National Academies [53]. Timed-pregnant CD-1 mice (n = 7) were obtained from Charles River Laboratories (Wilmington, Mass., USA). Pregnancy was confirmed by manual examination on GD12. Mice were kept separately in filter top rodent cages and provided with water and food ad libitum. A regular 12: 12-hour dark-light cycle and a constant temperature (24 ± 1 ° C) and humidity (50 ± 5%) were maintained in the animal room, and the mice were monitored for food and water intake, vital signs, behavior, and activity.
Imaging Procedures
All MRI studies were performed on a 7.0-Tesla, 20-cm bore superconducting magnet (ClinScan; Bruker, Karlsruhe, Germany) interfaced with a Siemens console. Prior to image acquisition, anesthesia was induced by isoflurane (4% v/v) in an induction chamber to sedate the animals, and the mice were kept under anesthesia (2% v/v isoflurane) throughout the acquisition time. The MRI studies consisted of 3 major sequences which followed the localization scans: (1) T2-weighted turbo spin echo for anatomical evaluation, (2) multi-echo spin echo for T2 mapping, and (3) SWI for venography. A series of localization scans on different anatomical planes were obtained first, and then T2- weighted turbo spin echo data were acquired for anatomical assessment of the fetus and for visualization of each corresponding placenta. A fat-saturated, multi-echo T2-weighted spin echo sequence was used for the T2 measurement, which was acquired using the following sequence parameters: matrix size, 160 × 320; repeat time, 2,540–2,850 ms; slice thickness, 0.7/0.8 mm; in-plane resolution, (0.08–0.13) × 0.13 mm2, and pixel bandwidth, 130 Hz/pixel. A total of 6 echoes (at echo times of 15, 30, 45, 60, 75, and 90 ms or 10.8, 21.6, 32.4, 43.2, 54, and 64.8 ms) were acquired, and T2 maps were generated using a custom code written in Matlab (MathWorks, Natick, Mass., USA). For venography evaluation, a 2-D GRE SWI sequence was employed. The parameters used for SWI imaging were: TE, 7.84/5.42 ms; repeat time, 600–850 ms; acquisition matrix, 512 × 512; resolution, 0.08 × 0.08 × 0.7/0.8 mm3, and bandwidth, 150 Hz/pixel. The MRI parameters are summarized in table 1. The maximum total acquisition time for the SWI sequence was 14.5 min. Both T2 and SWI images were acquired in an axial orientation relative to the magnetic axis.
Table 1.
Summary of MRI parameters in the murine model
| Sequence | TE, ms | TR, ms | BW, Hz/pixel |
In-plane isotropic voxel size, mm |
Slice thickness, mm |
|---|---|---|---|---|---|
| Multi-echo spin echo sequence | 15, 30, 45, 60, 75, 90 (or) 10.8, 21.6, 32.4, 43.2, 54, 64.8 | 2,540–2,840 | 130–150 | 0.08–0.13 | 0.7–0.8 |
| SWI | 5.42–7.84 | 600–850 | 150 | 0.08 | 0.7–0.8 |
TE = Echo time; TR = repetition time; BW = bandwidth.
Image Processing
T2 maps were generated using the multi-echo data by fitting the signal to an exponential function on a pixel-by-pixel basis. Pixels with a poor fit or those that resulted in negative values were threshold to zero. A freehand-drawn region of interest was used to map the placenta, and the T2 values were recorded. Since measurements were carried out on more than one pregnant mouse at a given gestational age, normalization was performed to account for any systemic maternal physiological factors that could influence the placental T2 values. Normalization of the placental T2 values with the T2 value of a reference maternal tissue was used. In this case, maternal muscle tissue was selected as the reference region [54]. Thus, the ratio was computed as: placental T2 value/maternal muscle T2 value.
For visualization of the venous structures, the SWI phase images were first unwrapped using the prelude function in FMRIB Software Library software [55]. Following this, the unwrapped images were filtered using a homodyne filter [56] to remove any background low-spatial-frequency phase variation. These processed phase images were then multiplied onto the original magnitude images to create the SWI images [57]. The SWI phase images were reviewed for vasculature and bony structures.
Statistical Analyses
A linear mixed-effects model was used to fit the normalized placental T2 values as a function of the group variable. Therefore, measurements within each animal were treated as correlated data while accounting for the different number of data points within each animal. The significance of the coefficient was extracted from the fitted model using the nlme package [58] in an R statistical environment (www.r-project.org). p < 0.05 was considered statistically significant.
Results
T2 Relaxation Times
On GD12 the T2 values from 26 placentas were measured in 3 pregnant mice, while on GD17 the T2 values from 16 placentas were measured in 4 pregnant mice. The distribution of the number of placentas/mouse was as follows: (a) 5, 10, and 11 placentas, respectively, from the 3 mice on GD12, and (b) 2, 3, 5, and 5 placentas, respectively, from the 4 mice on GD17. The average T2 value measured across all placentas was 55.78 ± 8.13 ms (mean ± SD) on GD12 and 40.17 ± 4.10 ms on GD17 (fig. 1) (the SD represents the variation of the measured T2 value from one placenta to another). The maximum standard error of the mean in individual T2 measurements was 1.14 ms, which is much smaller than the interplacental T2 variation. The normalized T2 ratio for GD12 was 1.59 ± 0.14 arbitrary units (a.u.), and it was 1.13 ± 0.13 a.u. for GD17 (fig. 2). The decrease in normalized ratio values between GD12 and GD17 was statistically significant (p = 1.7 × 10⁻³). This indicates that the difference in T2 values between GD12 and GD17 is significant and is not influenced by systemic differences in maternal physiology from one pregnant mouse to another.
Fig. 1.
T2 transverse relaxation times of the murine placenta on GD12 and GD17.
Fig. 2.
Normalized T2 transverse relaxation times of the murine placenta on GD12 and GD17. The maternal muscle T2 relaxation time value was used as the reference for normalization. Normalized values were computed as the ratio: placental T2 value/maternal muscle T2 value.
SWI Venography
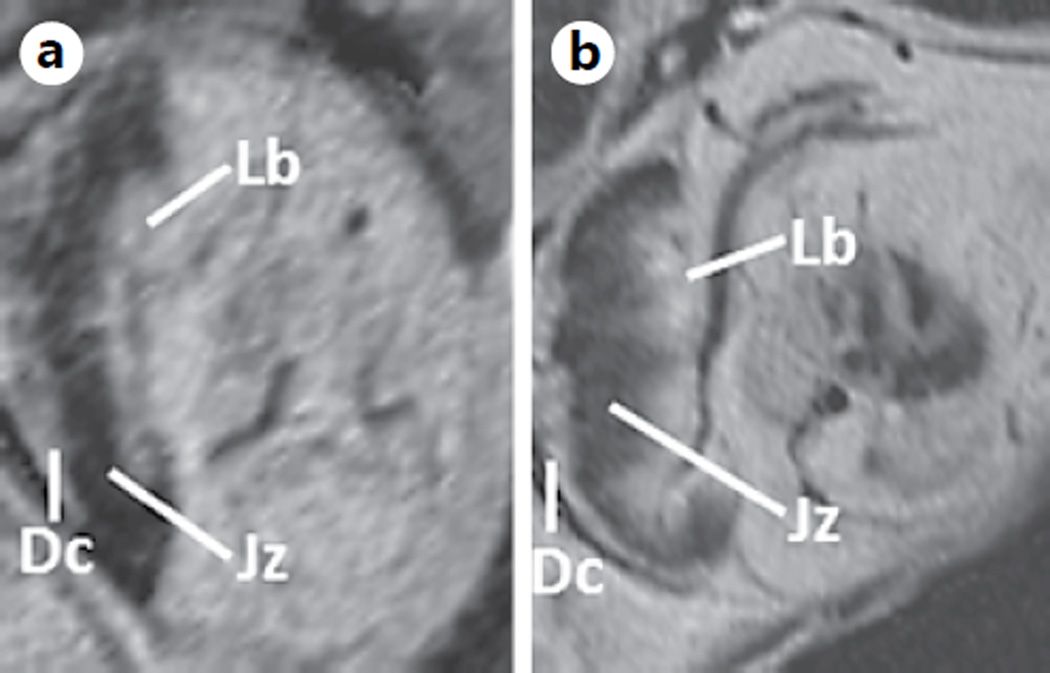
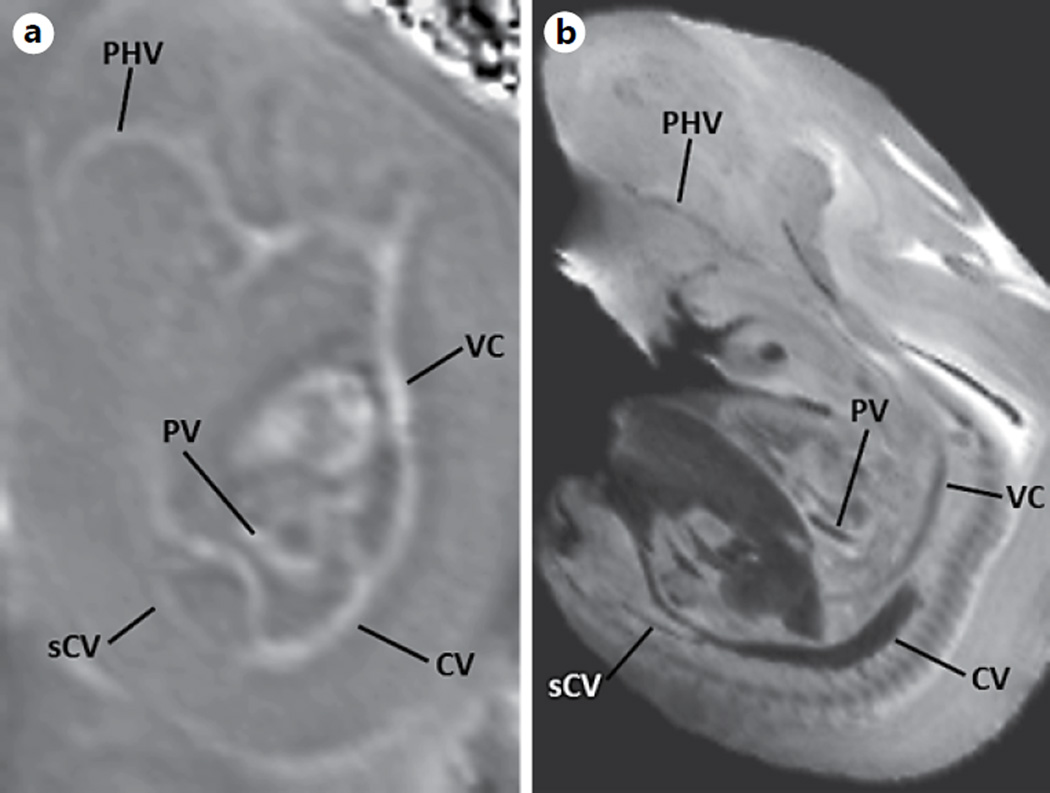
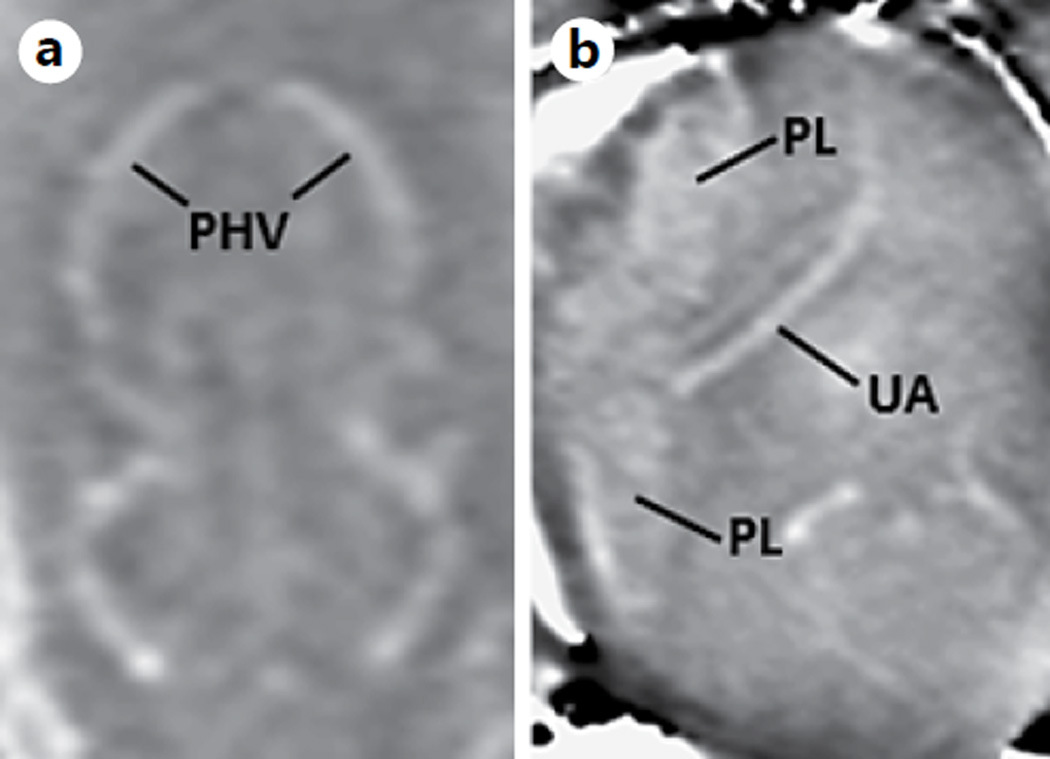
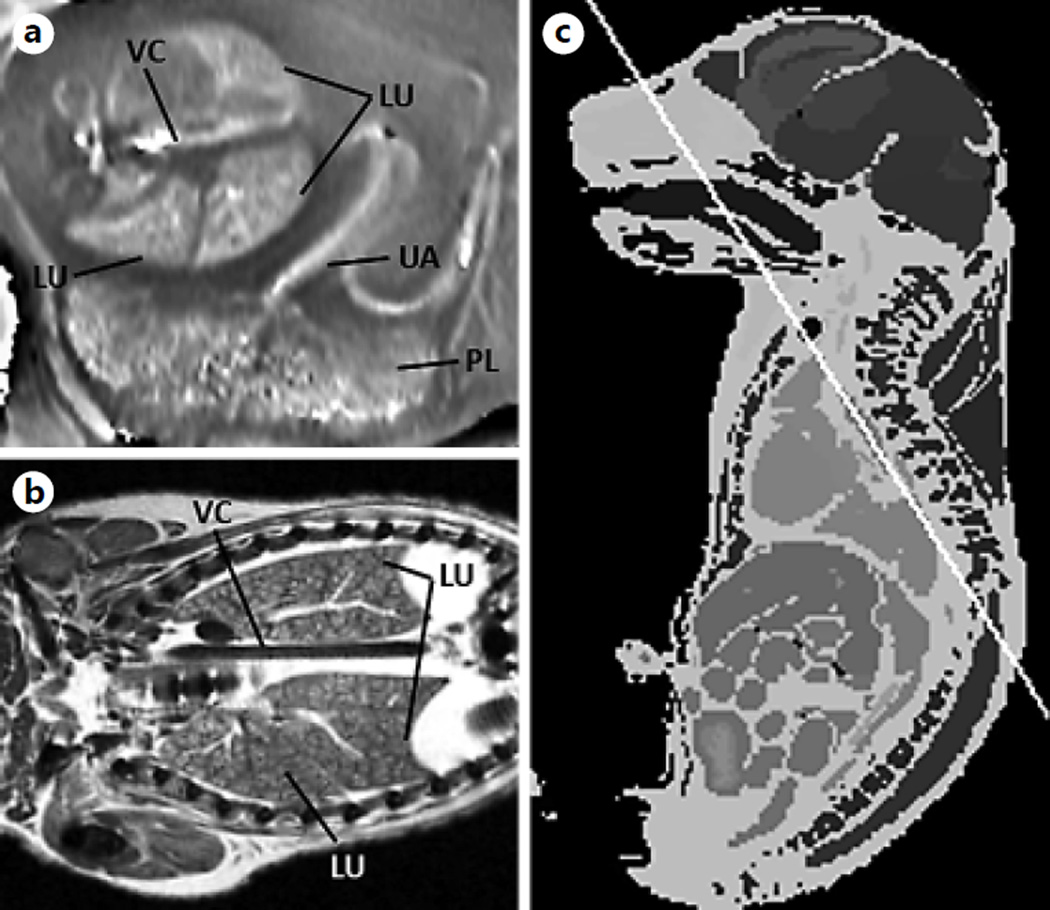
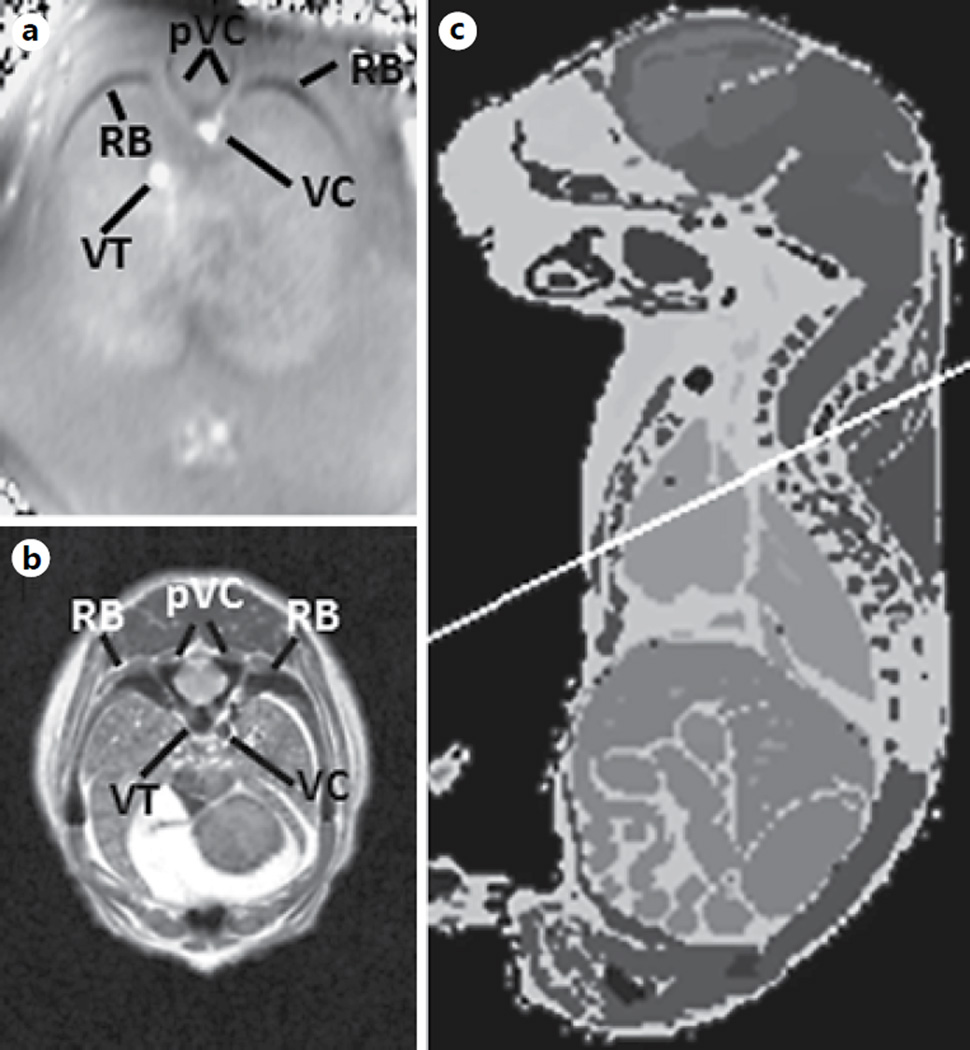
The processed SWI magnitude data showed a clear distinction between the 3 regions of the placenta, i.e. the labyrinth, the junctional zone, and the maternal decidua, on GD17. The heterogeneity of the placenta could be visualized even at an early gestational age (e.g. GD12) (fig. 3). This heterogeneous signal was not very evident in the T2-weighted images or T2 maps. The processed phase images show the major veins due to the presence of deoxyhemoglobin, which acts as an intrinsic contrast agent. For example, on GD12, the cardinal vein, vena cava, primary head vein, portal vein, and subcardial vein could be clearly visualized (fig. 4, 5). The umbilical arteries, as well as vascular organs such as the heart and placenta, were also visualized (fig. 4, 5). In addition to most of these structures, the well-developed lobes of the lung were also visualized on GD17 (fig. 6). The development of bony structures in the murine embryo by GD17 led to an increased contrast of such structures on phase images and could be distinguished easily from veins due to their diamagnetic phase signature [59]. Figure 7 shows murine bony structures, such as the ribs and vertebral body.
Fig. 3.
Processed SWI images showing the heterogeneity of the murine placenta on GD12 (a) and GD17 (b). Note the clear distinction between the 3 layers of the placenta. Lb = Labyrinth; Jz = junctional zone; Dc = decidua.
Fig. 4.
SWI venography. Processed SWI phase image of a fetus on GD12 (0.08 × 0.08 × 0.7 mm3) (a) and the corresponding slice from a high-resolution minimum-intensity projection (b) (0.05 × 0.05 × 0.1 mm3) adopted from the open-source eMouse Atlas Project (EMAP) (http://www.emouseatlas.org) [69, 77]. PHV = Primary head vein; VC = vena cava; CV = cardinal vein; sCV = subcardial vein; PV = portal vein.
Fig. 5.
Processed SWI phase images of a different fetus on GD12 (0.08 × 0.08 × 0.7 mm3). The primary head vein (a), the placenta and the umbilical artery (b) can be clearly seen. PHV = Primary head vein; PL = placenta; UA = umbilical artery.
Fig. 6.
SWI tissue contrast. Processed SWI phase images of the fetus on GD17. The processed SWI phase image on GD17 is shown (0.08 × 0.08 × 0.7 mm3) (a). The corresponding slice is from a high-resolution (0.058 × 0.058 × 0.58 mm3) atlas adopted from the Caltech open-source Mouse Atlas (http://mouseatlas.caltech.edu/) [69, 77] (b, c). LU = Lobes of the lungs; VC = vena cava; UA = umbilical artery; PL = placenta.
Fig. 7.
Visualization of bony structures. The processed SWI phase image of a fetus on GD17 is shown (0.08 × 0.08 × 0.7 mm3) (a). The corresponding slice from a high-resolution (0.058 × 0.058 × 0.58 mm3) atlas was adopted from the Caltech open source Mouse Atlas (http://mouseatlas.caltech.edu/) [69, 77] (b, c). pVC = Processes of the vertebral columns; RB = ribs; VC = vena cava; VT = veins in the thorax. Note the difference in contrast between the veins and the bones.
Discussion
Principal Findings of This Study
(1) Placental T2 values decrease with advancing gestational age in murine pregnancy, corresponding to normal physiological changes; (2) GRE T2 *-based images can distinguish distinct layers within the placenta beginning in mid-gestation (GD12), and (3) using SWI, the fetal venous vasculature and bony structures can be visualized without using exogenous contrast agents.
T2 Transverse Relaxation Time of the Murine Placenta
The T2 relaxation time in MRI is known to be sensitive to microenvironmental and metabolic changes [26, 28, 29, 60]. Previous reports in animal models have demonstrated the utility of the T2 transverse relaxation time in IUGR, mostly in late gestation [33]. This study aimed to assess the baseline T2 relaxation time values in normal murine placentas and their relationship with gestational age. This knowledge is necessary when evaluating such values in conditions associated with placental pathology. The decreasing trend in the T2 relaxation time with advancing gestation shown in the current study is consistent with what has been reported for human placentas [27, 34]. In general, the decreased T2 relaxation time values of a tissue can be attributed to one or more of the following factors: (1) an increase in the local deoxyhemoglobin concentration [28, 61] ; (2) an increase in the blood volume fraction [28, 61, 62]; (3) variations in blood flow [63]; (4) changes in the diffusion characteristics of the tissue microenvironment [28, 61, 62], and/or (5) morphological changes within the tissue itself. In addition, changes in maternal physiology may influence placental vascularization and perfusion and growth and have an impact on placental T2 relaxation values. Therefore, in this study we normalized the placental relaxation times by using maternal muscle tissue as an internal reference. However, a statistically significant difference remained in normalized placental T2 values. The blood supply to the fetuses can vary in the same dam depending on their location within the uterine horn [64]. This could be a contributing factor to the variation/ SD in placental T2 values at a given gestational age. With regard to the general applicability of the results to other strains of mice (e.g. C57B16), we anticipate that the general trend of decreasing T2 values with gestational age would be observed in them as well since placental perfusion characteristics are seen to evolve with gestational age. Nevertheless, due to differences in vascular density and tissue morphology between different strains of mice [65], the absolute T2 values may be different.
The murine placenta is heterogeneous and is composed of different regions: the labyrinth, the junctional zone, and the decidua. T2 or R2 (= 1/T2) maps of the placenta have been shown to distinguish between these regions at later gestational ages [33]. Using GRE T2*-based images, we have shown that these regions can be visualized distinctly even in mid-gestation (GD12). The ability to distinguish various layers within the placenta is important since such regions could be affected differently when there is a placental pathology [33].
SWI Venography of the Murine Placenta
Traditionally, visualization of the embryonic vascular development using MRI has been accomplished with external contrast agents [66, 67], usually in the ex vivo setting [67–69]. More recently, high-resolution 3-D imaging based on T2* differences as exogenous contrast have been applied to highlight such vasculature [37, 70]. In the current study, we report the use of SWI phase images to create venograms/skeletal reconstructions of the murine fetus. Phase images have the distinct advantage of high signal-to-noise ratios [71, 72] compared to magnitude MRI. The existence of huge susceptibility differences and perturbation of the phase beyond the vessel wall enables the detection of subvoxel structures [73]. Due to these features, SWI, which uses both magnitude and phase images, can be used as an alternative to image the developing venous vasculature of the fetus. Phase information also allows distinction between veins and bony structures because veins have a paramagnetic phase signature while bones (due to the presence of calcium) are diamagnetic in nature. SWI can also potentially be used to quantify the oxygen saturation in venous blood [74, 75].
MRI of small structures is a tradeoff between resolution, field of view, and acquisition time. In this study, we limited the SWI acquisition time to 14.5 min, which did not allow isotropic acquisitions. While the in-plane reconstructed resolution was 0.08 mm, the slice thickness was 0.8 mm. This highly asymmetric voxel size was a limiting factor for the visualization of small vessels in the slice direction. A close-to-isotropic voxel size would have enabled the creation of 3-D maps of the vasculature and the quantification of blood oxygenation. All slices were acquired in the axial orientation relative to the magnetic axis. This resulted in images on oblique planes relative to the fetus and was not consistent between fetuses due to their varying orientations within the uterine horn. The voxel aspect ratio and the oblique orientation inhibited the anatomical evaluation of smaller structures. Another limitation of our study is that a longitudinal evaluation of tissue property changes within the same placenta could not be performed. Although identification of the same fetus in longitudinal MRI examination is a challenge [76], such a study across gestation could help elucidate which of the placental regions contributes largely to the decrease in placental T2 relaxation with advancing gestational age.
Conclusions
Placental T2 relaxation times decrease with advancing gestational age in murine pregnancy, which may reflect normal gestational-age-dependent changes in placental perfusion. SWI can be used to visualize embryonic vascular development early in gestation without the use of any exogenous contrast agents.
Acknowledgements
This research was supported in part by the Perinatology Research Branch, Division of Intramural Research, Eunice Kennedy Shriver National Institute of Child Health and Human Development (NICHD), National Institutes of Health (NIH), Department of Health and Human Services (DHHS), and in part by federal funds from the NICHD (NIH, DHHS) under contract No. HHSN275201300006C. The authors are grateful to Dr. Theodore Price (Perinatology Research Branch), Dr. Lisa J. Brossia-Root, Laura Lee McIntyre, and all of the personnel of the Division of Laboratory Animal Resources (Wayne State University). This work was also supported in part by a Small Business Technology Transfer (STTR) grant from the National Heart, Lung, and Blood Institute (NHLBI, NIH, DHHS; 1R42HL112580-01A1), and by Wayne State University’s Perinatal Research Initiative and Perinatology Virtual Discovery Grant to J.N. (made possible by W.K. Kellogg Foundation award P3018205).
References
- 1.Wildman DE, et al. Evolution of the mammalian placenta revealed by phylogenetic analysis. Proc Natl Acad Sci USA. 2006;103:3203–3208. doi: 10.1073/pnas.0511344103. [DOI] [PMC free article] [PubMed] [Google Scholar]
- 2.Carter AM, Mess A. Evolution of the placenta in eutherian mammals. Placenta. 2007;28:259–262. doi: 10.1016/j.placenta.2006.04.010. [DOI] [PubMed] [Google Scholar]
- 3.Godfrey KM. The role of the placenta in fetal programming-a review. Placenta. 2002;23(suppl A):S20–S27. doi: 10.1053/plac.2002.0773. [DOI] [PubMed] [Google Scholar]
- 4.Benirschke K, Kaufmann P, Baergen RN. Pathology of the human placenta. Vol. 4 New York: Springer; 2006. [Google Scholar]
- 5.Watson ED, Cross JC. Development of structures and transport functions in the mouse placenta. Physiology (Bethesda) 2005;20:180–193. doi: 10.1152/physiol.00001.2005. [DOI] [PubMed] [Google Scholar]
- 6.Than NG, et al. A primate subfamily of galectins expressed at the maternal-fetal interface that promote immune cell death. Proc Natl Acad Sci USA. 2009;106:9731–9736. doi: 10.1073/pnas.0903568106. [DOI] [PMC free article] [PubMed] [Google Scholar]
- 7.Moffett A, Loke C. Immunology of placentation in eutherian mammals. Nat Rev Immunol. 2006;6:584–594. doi: 10.1038/nri1897. [DOI] [PubMed] [Google Scholar]
- 8.Dilworth MR, Sibley CP. Review: transport across the placenta of mice and women. Placenta. 2013;34(suppl):S34–S39. doi: 10.1016/j.placenta.2012.10.011. [DOI] [PubMed] [Google Scholar]
- 9.Longtine MS, Nelson DM. Placental dysfunction and fetal programming: the importance of placental size, shape, histopathology, and molecular composition. Semin Reprod Med. 2011;29:187–196. doi: 10.1055/s-0031-1275515. [DOI] [PMC free article] [PubMed] [Google Scholar]
- 10.Sibley CP, et al. Placental phenotypes of intrauterine growth. Pediatr Res. 2005;58:827–832. doi: 10.1203/01.PDR.0000181381.82856.23. [DOI] [PubMed] [Google Scholar]
- 11.Redman CW. Current topic: pre-eclampsia and the placenta. Placenta. 1991;12:301–308. doi: 10.1016/0143-4004(91)90339-h. [DOI] [PubMed] [Google Scholar]
- 12.Damodaram M, et al. Placental MRI in intrauterine fetal growth restriction. Placenta. 2010;31:491–498. doi: 10.1016/j.placenta.2010.03.001. [DOI] [PubMed] [Google Scholar]
- 13.Egbor M, et al. Pre-eclampsia and fetal growth restriction: how morphometrically different is the placenta? Placenta. 2006;27:727–734. doi: 10.1016/j.placenta.2005.06.002. [DOI] [PubMed] [Google Scholar]
- 14.Huppertz B, et al. Placental morphology: from molecule to mother – a dedication to Peter Kaufmann. A review. Placenta. 2006;27(suppl A):S3–S8. doi: 10.1016/j.placenta.2006.01.007. [DOI] [PubMed] [Google Scholar]
- 15.Chui A, et al. The expression of placental proteoglycans in pre-eclampsia. Gynecol Obstet Invest. 2012;73:277–284. doi: 10.1159/000333262. [DOI] [PubMed] [Google Scholar]
- 16.Cetin I, Antonazzo P. The role of the placenta in intrauterine growth restriction (IUGR) Z Geburtshilfe Neonatol. 2009;213:84–88. doi: 10.1055/s-0029-1224143. [DOI] [PubMed] [Google Scholar]
- 17.Benavides-Serralde A, et al. Changes in central and peripheral circulation in intrauterine growth-restricted fetuses at different stages of umbilical artery flow deterioration: new fetal cardiac and brain parameters. Gynecol Obstet Invest. 2011;71:274–280. doi: 10.1159/000323548. [DOI] [PubMed] [Google Scholar]
- 18.Barut A, et al. Placental chorangiosis: the association with oxidative stress and angiogenesis. Gynecol Obstet Invest. 2012;73:141–151. doi: 10.1159/000332370. [DOI] [PubMed] [Google Scholar]
- 19.McCarthy FP, et al. Animal models of preeclampsia; uses and limitations. Placenta. 2011;32:413–419. doi: 10.1016/j.placenta.2011.03.010. [DOI] [PubMed] [Google Scholar]
- 20.Elovitz MA, Mrinalini C. Animal models of preterm birth. Trends Endocrinol Metab. 2004;15:479–487. doi: 10.1016/j.tem.2004.10.009. [DOI] [PubMed] [Google Scholar]
- 21.Harding JE, et al. Animal studies of the effects of early nutrition on long-term health. Nestle Nutr Workshop Ser Pediatr Program. 2011;68:1–11. doi: 10.1159/000325645. discussion 11– 16. [DOI] [PubMed] [Google Scholar]
- 22.Schwitzgebel VM, Somm E, Klee P. Modeling intrauterine growth retardation in rodents: impact on pancreas development and glucose homeostasis. Mol Cell Endocrinol. 2009;304:78–83. doi: 10.1016/j.mce.2009.02.019. [DOI] [PubMed] [Google Scholar]
- 23.Georgiades P, Ferguson-Smith AC, Burton GJ. Comparative developmental anatomy of the murine and human definitive placentae. Placenta. 2002;23:3–19. doi: 10.1053/plac.2001.0738. [DOI] [PubMed] [Google Scholar]
- 24.Rossant J, Cross JC. Placental development: lessons from mouse mutants. Nat Rev Genet. 2001;2:538–548. doi: 10.1038/35080570. [DOI] [PubMed] [Google Scholar]
- 25.An H, et al. Evaluation of MR-derived cerebral oxygen metabolic index in experimental hyperoxic hypercapnia, hypoxia, and ischemia. Stroke. 2009;40:2165–2172. doi: 10.1161/STROKEAHA.108.540864. [DOI] [PMC free article] [PubMed] [Google Scholar]
- 26.Bandettini PA, et al. Spin-echo and gradientecho EPI of human brain activation using BOLD contrast: a comparative study at 1.5 T. NMR Biomed. 1994;7:12–20. doi: 10.1002/nbm.1940070104. [DOI] [PubMed] [Google Scholar]
- 27.Wright C, et al. Magnetic resonance imaging relaxation time measurements of the placenta at 1.5 T. Placenta. 2011;32:1010–1015. doi: 10.1016/j.placenta.2011.07.008. [DOI] [PMC free article] [PubMed] [Google Scholar]
- 28.Gossuin Y, Gillis P, Lo Bue F. Susceptibility-induced T2-shortening and unrestricted diffusion. Magn Reson Med. 2002;47:194–195. doi: 10.1002/mrm.10033. [DOI] [PubMed] [Google Scholar]
- 29.Thulborn KR, et al. Oxygenation dependence of the transverse relaxation time of water protons in whole blood at high field. Biochim Biophys Acta. 1982;714:265–270. doi: 10.1016/0304-4165(82)90333-6. [DOI] [PubMed] [Google Scholar]
- 30.Muhler MR, et al. Maternofetal pharmacokinetics of a gadolinium chelate contrast agent in mice. Radiology. 2011;258:455–460. doi: 10.1148/radiol.10100652. [DOI] [PubMed] [Google Scholar]
- 31.Alison M, et al. Measurement of placental perfusion by dynamic contrast-enhanced MRI at 4.7 T. Invest Radiol. 2013;48:535–542. doi: 10.1097/RLI.0b013e3182856a25. [DOI] [PubMed] [Google Scholar]
- 32.Salomon LJ, et al. Placental perfusion MR imaging with contrast agents in a mouse model. Radiology. 2005;235:73–80. doi: 10.1148/radiol.2351040192. [DOI] [PubMed] [Google Scholar]
- 33.Bobek G, et al. Magnetic resonance imaging detects placental hypoxia and acidosis in mouse models of perturbed pregnancies. PLoS One. 2013;8:e59971. doi: 10.1371/journal.pone.0059971. [DOI] [PMC free article] [PubMed] [Google Scholar]
- 34.Duncan KR, et al. The investigation of placental relaxation and estimation of placental perfusion using echo-planar magnetic resonance imaging. Placenta. 1998;19:539–543. doi: 10.1016/s0143-4004(98)91048-7. [DOI] [PubMed] [Google Scholar]
- 35.Kaufman MH, Bard JB. The Anatomical Basis of Mouse Development. Vol. 28. San Diego: Academic Press; 1999. [Google Scholar]
- 36.Turnbull DH, Mori S. MRI in mouse developmental biology. NMR Biomed. 2007;20:265–274. doi: 10.1002/nbm.1146. [DOI] [PMC free article] [PubMed] [Google Scholar]
- 37.Parasoglou P, et al. High-resolution MRI of early-stage mouse embryos. NMR Biomed. 2013;26:224–231. doi: 10.1002/nbm.2843. [DOI] [PMC free article] [PubMed] [Google Scholar]
- 38.Degani S. Fetal cerebrovascular circulation: a review of prenatal ultrasound assessment. Gynecol Obstet Invest. 2008;66:184–196. doi: 10.1159/000143157. [DOI] [PubMed] [Google Scholar]
- 39.Zatik J, et al. Comparison of cerebral blood flow velocity as measured in preeclamptic, healthy pregnant, and nonpregnant women by transcranial Doppler sonography. Gynecol Obst Invest. 2001;51:223–227. doi: 10.1159/000058054. [DOI] [PubMed] [Google Scholar]
- 40.Matsuda Y, et al. Cerebral magnetic resonance angiographic findings in severe preeclampsia. Gynecol Obstet Invest. 1995;40:249–252. doi: 10.1159/000292346. [DOI] [PubMed] [Google Scholar]
- 41.Reichenbach JR, et al. High-resolution MR venography at 3.0 Tesla. J Comput Assist Tomogr. 2000;24:949–957. doi: 10.1097/00004728-200011000-00023. [DOI] [PubMed] [Google Scholar]
- 42.Cho Z, Ro Y, Lim T. NMR venography using the susceptibility effect produced by deoxyhemoglobin. Magn Reson Med. 1992;28:25–38. doi: 10.1002/mrm.1910280104. [DOI] [PubMed] [Google Scholar]
- 43.Haacke EM, et al. Susceptibility weighted imaging (SWI) Magn Reson Med. 2004;52:612–618. doi: 10.1002/mrm.20198. [DOI] [PubMed] [Google Scholar]
- 44.Mittal S, et al. Susceptibility-weighted imaging: technical aspects and clinical applications. Part 2. AJNR Am J Neuroradiol. 2009;30:232–252. doi: 10.3174/ajnr.A1461. [DOI] [PMC free article] [PubMed] [Google Scholar]
- 45.Haacke EM, et al. Susceptibility-weighted imaging: technical aspects and clinical applications. Part 1. AJNR Am J Neuroradiol. 2009;30:19–30. doi: 10.3174/ajnr.A1400. [DOI] [PMC free article] [PubMed] [Google Scholar]
- 46.Reichenbach JR, et al. Small vessels in the human brain: MR venography with deoxyhemoglobin as an intrinsic contrast agent. Radiology. 1997;204:272–277. doi: 10.1148/radiology.204.1.9205259. [DOI] [PubMed] [Google Scholar]
- 47.Wu Z, et al. Identification of calcification with MRI using susceptibility-weighted imaging: a case study. J Magn Reson Imaging. 2009;29:177–182. doi: 10.1002/jmri.21617. [DOI] [PMC free article] [PubMed] [Google Scholar]
- 48.Thomas B, et al. Clinical applications of susceptibility weighted MR imaging of the brain - a pictorial review. Neuroradiology. 2008;50:105–116. doi: 10.1007/s00234-007-0316-z. [DOI] [PubMed] [Google Scholar]
- 49.Ashwal S, et al. Susceptibility-weighted imaging and proton magnetic resonance spectroscopy in assessment of outcome after pediatric traumatic brain injury. Arch Phys Med Rehabil. 2006;87:S50–S58. doi: 10.1016/j.apmr.2006.07.275. [DOI] [PubMed] [Google Scholar]
- 50.Lequin MH, et al. Magnetic resonance imaging in neonatal stroke. Semin Fetal Neonatal Med. 2009;14:299–310. doi: 10.1016/j.siny.2009.07.005. [DOI] [PubMed] [Google Scholar]
- 51.Neelavalli J, et al. Magnetic resonance venography of the fetal brain using susceptibility weighted imaging. J Magn Reson Imaging. doi: 10.1002/jmri.24476. in press. [DOI] [PMC free article] [PubMed] [Google Scholar]
- 52.Mody S, Yeo L, Neelavalli J, Thomason ME, Hernandez-Andrade E, Hassan S, Romero R, Haacke EM. Susceptibility weighted imaging of the fetal brain is superior to ultrasound and conventional MRI sequences in detecting intracranial hemorrhage. Ultrasound Obstet Gynecol. 2013 [Google Scholar]
- 53.Guide for the Care and Use of Laboratory Animals. ed 8. Washington: National Academies Press; 2011. [PubMed] [Google Scholar]
- 54.Yankeelov TE, et al. Comparison of a reference region model with direct measurement of an AIF in the analysis of DCE-MRI data. Magn Reson Med. 2007;57:353–361. doi: 10.1002/mrm.21131. [DOI] [PubMed] [Google Scholar]
- 55.Jenkinson M. Fast, automated, N-dimensional phase-unwrapping algorithm. Magn Reson Med. 2003;49:193–197. doi: 10.1002/mrm.10354. [DOI] [PubMed] [Google Scholar]
- 56.Wang Y, et al. Artery and vein separation using susceptibility-dependent phase in contrast-enhanced MRA. J Magn Reson Imaging. 2000;12:661–670. doi: 10.1002/1522-2586(200011)12:5<661::aid-jmri2>3.0.co;2-l. [DOI] [PubMed] [Google Scholar]
- 57.Haacke E, et al. Susceptibility-weighted imaging: technical aspects and clinical applications. Part 1. Am J Neuroradiol. 2009;30:19–30. doi: 10.3174/ajnr.A1400. [DOI] [PMC free article] [PubMed] [Google Scholar]
- 58.Pinheiro J, Bates D. Mixed-effects models in S and S-PLUS. New York: Springer; 2000. [Google Scholar]
- 59.Wu Z, et al. Identification of calcification with MRI using susceptibility-weighted imaging: a case study. J Magn Reson Imaging. 2009;29:177–182. doi: 10.1002/jmri.21617. [DOI] [PMC free article] [PubMed] [Google Scholar]
- 60.Gillis P, Koenig SH. Transverse relaxation of solvent protons induced by magnetized spheres: application to ferritin, erythrocytes, and magnetite. Magn Reson Med. 1987;5:323–345. doi: 10.1002/mrm.1910050404. [DOI] [PubMed] [Google Scholar]
- 61.Brooks RA, Moiny F, Gillis P. On T2-shortening by weakly magnetized particles: the chemical exchange model. Magn Reson Med. 2001;45:1014–1020. doi: 10.1002/mrm.1135. [DOI] [PubMed] [Google Scholar]
- 62.Jensen J, Chandra R. NMR relaxation in tissues with weak magnetic inhomogeneities. Magn Reson Med. 2000;44:144–156. [PubMed] [Google Scholar]
- 63.Derwig I, et al. Association of placental T2 relaxation times and uterine artery Doppler ultrasound measures of placental blood flow. Placenta. 2013;34:474–479. doi: 10.1016/j.placenta.2013.03.005. [DOI] [PubMed] [Google Scholar]
- 64.Raz T, et al. The hemodynamic basis for positional-and inter-fetal dependent effects in dual arterial supply of mouse pregnancies. PLoS One. 2012;7:e52273. doi: 10.1371/journal.pone.0052273. [DOI] [PMC free article] [PubMed] [Google Scholar]
- 65.Rennie MY, et al. Expansion of the fetoplacental vasculature in late gestation is strain dependent in mice. Am J Physiol Heart Circ Physiol. 2012;302:H1261. doi: 10.1152/ajpheart.00776.2011. [DOI] [PMC free article] [PubMed] [Google Scholar]
- 66.Chapon C, et al. In utero time-course assessment of mouse embryo development using high resolution magnetic resonance imaging. Anat Embryol (Berlin) 2002;206:131–137. doi: 10.1007/s00429-002-0281-6. [DOI] [PubMed] [Google Scholar]
- 67.Berrios-Otero CA, et al. Three-dimensional micro-MRI analysis of cerebral artery development in mouse embryos. Magn Reson Med. 2009;62:1431–1439. doi: 10.1002/mrm.22113. [DOI] [PMC free article] [PubMed] [Google Scholar]
- 68.Petiet AE, et al. High-resolution magnetic resonance histology of the embryonic and neonatal mouse: a 4D atlas and morphologic database. Proc Natl Acad Sci USA. 2008;105:12331–12336. doi: 10.1073/pnas.0805747105. [DOI] [PMC free article] [PubMed] [Google Scholar]
- 69.Dhenain M, Ruffins SW, Jacobs RE. Three-dimensional digital mouse atlas using high-resolution MRI. Dev Biol. 2001;232:458–470. doi: 10.1006/dbio.2001.0189. [DOI] [PubMed] [Google Scholar]
- 70.Berrios-Otero CA, et al. In utero phenotyping of mouse embryonic vasculature with MRI. Magn Reson Med. 2012;67:251–257. doi: 10.1002/mrm.22991. [DOI] [PMC free article] [PubMed] [Google Scholar]
- 71.Haacke EM, Reichenbach JR. Susceptibility Weighted Imaging in MRI: Basic Concepts and Clinical Applications. New York: Wiley; 2011. [Google Scholar]
- 72.Duyn JH, et al. High-field MRI of brain cortical substructure based on signal phase. Proc Natl Acad Sci USA. 2007;104:11796–11801. doi: 10.1073/pnas.0610821104. [DOI] [PMC free article] [PubMed] [Google Scholar]
- 73.Xu Y, Haacke EM. The role of voxel aspect ratio in determining apparent vascular phase behavior in susceptibility weighted imaging. Magn Reson Imaging. 2006;24:155–160. doi: 10.1016/j.mri.2005.10.030. [DOI] [PubMed] [Google Scholar]
- 74.Haacke E, et al. Susceptibility mapping as a means to visualize veins and quantify oxygen saturation. J Magn Reson Imaging. 2010;32:663–676. doi: 10.1002/jmri.22276. [DOI] [PMC free article] [PubMed] [Google Scholar]
- 75.Neelavalli J, Jella PK, Krishnamurthy UB, Buch S, Haacke EM, Yeo L, Mody S, Katkuri Y, Bahado-Singh RO, Hassan SS, Romero R, Thomaso ME. Measuring venous blood oxygenation in fetal brain using susceptibility weighted imaging. J Magn Reson Imaging. 2014;39 doi: 10.1002/jmri.24245. [DOI] [PMC free article] [PubMed] [Google Scholar]
- 76.Avni R, et al. Unique in utero identification of fetuses in multifetal mouse pregnancies by placental bidirectional arterial spin labeling MRI. Magn Reson Med. 2012;68:560–570. doi: 10.1002/mrm.23246. [DOI] [PMC free article] [PubMed] [Google Scholar]
- 77.Jacobs RE, et al. MRI: volumetric imaging for vital imaging and atlas construction. Nat Rev Mol Cell Biol. 2003;(suppl):SS10–SS16. [PubMed] [Google Scholar]


