Abstract
Recent studies have suggested that the characteristics of prompt gammas (PG) emitted from excited nuclei during proton therapy are advantageous for determining beam range during treatment delivery. Since PGs are only emitted while the beam is on, the feasibility of using PGs for online treatment verification depends greatly on the design of highly efficient detectors. The purpose of this work is to characterize how PG detection changes as a function of distance from the patient as a means of guiding the design and usage of clinical prompt gamma imaging detectors. Using a Monte Carlo model (GEANT4.9.4) we studied the detection rate (PGs per incident proton) of a high purity Germanium detector for both the total PG emission and the characteristic 6.13 MeV PG emission from 16O emitted during proton irradiation. The PG detection rate was calculated as a function of distance from the isocenter of the proton treatment nozzle for: (1) a water phantom irradiated with a proton pencil beam and (2) a prostate patient irradiated with a scanning beam proton therapy treatment field (lateral field size: ~6 cm × 6 cm, beam range: 23.5 cm). An analytical expression of the PG detection rate as a function of distance from isocenter, detector size, and proton beam energy was then developed. The detection rates were found to be 1.3 × 10⁻⁶ for oxygen and 3.9 × 10⁻⁴ for the total PG emission, respectively, with the detector placed 11 cm from isocenter for a 40 MeV pencil beam irradiating a water phantom. The total PG detection rate increased by ~85±3% for beam energies greater than 150 MeV. The detection rate was found to be approximately 2.1 × 10⁻⁶ and 1.7 × 10⁻³ for oxygen and total PG emission, respectively, during delivery of a single pencil beam during a scanning beam treatment for prostate cancer. The PG detection rate as a function of distance from isocenter during irradiation of a water phantom with a single proton pencil beam was described well by the model of a point source irradiating a cylindrical detector of a known diameter over the range of beam energies commonly used for proton therapy. For the patient studies, it was necessary to divide the point source equation by an exponential factor in order to correctly predict the falloff of the PG detection rate as a function of distance from isocenter.
Keywords: Proton therapy, prompt gamma, range verification, Monte Carlo
1. Introduction
To overcome beam range uncertainties inherent to proton therapy (Knopf and Lomax, 2013; Paganetti, 2012), many researchers have been actively studying methods of in vivo range verification based on the measurement of secondary gammas emitted during proton beam irradiation (Min et al., 2006; Paans and Schippers, 1993; Parodi et al., 2008; Testa et al., 2009). During proton therapy, proton-nucleus interactions produce two distinct types of secondary gammas: positron annihilation (PA) gammas, and characteristic prompt gammas (PG). PA gammas are emitted when proton-nuclear interactions produce short lived positron emitting isotopes that result in the production of coincident 511 keV gammas. Alternatively, PGs are created by the decay process of an elemental nucleus to its ground state following excitation due to proton-nuclear scatter. Since the excited states of nuclei are quantized, a unique energy spectrum of PGs is emitted from each element within the tissues irradiated during proton therapy.
Recent studies by several research groups have shown a strong correlation between the region of PG emission and dose deposition by the treatment beam, including both measurement and Monte Carlo (MC) studies in simple phantoms (Bom et al., 2012; Kim et al., 2009; Kormoll et al., 2011; Le Foulher et al., 2010; Min et al., 2006; Roellinghoff et al., 2011; Verburg et al., 2013), as well as MC studies in CT based patient geometry (Gueth et al., 2013; Moteabbed et al., 2011). The findings of these studies have led to an increased interest in PG emission as a means of measuring the in vivo range of proton beams and verifying treatment delivery, thus reducing the magnitude of the uncertainties associated with proton therapy.
However, since PGs emitted are much higher in energy (2 MeV – 10 MeV) than most gammas used in medical imaging (< 1 MeV), current gamma imaging systems used for PET and SPECT imaging do not possess adequate detection efficiency and spatial resolution to make imaging of PGs emitted during proton therapy possible (Park et al., 2010; Richard et al., 2009). This has led to a large amount of work to design new systems for PG measurements that are adequate for use in a clinical proton therapy environment (Frandes et al., 2010; Kang and Kim, 2009; Kim et al., 2009; Min et al., 2012; Smeets et al., 2012). These studies propose a wide range of detection methods for PG imaging based on either the total emission signal, or the signal from individual elemental emission lines measured during irradiation. However, due to the limited number of PGs emitted during treatment delivery, all methods have one thing in common: the need to maximize PG detection during treatment delivery. Therefore, to maximize the achievable PG detection rate during proton beam delivery, it is necessary to understand the spatial and spectral characteristics of the PG emission from the patient.
The purpose of this work was to characterize the detection rate (PGs per proton) as a function of distance from isocenter of the treatment nozzle and detector size for prompt gammas emitted during scanning beam proton therapy. We performed the study of PG detection rates using the following four steps:
Step 1: We first calibrated our MC model of PG detection during proton beam irradiation using a measured PG spectrum from water, which we defined as our “standard calibration conditions”. For the calibration, we simulated PG detection for the measurement conditions and developed a calibration factor used to correct the output of the MC model so that it accurately predicted the measured PG detection rate for the standard calibration conditions.
Step 2: Next, using the calibrated MC model we studied the simple case of proton pencil beams (ranging from 40 MeV – 225 MeV) irradiating a water phantom as a function of proton beam energy, distance from isocenter, and detector size to provide a baseline understanding of how PG detection rates change for these factors. Using the results obtained with the calibrated MC model, we developed an analytical expression to predict PG detection rates for the detector used in this study.
Step 3: We studied changes to PG detection rate versus distance for the delivery of a scanning beam treatment of a patient with prostate cancer. The clinical study was performed for three beam delivery scenarios in which PG measurements could potentially be used in the determination of the in vivo treatment beam range: (1) the delivery of a single pencil beam to the distal edge of the treatment field, (2) delivery of the full layer of pencil beams to the distal edge of the treatment field, and (3) delivery of the full multi-energy layer treatment field. The analytical expression of PG detection rate developed in Step 2 was modified to account for differences between the results of the baseline and clinical case studies. These differences are then discussed in terms of tissue composition/density in the patient.
Step 4: We used the results of the PG detection rate study in Step 3 to estimate the maximum distance from isocenter that the detector used in our study could be placed and still measure adequate PG signal to make in vivo range verification possible.
2. Materials and Methods
For this work, we developed an MC model for calculating PG emission during proton beam irradiations using GEANT4.9.4 (Agostinelli et al., 2003). Version 9.4 was chosen over more recent versions of GEANT4 due to changes in the nuclear interaction models for versions 9.5 and newer of the code that led to a sharp decrease in the calculated elemental PG emission (Geant4 Online Users Forum, 2012b). This model, developed and validated by Peterson et al. (2009), was based upon the University of Texas M.D. Anderson scanning beam proton therapy treatment nozzle. We incorporated the ability to calculate PG detection with a high purity germanium (HPGe) detector by adding the HPGe detector and BGO Compton-suppression shielding geometry and gamma scoring from a validated MC model developed by Polf et al. (2009b) into the scanning beam model. Finally, the abilities to load patient CT data and model proton beam interactions within the patient were incorporated into the MC model providing the option to calculate prompt gamma emission from either a rectangular water phantom or a patient irradiated during scanning beam proton treatment delivery. An overview of the MC model and the calculations carried out for this study is given in the following sections. For a detailed explanation of the scanning beam nozzle, the HPGe geometry, and the particle tracking and energy cutoffs used in this model, the reader is referred to the original papers outlining the model development (Mackin et al., 2012a; Peterson et al., 2010; Polf et al., 2009a).
2.1 Monte Carlo Model
For this model, primary protons and secondary neutrons, alpha particles, protons, electrons, and gammas were tracked. Electromagnetic interactions (including gamma interactions in the HPGe) were calculated using the G4EmLivermorePhysics and G4EmExtraPhysics models. Elastic and inelastic nuclear interactions and the resulting de-excitation of the nucleus were calculated using the G4DecayPhysics, G4HadronElasticPhysics, G4QStoppingPhysics, G4NeutronTrackingCut, G4IonBinaryCascadePhysics, and HadronPhysicsQGSP_BIC models. A maximum step size in all geometry elements in the model of 1 cm was set for all particles tracked. A particle range cut of 1 mm was set for all particles, at which point the creation of secondary particles is curtailed and the remaining particle energy was deposited over the length of the final step.
In our previous MC studies of PG emission (Polf et al., 2009b), we found that GEANT4.9.1 predicted the location of the main 16O PG emission line at 6.05 MeV, which we also found to be true for GEANT4.9.4. This was because in the GEANT4.9 photo-evaporation model the dominate transitions for the (6.13 MeV, 2+), (6.92 MeV, 2+) and (7.12 MeV, Jπ=1−) excited states of 16O are the cascade to the lowest (6.05 MeV, 0+) excited state followed by relaxation to the ground state through the emission of a 6.05 MeV PG. However, the 6.05 MeV energy line is not found in the measured PG spectrum from water used in this study or in other published spectra (Polf et al., 2013; Verburg et al., 2013). Therefore, we set the probability to zero for higher energy states to transition to the 0+ state in the 16O photo-evaporation data library file (z8.a16) for all MC calculations performed in this study, resulting in a shift in the 16O emission line to 6.13 MeV in agreement with the measured spectra.
A schematic drawing of the MC model geometry is shown in Figure 1. The model geometry included all elements of the treatment nozzle, which interact with the proton beam. The model incorporates magnetic steering of the pencil beam and is capable of simulating the delivery of patient treatment plans developed using a commercial treatment planning system. The front face of the HPGe was positioned inside of the Compton-suppression shield and offset by 1.5 cm from the front edge of the shielding. This resulted in the HPGe detector being positioned 1.5 cm further from isocenter than the front edge of the outer shielding. For example, when we defined the detection system to be 50 cm from isocenter, the HPGe detector is actually located 51.5 cm from isocenter. The detector and shielding are centered on the treatment isocenter (x = 0 cm and z = 0 cm), and oriented perpendicular to the central axis of the treatment nozzle as shown in Figure 1. The detector position in the y-direction was varied to study PG detection rate as a function of distance.
Figure 1.
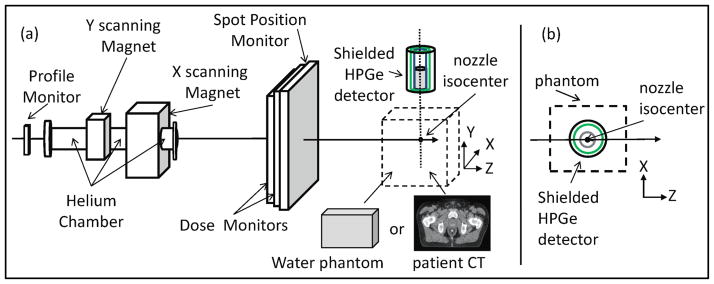
Schematic drawing of (a) the modeled scanned beam treatment nozzle with all components labeled and the high purity Germanium detector (gray cylinder) housed inside of a shield consisting of an outer lead cylinder (black cylinder) and an inner cylinder of BGO detectors (green cylinder) to provide Compton suppression of the measured spectra. The beam target is either a slab water phantom or a patient CT dataset placed at isocenter of the treatment nozzle. (b) A top view is shown of the HPGe placement in the XZ-plane with respect to the phantom. Figure not drawn to scale.
Finally, for the beam target, either a homogeneous water phantom or a patient CT phantom is defined and placed at isocenter. The water phantom was 20 cm × 20 cm × 35 cm in size and centered laterally (x–y plane) on the beam axis (z-direction) and the z-position was set such that the proton beam Bragg peak was always located at isocenter. The patient CT phantom consisted of 41 CT slices (512 pixels × 512 pixels, 2.5 mm thick, 50 cm field of view) and was always positioned such that patient isocenter (center of the prostate) was located at the isocenter of the treatment nozzle (x = 0 cm, y = 0 cm, z = 0 cm).
Proton dose deposition and secondary gamma emission in the water phantom and patient CT phantom, as well as gamma interactions in the detector are scored by the MC model in voxelized histograms. The voxel size was 0.5 mm × 0.5 mm × 0.5 mm for the water phantom and set to the size of the CT grid in the patient CT phantom. Since the measured spectrum used to validate our MC model was obtained using a detector with a Compton-suppression shield, we setup the scoring of prompt gammas in Compton suppressed energy spectrum histograms. This meant that any gamma that scattered in the HPGe detector, then sequentially interacted in the BGO shielding was not scored in the spectrum.
For simulations in the CT phantom, the CT numbers for each voxel were converted into tissue and density values. Using a generic CT-to-density conversion table provided with the GEANT4 dicom user example, the CT number for each voxel was converted to a physical density value. Then based on the assigned density value, the material which most closely matches the voxel density in a density-to-tissue table was assigned to the voxel. The density-to-tissue conversion table used in our model contained ten materials: air, lung inhale, lung exhale, adipose tissue, breast, adult soft tissue, muscle, liver, trabecular bone, and dense bone. The composition and density of air was taken from ICRU 49 (ICRU, 1993) and the compositions and densities of each material was defined according to ICRU 46 (ICRU, 1992).
2.2 Monte Carlo Calculations
2.2.1 Model Calibration
To calibrate the output of our MC model, we calculated the PG spectrum detected by the modeled HPGe detector with a geometrical setup identical to those used to measure PG emission spectrum from a 10 cm × 10 cm × 10 cm water phantom using the same experimental beamline and HPGe detector (7 cm diameter, 8 cm thickness) as described by Polf et al. (2009b) with no lead collimation placed in front of the detector. For these experimental conditions, the HPGe detector was oriented perpendicular to the beam central axis, and our “standard calibration conditions” were defined as: (1) a 40 MeV (σE = 1 MeV, σx = 0.3 cm, and σz = 0.5 mm) proton pencil beam, (2) 17.5 cm detector distance from isocenter (12.5 cm from the edge of the water phantom), (3) detector size of 7 cm diameter.
To determine the PG detection rate per incident proton, we normalized the spectrum to the total number of protons incident on the phantom for the MC simulation and the measurement to get PG emission per incident proton. Then we calculated the area under the 6.13 MeV peak in the spectrum to determine the 16O detection rate. Next, we summed the spectrum from 0 MeV to 7 MeV (excluding the 511 keV annihilation gamma emission line) to determine the total PG detection rate.
To ensure our MC model could accurately predict the measured PG detection rates, the MC calculated and measured detection rates under standard calibration conditions were compared to determine a calibration factor (CF) for our MC model. The CF is defined as: , where and are the measured and MC calculated detection rates for the calibration conditions (denoted by superscript “C”). A separate CF was determined for the 16O (CF16O) and total (CFtotal) PG emission. Then assuming CF16O and CFtotal were constant, we determined the 16O and total PG detection rates to be:
| (1a) |
and
| (1b) |
where is the MC calculated 16O detection rate and is the MC calculated total PG detection rate for a given beam energy (E), distance from isocenter (y), detector diameter (D). For this formulation, the and obtained from MC calculations performed for the calibration conditions [ (40 MeV, 17.5 cm, 7 cm) or (40 MeV, 17.5 cm, 7 cm)] will simply reduce to the measured PG detection rates ( ) for 16O or total PGs, respectively.
2.2.2 Water Phantom Studies
For these studies, the treatment nozzle was not included in the MC model geometry. We simulated a single mono-energetic pencil beam with initial energies of 40, 70, 100, 150, and 225 MeV incident on the water phantom with a 7 cm diameter HPGe detector placed next to the phantom as described in section 2.1. We studied the PG detection rate of the HPGe detector positioned at distances ranging from 11.6 cm (at the edge of water phantom) to 61.5 cm from isocenter. To study changes to the PG detection rate as a function of detector size, calculations were performed for a 100 MeV pencil beam at each distance for HPGe detector diameters of 3 cm, 7 cm, and 15 cm.
2.2.3 Patient CT Studies
For calculations using the patient phantom, we included the scanning beam treatment nozzle geometry and modeled the beam energy, initial energy spectrum, and divergence according to the manufacturer (Hitachi, Ltd., Tokyo, Japan) specifications (Peterson et al., 2009). For this study, we simulated the delivery of a scanning beam proton therapy treatment for prostate cancer consisting of a ~6 cm × 6 cm treatment field using 10 energy layers ranging from 165 MeV to 190 MeV to deliver a 4 cm spread out Bragg peak. We performed calculations for the delivery of: (1) only the central pencil beam from the deepest layer (190 MeV), (2) the full deepest energy layer, or (3) the full multi-energy layer treatment field (165 MeV – 190 MeV). Changes to the PG detection rate were calculated for each treatment case with the HPGe detector positioned at distances ranging from 26.1 cm (edge of CT phantom) to 75.1 cm from isocenter. For these calculations, a detector diameter of 15 cm was used to maximize PG detection rate and thus, minimize MC calculation time.
For each treatment delivery scenario studied, and were plotted as a function of detector distance from isocenter. We compared and for the prostate case to that obtained for the water phantom study. In this manner we could determine the effect of the patient and the delivery of a full multi-energy layer treatment field on the PG detection rate.
3. Results and Discussion
3.1 MC model Calibration
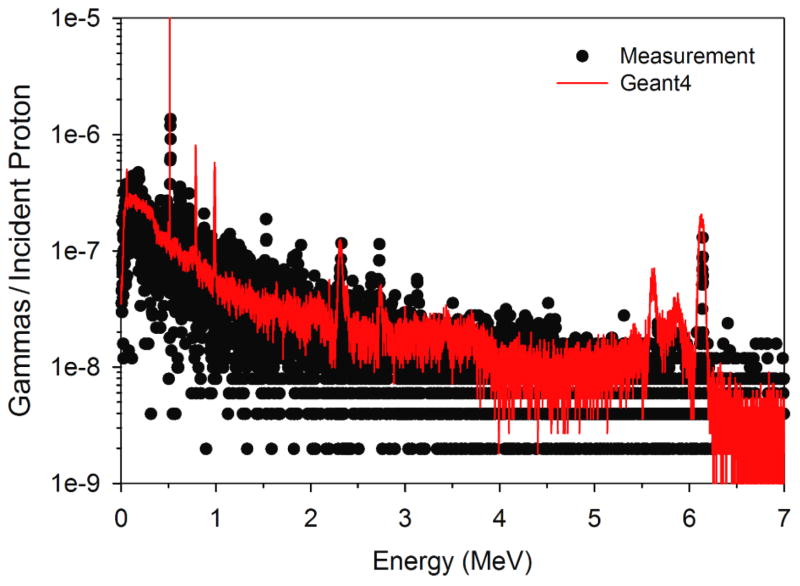
A comparison of the measured gamma spectrum from water and the spectrum calculated with our MC model is shown in Figure 2. Overall good agreement was found between the calculated and measured spectrum. One significant difference between the measured PG spectrum and our MC calculations was in the width of the 6.13 MeV 16O emission PG line. GEANT4.9.4 adds nuclear Doppler broadening to the 16O emission line, a feature that at the time of this study could not be disabled (Geant4 Online Users Forum, 2012a) without modification of the GEANT4 source code. The degree of Doppler broadening did not agree with the measured spectrum for the 6.13 MeV emission line, which was much narrower (FWHM ~30 keV). This broadening resulted in an increase in the area under the MC calculated 6.13 MeV emission line of approximately a factor of fourteen (14) over that of the measured emission line. This finding is consistent with those of Le Foulher et al. (2010) who reported that GEANT4.9.1 over predicted PG emission yields by a factor of ~12 during carbon ion beam irradiations. Based on these findings we decided to only integrate the MC calculated 6.13 MeV over the full width half maximum of the measured emission line from 6.115 MeV to 6.145 MeV to produce the PG emission intensity used to determine the detection rate for each detector size and distance (for each beam energy) studied.
Figure 2.
Measured secondary gamma spectrum from water irradiated with a 40 MeV proton beam compared to PG spectrum calculated with our Geant4.9.4 based MC model.
Under standard calibration conditions, we found for 16O and for total PG to be 6.1 × 10⁻⁷ and 1.82 × 10⁻⁴ respectively, and for 16O and for total PG to be 9.48 × 10⁻⁷ and 2.71 × 10⁻⁴, respectively. This produced values of CF16O = 0.64 and CFtotal = 0.67. These values were used to determine the PG detection rates as described in equations 1a and 1b. From this result we see that by integrating only over the energy width of the measured 16O emission line the measured and MC calculated 16O detection rates differed by only a factor of ~1.5 as opposed to a factor of 14 found when the entire MC calculated 16O emission line was used.
3.2 Water phantom studies
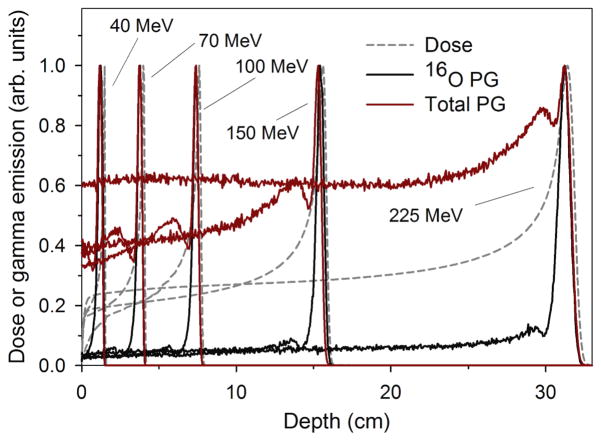
The MC calculated dose deposition, as well as the 16O and total PG production in the water phantom are shown in figure 3. These calculated results predict that the 16O PG emission is sharply peaked toward the end of the beam range, between 1–5 mm proximal to the Bragg peak for beam energies ranging from 40 MeV to 225 MeV. This is due to the 6.13 MeV PG emission cross-section increasing to a maximum between proton energies of ~10–20 MeV, and decreasing sharply as the proton energy decreases (Dyer et al., 1981; Kiener et al., 1998). Figure 3 also shows a sharp peak in the total gamma emission in water, due to the contribution of the 16O PG emission. However, in contrast to 16O PG emission, the total gamma emission has a significant component in the entrance/plateau region prior to the Bragg peak. Since the 16O PG emission was sharply peaked near the BP, we hypothesized that as a function of distance, the 16O PG detection rate should fit that of a point source irradiating a cylindrical detector. However, this may not be the case for the total gamma emission.
Figure 3.
Comparison of dose, 16O PG emission, and total gamma emission as a function of depth in a water phantom for proton beam energies used in this study.
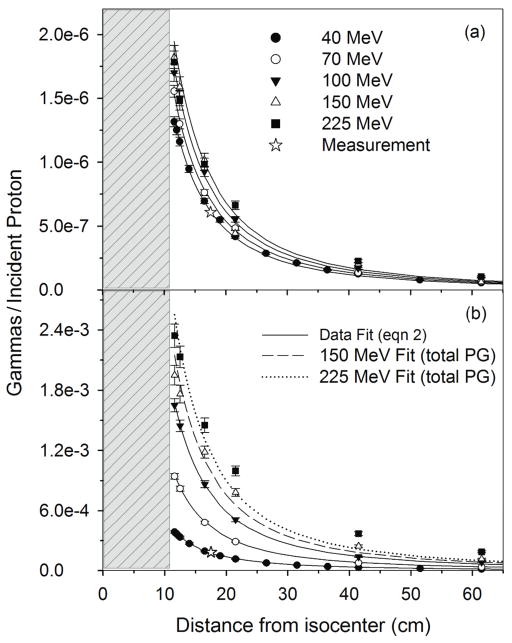
To test this hypothesis, we fit the and values for each detector location to an analytical expression as a function of detector distance from isocenter as shown in Figure 4. The analytical expression was based upon the theoretical formulation of a point source irradiating a cylindrical detector (Tsoulfanidis and Landsberger, 2011) given by the equation,
Figure 4.
(a) and (b) for the 7 cm diameter HPGe from irradiation of the 20 cm × 20 cm × 35 cm water phantom as a function of detector distance from nozzle isocenter. Data is shown for the measurement at 40 MeV and 17.5 cm distance, MC calculations (data points) with proton beam energies of 40, 70, 100, 150, and 225 MeV and for the data fit using equation 2. Error bars represent 1-sigma statistical uncertainty of the MC data. The gray region represents the position of the water phantom with respect to isocenter (0 cm).
| (2) |
where , y and D are the same as defined in section 2.21, and CE is a fitting parameter dependent on the proton beam energy (E). For equation 2, the term in the square brackets is related to the solid angle subtended by the detector. In this analytical formulation, the PG detection rate is determined by applying correction factors to the measured calibration value to account for effects of beam energy (CE) and detector size and distance (term in brackets in equation 2).
We found that the 16O PG detection rate increases slightly from a value of 1.3 × 10⁻⁶ at 40 MeV at a distance of 11 cm from isocenter up to a maximum of 1.8 × 10⁻⁶ for beam energies of 150 MeV and above. The values of CE for the 16O PG detection rates for the 40 MeV beam was chosen so that IPG at 17.5 cm distance for the 7 cm diameter detector was equal to the measured 16O detection rate under calibration conditions (6.1 × 10⁻⁷ PGs/proton), which yielded a CE value of 103. CE fit values increased as the beam energy increased up to 150 MeV. For energies above this, CE had a constant value of 140. For all proton beam energies used in this study, the 16O PG detection rate is predicted well by equation 2.
The total PG detection rate for the 40 MeV beam at 11 cm from isocenter was 3.9 × 10⁻⁴ and increased up to 2.3 × 10⁻³ for the 225 MeV beam. For the fitting of the total PG detection rate, the CE fit value for the 40 MeV beam was also chosen so that IPG at 17.5 cm distance for the 7 cm diameter detector was equal to the measured total PG detection rate under calibration conditions (1.82 × 10⁻⁴ PGs/proton), also yielding a CE value of 103. As the beam energy increased, CE increased continuously up to a value of 600 for the 225 MeV beam. As a function of distance total PG detection rate was accurately predicted by equation 2 for low beam energies (< 150 MeV), however, as the beam energy (and thus, the beam range) increases the falloff no longer fits the point source model.
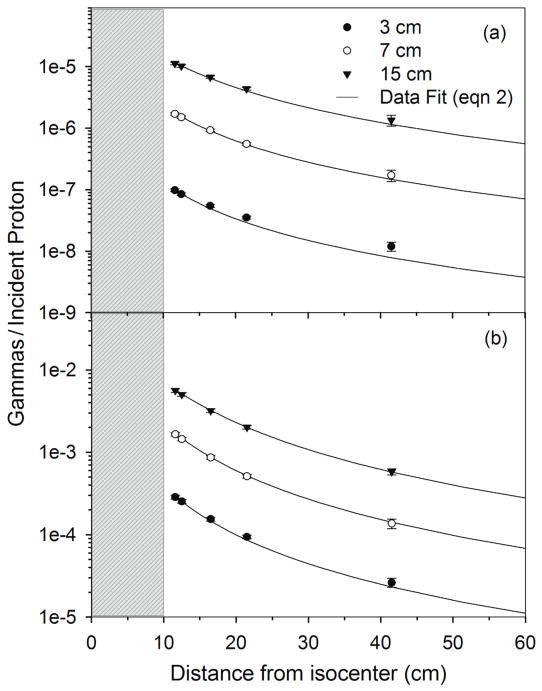
Additionally, as shown in Figure 5, the 16O PG detection rate fits the point source model for all detector diameters studied. The falloff of the total PG detection rate fits equation 2 well for 7 cm and 15 cm diameter detectors, but the falloff is seen to differ from equation 2 for the 3 cm detector. This indicates that the point source model of equation 2 works for total PG detection for larger detectors, but begins to fail for smaller detector sizes.
Figure 5.
(a) and (b) from the 20 cm × 20 cm × 35 cm phantom irradiated with a 100 MeV beam and scored in HPGe detectors of increasing diameter as a function of distance from isocenter. Data is shown for MC calculations (data points) with detector diameters of 3 cm, 7 cm, and 15 cm and for the data fit using equation 2. Error bars represent 1-sigma statistical uncertainty in MC data. The gray region represents the position of the water phantom with respect to isocenter (0 cm).
3.3 Patient CT studies
Figure 6 shows an example of the simulated dose deposition, the 16O emission, and the total PG emission in the patient CT phantom for the delivery of a clinical prostate treatment plan. These images indicate a strong correlation between the PG emission and dose delivery. One dimensional (1D) profiles are plotted in Figure 7 of the dose, total PG, 16O PG, and CT numbers taken along the central axis of the treatment beam (Figure 6a). From the dose profile, we see that the proton beam stops at approximately z = −2 cm, which is 2 cm beyond the center of the detector (isocenter). Also, we see that the 16O emission distal falloff occurs at the same depth as the distal edge of the deepest energy layer. Conversely, the maximum of the total PG occurs only a few centimeters below the surface of the patient in the femoral head. We believe this is due to several factors, namely: (1) the femoral bone is very dense resulting in a large increase in PG emission rate as predicted by Polf et al. (2009a), and (2) in tissue the total emission contains PGs from calcium and carbon in addition to oxygen, and tissues rich in these elements will produce a higher total emission signal. The results for total PG emission shown in Figures 6 and 7 agree well with published patient PG emission studies by Moteabbed et al. (2011).
Figure 6.
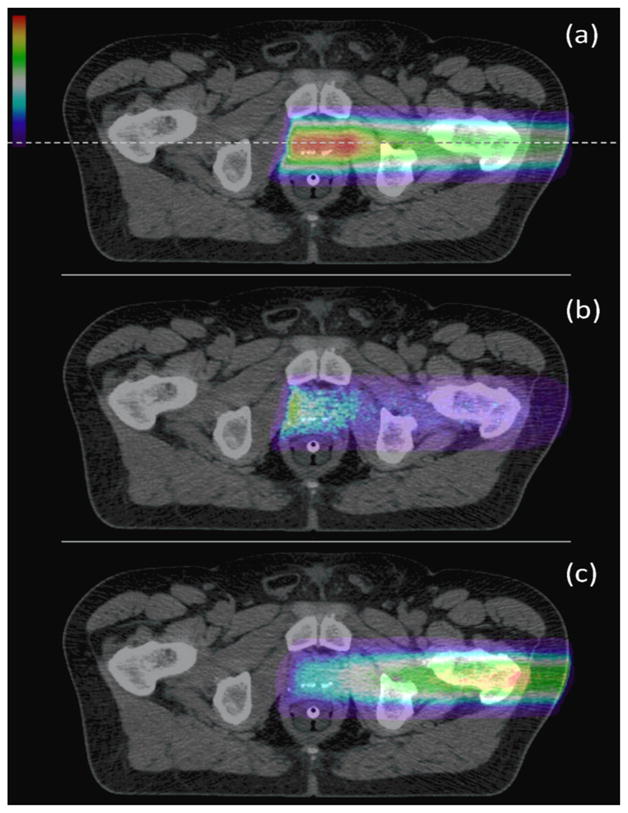
(a) Dose deposition, (b) 16O PG emission, and (c) total PG emission (each normalized to its respective maximum value) from the delivery of a prostate treatment field in the patient CT phantom. The dashed lines indicates the position of the 1D profile taken for comparison of the dose and PG emission to tissue type (represented by CT number) in the patient.
Figure 7.
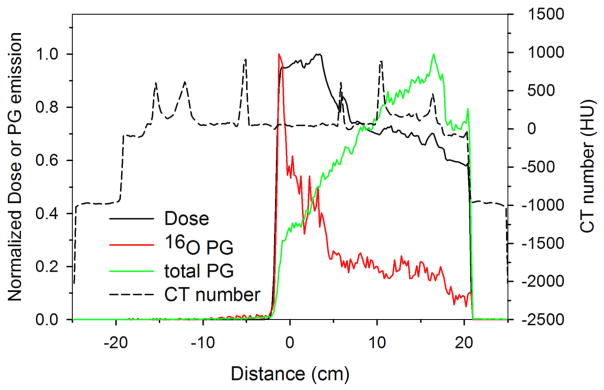
Profiles along the central axis of the beam (dashed line in figure 6) of dose, 16O PG emission, and total PG emission are shown. Changes to the dose and PG emission with respect to tissue type can be seen by comparing the profiles to the plotted CT number profile.
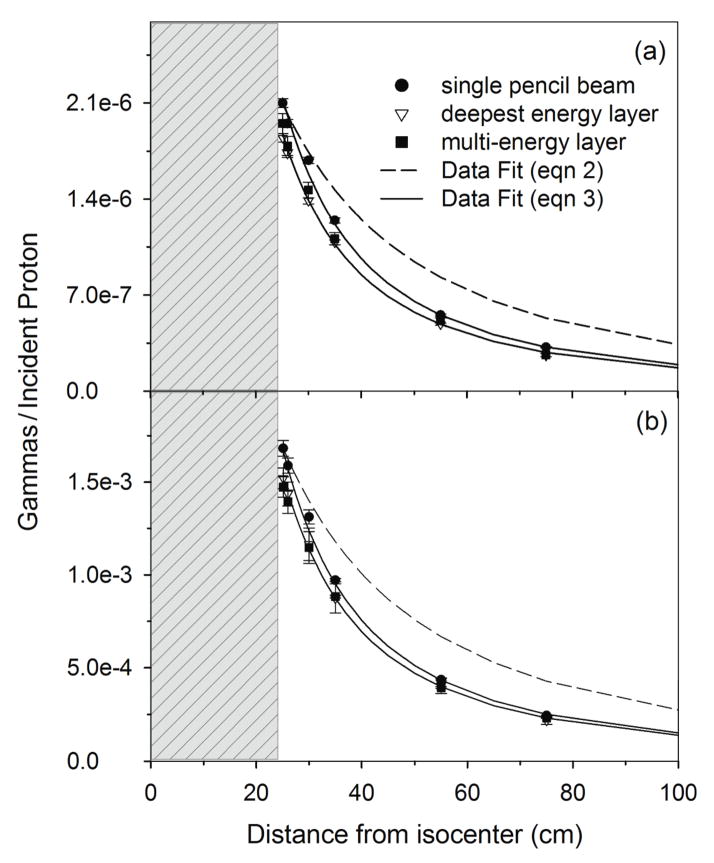
Figure 8 shows the falloff of the 16O and total PG detection rate from the patient as a function of distance from isocenter for a single beam spot, the deepest energy layer, and the full multi-energy layer delivery of the prostate patient plan. For the analytical fitting of the data, since the maximum clinical beam energy was 190 MeV, CE values of 150 and 550 were used for the 16O and total PG detection rates, respectively based on the values obtained in the water phantom study. From Figure 8, it is clear that the PG intensity does not follow the point source model from equation 2 as a function of distance. In fact, both the 16O and total PG emission decrease at a much faster rate close to the patient and begin to approach that of the point source model at larger distances. We believe this is due to increased scatter and attenuation of the PG emission as a result of the amount of tissue and the presence of high density tissues, such as bone, in the patient. Therefore, to fit the PG data from the patient we modified the point source model of equation 2 to account for the patient as such,
Figure 8.
(a) and (b) from a patient during delivery of a scanning beam treatment. Data is shown for MC calculations of the delivery of a single pencil beam, the deepest energy layer of the treatment field, and all energy layers for the treatment field. Error bars represent 1-sigma statistical uncertainty of the MC data. Fits are shown of the MC data to the point source model of equation 2 and the modified point source model of equation 3. The gray region represents the position of the patient with respect to isocenter (0 cm).
| (3) |
where , y, D, and CE, are the same as defined for equation 2. PF (defined as the “patient factor”) is used to account for changes in the PG detection rate that occurred when the water phantom was replaced with the prostate patient. PF is defined by the exponential rise to maximum function:
| (4) |
where a and b are fitting parameters. This modification results in the model predicting the steep initial falloff at close distances and approaching that of the point source model as the term in the denominator approaches unity at large distances. We found that using a single value of b = 0.03, for the single pencil beam, deepest layer, and multi-energy layer cases and a = 2.4, 2.15, and 2.13, for 16O PGs and a = 1.6, 1.47, and 1.43, for total PGs, for the three clinical cases respectively, to determine PF allowed the model to accurately predict the PG detection rates for the clinical case.
The 16O PG and total PG detection rates were the highest for the single pencil beam irradiation, followed by the single layer and full multi-energy layer delivery cases. Additionally, the 16O PG emission intensity from the patient was higher than for the water phantom irradiations (for distances greater than 25 cm). We hypothesize this is due to the presence of higher density tissues (i.e. bone) within the patient.
3.4 Maximum detector distance estimation
As an example, using the calculated 16O PG detection rates from equation 3 (~2.0 × 10⁻⁶ per proton at 1 cm distance) and an approximate number of protons delivered per 2 Gy fraction of ~108 (Smeets et al., 2012), even with our detector placed as close as 1 cm from the patient, only ~200 oxygen PGs would be detected. As reported by Mackin et al. (2012b; 2012c), for a statistical image reconstruction method developed for PG imaging (Mackin technique), at least 105 PGs are required to localize the distal PG emission falloff with 1–2 mm accuracy. Therefore, our HPGe detector would not measure adequate 16O PG signal to localize the distal edge of the PG emission with adequate accuracy using the Mackin technique. The use of a detector with higher detection efficiency or an array of detectors would be required. However, using equation 3 and the total PG signal, we see that the detector could be placed a maximum of 35 cm from the patient and still detect the 105 PGs necessary to allow 1–2 mm accuracy in localizing the PG emission falloff with the Mackin technique. The maximum allowable distance from the patient using the total PG signal could be further increased by using a more efficient detection system or by using an array of detectors placed around the patient.
4. Conclusions
Results of this study illustrate that the point source based models described in equations 2 and 3 were and were not able to predict the PG detection rate as a function of distance from isocenter. In particular, for the baseline water phantom study, the point source model accurately predicted the falloff of PG detection rate vs. distance for proton pencil beams with energies less than 150 MeV and detector diameters greater than 3 cm. However, the simple point source model had to be modified by an exponential “patient factor” to accurately predict the falloff of the PG detection rate versus distance in the prostate patient study. Our study yielded similar changes to detection rates as a function of distance for phantom studies as those published by Smeets et al. (2012) for 16O PG emission detection with a knife-edge slit camera. We believe this indicates that the models outlined in this study may provide a reasonable prediction of elemental PG detection rates versus distance for both collimated and uncollimated detectors, given proper calibration and curve fitting based on individual detector parameters.
By determining the fitting parameters for equation 3 for a given detector (based on detector material, collimation, shape, size, etc.) and knowing how many PGs are needed for the particular image reconstruction method employed, we believe this method could be used to guide PG detector placement during scanning beam proton therapy. While this study illustrates use of the modified point-source model for the relatively homogeneous case of prostate cancer, further studies for more complicated and heterogeneous treatment sites (such as lung, central nervous system, etc.) are needed to determine the applicability of this model for these cases.
As a first step in this study, we calibrated our MC model against a “standard calibration” experimental setup. The setup conditions consisted of: one beam energy, a single detector distance from isocenter, and a single detector position with respect to the water phantom. Due to the rigid placement of the detector and limitations on proton beam energies available at the facility where the measurements were performed, measured spectra from water at only one detector location and beam energy were available. Therefore, further measurement-MC model comparisons at different beam energies and detector positions would be necessary to provide a full and robust validation that the CF values used in this study are constant for the HPGe detector as we assumed.
Acknowledgments
This work was supported by Award Number R21CA137362 from the National Cancer Institute. The content is solely the responsibility of the authors and does not necessarily represent the official views of the National Cancer Institute or the National Institute of Health. Measurements of the prompt gamma spectrum were performed at the Texas A&M University Cyclotron Institute.
References
- Agostinelli S, et al. GEANT4-a simulation toolkit. Nucl Instrum Methods Phys Res A. 2003;506:250–303. [Google Scholar]
- Bom V, Joulaeisadeh F, Beekman F. Real-time prompt gamma monitoring in spot-scanning proton therapy using imaging through a knife-edge-shaped slit. Phys Med Biol. 2012;57:297–308. doi: 10.1088/0031-9155/57/2/297. [DOI] [PubMed] [Google Scholar]
- Dyer P, Bodansky D, Seamster AG, Norman EB, Maxson DR. Cross sections relevant to gamma-ray astronomy: Proton induced reactions. Phys Rev C. 1981;23:1865–82. doi: 10.1103/physrevc.32.1873. [DOI] [PubMed] [Google Scholar]
- Frandes M, Zoglauer A, Maxim V, Prost R. A tracking Compton-scattering imaging system for hadron therapy monitoring. IEEE Trans Nucl Sci. 2010;57:144–50. [Google Scholar]
- Geant4 Online Users Forum. Change in G4PreCompound model. 2012a posted by: V Ivanchenko, url: http://hypernews.slac.stanford.edu/HyperNews/geant4/get/hadronprocess/1192.html.
- Geant4 Online Users Forum. Nuclear de-excitiation in 4.9.5. 2012b posted by: D Mackin, url: http://hypernews.slac.stanford.edu:5090/HyperNews/geant4/get/hadronprocess/1252.html.
- Gueth P, Dauvergne D, Freud N, Letang JM, Ray C, Testa E, Sarrut D. Machine learning-based patient specific prompt-gamma dose monitoring in proton therapy. Phys Med Biol. 2013;58:4563–77. doi: 10.1088/0031-9155/58/13/4563. [DOI] [PubMed] [Google Scholar]
- ICRU. Photon, electron, proton, and neutron interaction data for body tissues. Bethesda, MD: International Commission on Radiation Units and Measurements; 1992. [Google Scholar]
- ICRU. Clinical Proton Dosimetry Part I: Beam Production, Delivery, and Measurement of Absorbed Dose. Bethesda, MD: International Commission on Radiation Units and Measurements; 1993. [Google Scholar]
- Kang BH, Kim JW. Monte Carlo design study of a gamma detector system to locate distal dose falloff in proton therapy. IEEE Trans Nucl Sci. 2009;56:46–50. [Google Scholar]
- Kiener J, Berheide M, Achouri NL, Boughrara A, AC, Lefebvre F, de Oliveira Santos F, Vieu C. Gamma ray production by inelastic proton scattering on 16O and 12C. Phys Rev C. 1998;28:2174–9. [Google Scholar]
- Kim D, Yim H, Kim J-W. Pinhole camera measurements of prompt gamma rays for detection of beam range in proton therapy. J Kor Physi Soc. 2009;55:1673–6. [Google Scholar]
- Knopf AC, Lomax A. In vivo proton range verification: a review. Phys Med Biol. 2013;58:R131–60. doi: 10.1088/0031-9155/58/15/R131. [DOI] [PubMed] [Google Scholar]
- Kormoll T, Fiedler F, Schone S, Wustemann J, Zuber K, Enghardt W. Compton imager for in vivo dosimetry fo proton beams-a design study. Nucl Intstrum Methods Phys Res A. 2011;626–627:114–9. [Google Scholar]
- Le Foulher F, et al. Monte Carlo Simulations of Prompt-Gamma Emission During Carbon Ion Irradiation. IEEE Trans Nucl Sci. 2010;57:2768–72. [Google Scholar]
- Mackin D, Peterson S, Beddar S, Polf J. Evaluation of a stochastic reconstruction algorithm for use in Compton camera imaging and beam range verification from secondary gamma emission during proton therapy. Phys Med Biol. 2012a;57:3537–53. doi: 10.1088/0031-9155/57/11/3537. [DOI] [PMC free article] [PubMed] [Google Scholar]
- Mackin D, Peterson S, Polf J, Beddar S. SU-E-J-79: Using the Distance of Closest Approach to Improve Compton Camera Image Quality. Med Phys. 2012b;39:3670. doi: 10.1118/1.4734914. [DOI] [PubMed] [Google Scholar]
- Mackin D, Polf J, Peterson S, Beddar S. MO-G-BRA-06: Three-Stage Compton Camera Image Resolution Losses Due Detector Effects. Med Phys. 2012c;39:3882. [Google Scholar]
- Min CH, Kim CH, Youn M, Kim J. Prompt Gamma Measurements for Locating Dose falloff Region in Proton Therapy. App Phys Lett. 2006;89:183517, 1–3. [Google Scholar]
- Min CH, Lee HR, Kim CH, Lee SB. Development of array-type prompt gamma measurement system for in vivo range verification in proton therapy. Med Phys. 2012;39:2100–7. doi: 10.1118/1.3694098. [DOI] [PubMed] [Google Scholar]
- Moteabbed M, Espana S, Paganetti H. Monte Carlo patient study on the comparison of prompt gamma and PET imaging for range verification in proton therapy. Phys Med Biol. 2011;56:1063–82. doi: 10.1088/0031-9155/56/4/012. [DOI] [PubMed] [Google Scholar]
- Paans A, Schippers J. Proton therapy in combination with PET as monitor: a feasibility study. IEEE Trans Nucl Sci. 1993;40:1041–4. [Google Scholar]
- Paganetti H. Range uncertainties in proton therapy and the role of Monte Carlo simulations. Phys Med Biol. 2012;57:R99–117. doi: 10.1088/0031-9155/57/11/R99. [DOI] [PMC free article] [PubMed] [Google Scholar]
- Park MS, Lee W, Kim JM. Estimation of proton dose ditribution by means of three-dimansional reconstruction of prompt gamma rays. App Phys Lett. 2010;97:153705, 1–2. [Google Scholar]
- Parodi K, Bortfeld T, Enghardt W, Fiedler F, Knopf A, Paganetti H, Pawelke J, Shakirin G, Shih H. PET imaging for treatment verification of ion therapy: Implementation and experience at GSI and MGH. Nucl Intstrum Methods Phys Res A. 2008;591:282–6. [Google Scholar]
- Peterson S, Polf JC, Bues M, Ciangaru G, Archambalt L, Beddar S, Smith AR. Experimental validation of a monte carlo proton therapy nozzle model incorporating magnetically steered protons. Phys Med Biol. 2009;54:3217–29. doi: 10.1088/0031-9155/54/10/017. [DOI] [PubMed] [Google Scholar]
- Peterson SW, Roberts D, Polf JC. Optimizing a 3-stage Compton camera for measuring prompt gamma rays emitted during proton radiotherapy. Phys Med Biol. 2010;55:6841–56. doi: 10.1088/0031-9155/55/22/015. [DOI] [PMC free article] [PubMed] [Google Scholar]
- Polf J, Peterson S, Ciangaru G, Gillin M, Beddar S. Prompt gamma-ray emission from biological tissues during proton irradiation: a preliminary study. Phys Med Biol. 2009a;54:731–43. doi: 10.1088/0031-9155/54/3/017. [DOI] [PubMed] [Google Scholar]
- Polf JC, Panthi R, Mackin DS, McCleskey M, Saastamoinen A, Roeder BT, Beddar S. Measurement of characteristic prompt gamma rays emitted from oxygen and carbon in tissue-equivalent samples during proton beam irradiation. Phys Med Biol. 2013;58:5821–31. doi: 10.1088/0031-9155/58/17/5821. [DOI] [PMC free article] [PubMed] [Google Scholar]
- Polf JC, Peterson S, McCleskey M, Roeder BT, Spiridon A, Beddar S, Trache L. Measurement and calculation of characterisitic prompt gamma ray spectra emitted during proton irradiation. Phys Med Biol. 2009b;54:N519–N27. doi: 10.1088/0031-9155/54/22/N02. [DOI] [PubMed] [Google Scholar]
- Richard MH, et al. IEEE Nucl Sci Sympos Conf Record. Orlando FL: IEEE; 2009. Design study of a Compton camera for prompt gamma imaging during ion beam therapy. [Google Scholar]
- Roellinghoff F, et al. Design of a Compton camera for 3D prompt gamma imaging during ion beam therapy. Nucl Intstrum Methods Phys Res A. 2011;648:s20–s3. [Google Scholar]
- Smeets J, et al. Prompt gamma imaging with a slit camera for real-time range control in proton therapy. Phys Med Biol. 2012;57:3371–405. doi: 10.1088/0031-9155/57/11/3371. [DOI] [PubMed] [Google Scholar]
- Testa E, et al. Dose profile monitoring with carbon ion beams by means of prompt-gamma measurements. Nucl Intstrum Methods Phys Res B. 2009;267:993–6. [Google Scholar]
- Tsoulfanidis N, Landsberger S. Measurement and Detection of Radiation. Boca Raton, FL: CRC Press, Taylor Francis Group; 2011. [Google Scholar]
- Verburg JM, Riley K, Bortfeld T, Seco J. Energy- and time-resolved detection of prompt gamma-rays for proton range verification. Phys Med Biol. 2013;58:L37–49. doi: 10.1088/0031-9155/58/20/L37. [DOI] [PubMed] [Google Scholar]


