

Abstract
The link between glucose and HbA1c at steady state has previously been described using steady-state or longitudinal relationships. We evaluated five published methods for prediction of HbA1c after 26/28 weeks using data from four clinical trials. Methods (1) and (2): steady-state regression of HbA1c on fasting plasma glucose and mean plasma glucose, respectively, (3) an indirect response model of fasting plasma glucose effects on HbA1c, (4) model of glycosylation of red blood cells, and (5) coupled indirect response model for mean plasma glucose and HbA1c. Absolute mean prediction errors were 0.61, 0.38, 0.55, 0.37, and 0.15% points, respectively, for Methods 1 through 5. This indicates that predictions improved by using mean plasma glucose instead of fasting plasma glucose, by inclusion of longitudinal glucose data and further by inclusion of longitudinal HbA1c data until 12 weeks. For prediction of trial outcome, the longitudinal models based on mean plasma glucose (Methods 4 and 5) had substantially better performance compared with the other methods.
In 2012, it was estimated that the total cost of diagnosed diabetes in United States alone was $245 billion.1 In order to lower such expenses, there is a clear need for development of cost-effective and safe antidiabetic medicine. At the same time, pharmaceutical companies are struggling to improve R&D productivity2 and to fulfill the needs of the growing patient population.3 Key drivers for increased productivity are correct decision making with regard to early selection of candidates and doses—and improved decision making is likely to lead to lower attrition rate in phase II and III.2
In development of antidiabetic medicine, the use of different biomarkers at each development stage4 represents one of the main challenges for taking such decisions in drug development. Early clinical studies are typically of short duration, and efficacy is measured using biomarkers that reach steady state within a fairly short timeframe. Dependent on mode of action, efficacy is either assessed using glucose infusion rates from a glucose clamp study, glucose excursions following glucose tolerance tests, or simply by measurements of plasma glucose (typically fasting plasma glucose (FPG)). Clamp tests and glucose tolerance tests often need to be performed in an inpatient setting, whereas plasma glucose measurements can also be performed at home (self-measured plasma glucose (SMPG)), providing the opportunity of frequent assessment of treatment effect. Clearly, both FPG values analyzed in a laboratory, and SMPG values can be biased and hard to interpret due to various factors such as inconsistency in reporting concentration in blood or plasma values and day-to-day variation.5,6
Although debated, the predictive power of HbA1c for development of long-term complications of diabetes is indeed strong.7,8 Based on this, steady-state values of HbA1c have been chosen as the main efficacy end point for confirmatory phase III trials.9,10 In contrast, early clinical trials are often of short duration, not allowing HbA1c to reach steady state, and hence, values of glucose at steady state are often used as the main efficacy end point. Thus, in order to predict efficacy outcomes in confirmatory trials (based on early trial data), a translation from values of posttreatment steady-state glucose to posttreatment steady-state HbA1c is needed.
The correlation between HbA1c and FPG has previously been established in several studies.11,12 Similar relations have been proposed for the relationship between HbA1c and mean plasma glucose (MPG) calculated from 24-h glucose profiles based on either 7- to 11-point SMPG profiles or continuous measurements.13,14 Measuring FPG is less of a burden from a patient's point of view. The drawback of using FPG for efficacy measurement is that the effect of drugs that mainly target the postprandial glucose (PPG) might not be accurately captured. As HbA1c is a function of overall glycemic exposure,15,16 one would expect more accurate predictions of HbA1c based on MPG values compared with FPG values.
Although steady-state relations between glucose and HbA1c have been calculated on large populations of subjects, they have generally not been tested and compared for prediction of clinical trial outcome across different types of treatments. Also, due to their inherent structure, they do not take into account the physiological and longitudinal relations between glucose and HbA1c when subjects are under investigation in a clinical trial. Thus, new methods have been proposed that incorporate physiologic knowledge relating glucose measures to HbA1c and enable longitudinal descriptions of HbA1c.17,18,19
A direct comparison of methods for prediction of confirmatory trial outcome based on early trial data can both provide guidance on which methods to select for prediction of HbA1c and inform trial design with regard to the choice between FPG and 7-to 11-point SMPG profiles and the choice of sampling schedule. To our knowledge, no extensive comparison of methods for predicting HbA1c across trials and treatments has been published. In this study, we evaluated the possibility of predicting phase III efficacy outcomes using different data sources (FPG, MPG, and early HbA1c).
Results
An overview of trials included in this study is presented in Table 1. With this data, we evaluated five different methods (Table 2) for prediction of steady-state HbA1c (here defined as HbA1c at 26/28 weeks in a clinical trial) based on data up to 12 weeks of treatment. In order to both evaluate the impact of using FPG vs. MPG and steady-state vs. longitudinal data, two steady-state methods were applied. Method 1 applies the steady-state relation between FPG and HbA1c previously derived by Samtani.17 Method 2 is based on the steady-state relation between MPG and HbA1c previously published by Nathan et al.14
Table 1. Summary of studies applied for comparison of steady-state HbA1c prediction methods.
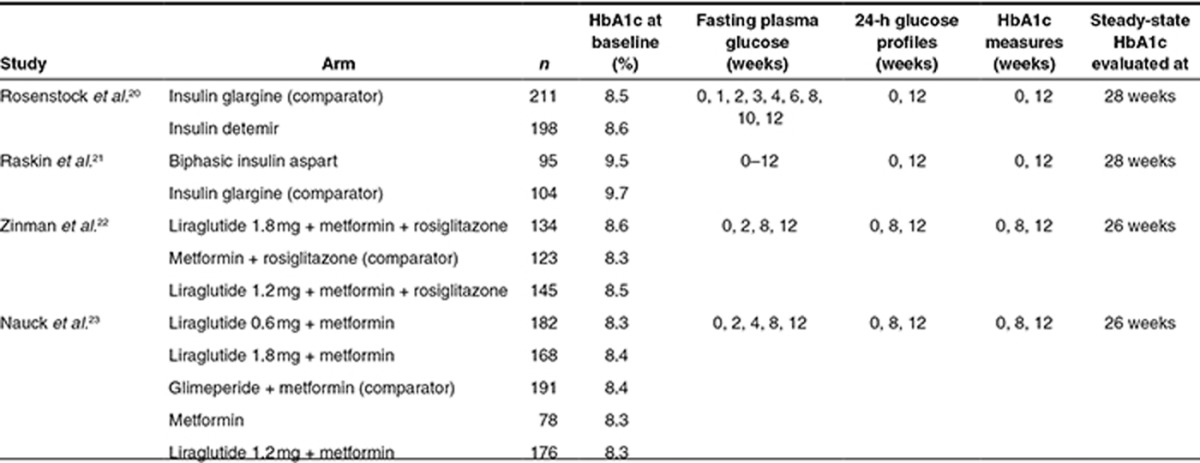
Table 2. Summary of five methods compared for prediction of HbA1c at steady state.
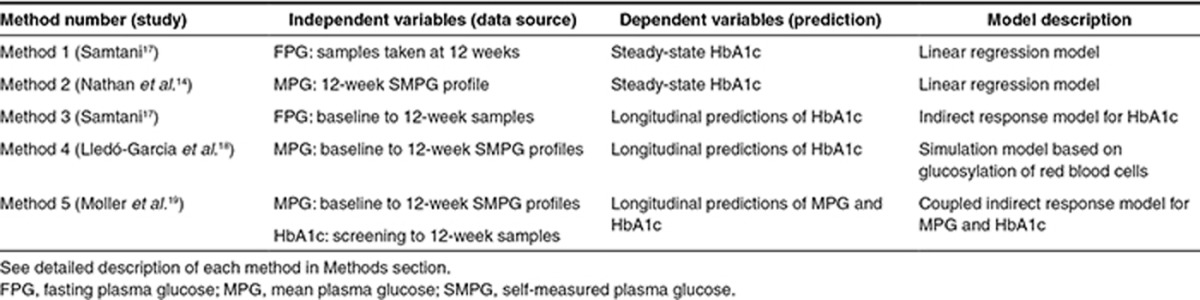
For incorporation of longitudinal FPG and MPG data, the models proposed by Samtani (Method 3)17 and Lledó-Garcia et al. (Method 4)18 were applied. Method 3 is an indirect response model linking FPG to HbA1c, whereas Method 4 is based on the relation between MPG and the lifespan and glycosylation of red blood cells (RBCs). Method 5 consists of two linked indirect response models in which predictions of MPG are related to predictions of HbA1c. Thus, only Method 5 used both MPG and HbA1c as dependent variables. For each longitudinal model, all data up to 12 weeks were included. Thus, Method 3 included FPG and HbA1c data up to 12 weeks, Method 4 used MPG data up to 12 weeks, and Method 5 used MPG and HbA1c data up to 12 weeks. All methods were applied for prediction of all 12 treatment arms evaluated in the four trials as shown in Table 1.20,21,22,23
Mean prediction errors at 26/28 weeks are presented for each treatment arm in Figure 1. Individual predictions from each of the five methods were obtained from 12-week data in line with the description for each method (see Methods section). All methods underestimated the observed values to various degrees. In particular, the application of FPG values (Methods 1 and 3) seemed to cause predictions to be much lower than the observed values. Numerical values of mean absolute prediction errors are presented in Table 3 for each treatment arm for the five different methods. For Method 5, the overall mean prediction error was −0.13% points, whereas for the other methods, it ranged from −0.37 to −0.61% points. As seen, the regression-based method using FPG (Method 1) significantly underestimated HbA1c at end of trial for basal insulins (arms 1, 2, and 4). The predictions from the MPG-based methods (Methods 2 and 4) were more consistent but still underestimated HbA1c by 0.3–0.4% points. Only Method 5 overestimated HbA1c for some treatments (arms 5, 7, and 11). Precision was substantially higher for the three methods using MPG (Methods 2, 4, and 5) than for the two methods using FPG (Methods 1 and 3). When evaluating the model performance by means of the root mean square error (RMSE), a measure of individual prediction errors (Table 3), the above conclusions were largely confirmed: the steady-state methods (Methods 1 and 2) provided the largest RMSE with overall larger errors of predictions based on FPG than those based on MPG. Furthermore, the RMSE was considerably lower for Method 5 than for the other four methods.
Figure 1.

Mean prediction performance per arm of each method for HbA1c prediction at end of trial (26/28 weeks). Predictions were obtained using 12-week data and prediction errors were expressed as the deviation between the mean of individual predictions and the mean of the observations per arm. Arm 1: Insulin glargine, Arm 2: Insulin detemir, Arm 3: Biphasic insulin aspart, Arm 4: Insulin glargine, Arm 5: Liraglutide 1.8 mg + metformin, Arm 6: Metformin + rosiglitazone, Arm 7: Liraglutide 1.2 mg + metformin + rosiglitazone, Arm 8: Liraglutide 0.6 mg + metformin, Arm 9: Liraglutide 1.8 mg + metformin, Arm 10: Glimepiride + metformin, Arm 11: Metformin, Arm 12: Liraglutide 1.2 mg + metformin. Key to symbols: Method 1 (filled blue diamonds),17 Method 2 (filled red squares),14 Method 3 (open blue diamonds),17 Method 4 (open red triangles),18 Method 5 (filled green triangles).19
Table 3. Mean prediction errors and RMSE of methods for predicting HbA1c treatment outcome.
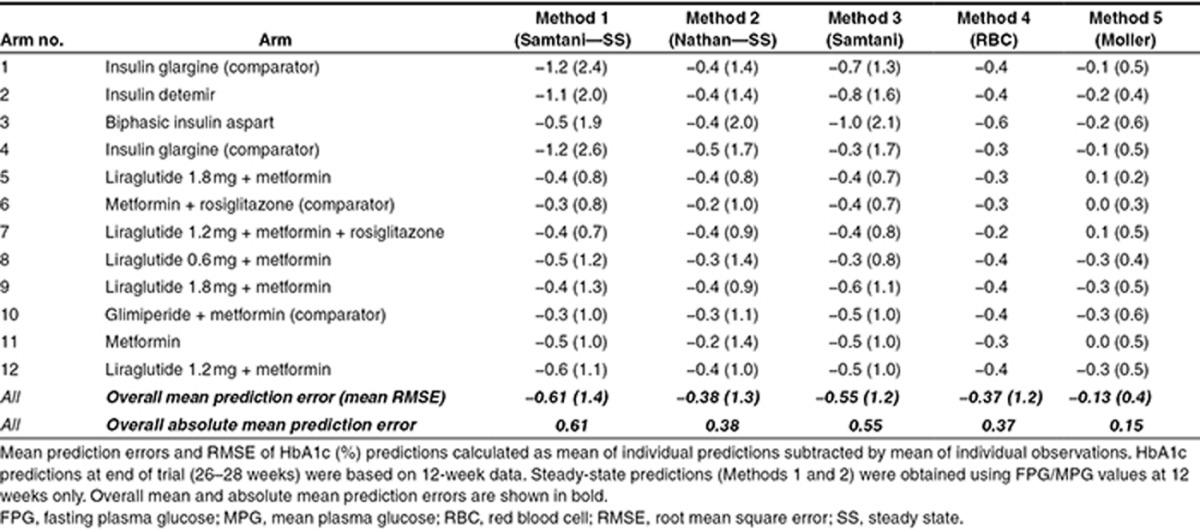
Figure 2 presents the prediction errors in terms of treatment contrasts between study drugs and comparators (▵▵HbA1c). The ▵▵HbA1c in each panel of Figure 2 was calculated by subtracting the baseline-corrected mean of HbA1c at 26/28 weeks of the comparator arms (▵HbA1ccomparator) from the baseline-corrected mean of HbA1c at 26/28 weeks of the study drug arm (▵HbA1cstudy drug) for observed data or for predictions obtained using the five methods. The confidence intervals of ▵▵HbA1c were obtained by comparing the distribution of baseline-corrected HbA1c of treatment and comparator, using t-test. Lines through 0 and −0.3% are inserted to indicate no difference and the noninferiority limits for comparison against a comparator defined in regulatory guidance.9,10 In line with the results presented in Figure 1, the steady-state methods more frequently provided an incorrect conclusion compared with the longitudinal models. Additionally, the longitudinal model based on MPG observations (Method 4) and the model based on MPG observations in combination with early HbA1c observations (Method 5) provided the correct conclusion for all comparisons. The longitudinal approach using FPG (Method 3) failed to correctly predict trial outcome in several of the comparisons.
Figure 2.

Phase III outcome (▵▵HbA1c (%)) observations (black) and predictions across treatment arms. Method 1 (filled blue diamonds),17 Method 2 (filled red squares),14 Method 3 (open blue diamonds),17 Method 4 (open red triangles),18 Method 5 (filled green triangles).19 Vertical lines through 0 and −0.3% indicate no difference and noninferiority limits used for treatment comparisons. Left to right–top to bottom: 1) Insulin detemir vs. insulin glargine, 2) Biphasic insulin aspart vs. insulin glargine, 3) Liraglutide 1.8 mg + metformin + rosiglitazone vs. metformin + rosiglitazone, 4) Liraglutide 1.2 mg + metformin + rosiglitazone vs. metformin + rosiglitazone, 5) Liraglutide 0.6 mg + metformin vs. glimiperide + metformin, 6) Liraglutide 1.8 mg + metformin vs. glimiperide + metformin, 7) Metformin vs. glimiperide + metformin, 8) Liraglutide 1.2 mg + metformin vs. glimiperide + metformin.
Discussion
We compared various methods for predicting steady-state HbA1c outcome (defined as HbA1c at 26/28 weeks in a clinical trial). In order to evaluate both the impact of the type of data used (MPG vs. FPG) and the method (steady-state vs. longitudinal models), classical regression techniques linking glucose to HbA1c at steady state and model-based longitudinal approaches were applied for prediction. The performance of each method was evaluated based on its ability to predict mean HbA1c at 26/28 weeks in each arm (by mean prediction error and RMSE) and on its ability to predict trial outcome expressed as the difference in treatment effect vs. comparator. Using these two evaluation criteria, the methods were in turn compared both with regard to their ability to predict the observed HbA1c value and their ability to predict HbA1c change from baseline vs. comparator. For both criteria, the methods using MPG data provided better predictions than the ones using FPG. This was in accordance with theoretical considerations,24 as the MPG—in contrast to FPG—also contains information of drug effects on PPG.
The best predictive performance was obtained with a dynamic model describing longitudinal progression of both MPG and HbA1c (Method 5). As this model uses all the observations up to 12 weeks collected for both MPG and HbA1c, it is not surprising that this model has the best predictive performance for end-of-trial HbA1c. Moreover, this method accurately predicted the outcome of treatment comparisons obtained for all eight comparisons included. Contrary to this, the two steady-state methods (Methods 1 and 2) were unable to predict the actual outcome for four of eight comparisons.
In the study, we implemented each prediction method as presented in the original papers. Thus, we used fixed parameters and constants as reported in the original publications and explained in Methods section. Based on our results using the published parameter values, all methods significantly underestimated the final HbA1c values.
For the steady-state methods (Methods 1 and 2), we used the regression parameters reported by Samtani17 and Nathan et al.14 The possibility of reestimating the parameter values using, e.g., week 12 data from each treatment arm would likely have resulted in biased parameter values as HbA1c, contrary to MGP, would not be at steady state at this time point. Moreover, the original parameter values were estimated on larger data sets of a more heterogeneous nature than the clinical trial data investigated in this study and thus we did not find it appropriate to change the regression parameters for the link between FPG/MPG and HbA1c reported in the original papers.
The longitudinal model describing the relation between FPG and HbA1c (Method 3) was implemented according to the original published version of the model. In three of four trials investigated in this work, at least one of the treatment arms involved drugs targeting PPG. As the longitudinal model presented by Samtani17 was originally estimated on trials with drug classes not targeting PPG, we also investigated an implementation with rate constants estimated for each arm. Estimating the glycosylation constants per arm, as opposed to per trial as recommended in the original publication, allows different glycosylation rates for drugs not targeting PPG and those who do. This did not improve the accuracy of the predictions (results not shown). Estimating the parameter for the lower limit of HbA1c (HbA1clower limit) in each trial improved the performance of the model significantly. For the same reason as for the regression methods, we did not find estimating the lower limit of HbA1c appropriate, as this parameter was implemented as being fixed across trials in the original paper, and the data investigated in this study were not as extensive as in the original paper by Samtani17 where 12 trials were used for estimation.
The second best method (Method 4) was the longitudinal model published by Lledó-Garcia et al.18 This model predicted the ΔΔHbA1c just as well as Method 5, but predictive performance was slightly worse for absolute HbA1c. This method also uses MPG to drive the glycosylation of RBCs but does not require estimation of any parameters. In this study, Method 4 was implemented as a pure simulation model, in the sense that all parameters except for residual variability were fixed using previously published data. Alternatively, the published parameters with their uncertainties could be used as priors for reestimation of parameters based on the study data. Method 4, as it was published by Lledó-Garcia et al., has high parameter certainty and was developed using data much more informative regarding the underlying mechanism of HbA1c formation compared with those included in this analysis. This led us to conclude that reestimation of parameters with priors would not change the parameters significantly. The only parameter reestimated in this setting was the residual error for HbA1c, which was also the most uncertain parameter according to Lledó-Garcia and colleagues.
In a previous paper,19 we used both observed MPG values and FPG-derived MPG values as glucose input. Here, the implementation of Method 5 only included observed MPG values. This was done to be able to compare models across using only MPG values and models using only FPG values and to show that the use of MPG values alone also provides accurate predictions.
Despite the superior performance of the longitudinal methods based on MPG, it is worth mentioning that each method presented in this paper has its own merit. The regression-based methods can be used to obtain HbA1c predictions based on a single value of either FPG (Method 1) or MPG (Method 2) at steady state. These methods can thus be used to obtain predictions from early phase studies where longitudinal values of glucose are not being sampled. Furthermore, these methods have their merit for diagnostic purpose, by translating single glucose values into expected HbA1c. Clearly, using FPG in a longitudinal approach, as compared with MPG, also needs significantly fewer blood samples, which is one of the advantages of the approach presented by Samtani (Method 3).17
Various factors could account for the underestimation of HbA1c for each of the methods. One could be that disease progression is not explicitly accounted for in any of the models. The UK Prospective Diabetes Study reports a progression of HbA1c of 0.2% per year, which would thus cause predictions at 26 weeks to be 0.1% higher compared with baseline.25 Such a progression should however be implemented on the glucose component (and not the HbA1c component) in order to align with the physiological principle that the glucose change drives the HbA1c change.
In summary, we have outlined and evaluated different methods for HbA1c predictions based on early trial data. In line with results from previous studies, our results show that using MPG provides more accurate predictions of HbA1c compared with using FPG, independently of treatment. Although the amount of samples needed to obtain estimates of MPG are substantially higher than for FPG, these samples can be taken at home using self-measured glucose values as applied in the studies included in this paper. Furthermore, in case longitudinal HbA1c measurements are available, we suggest including such measurements in the prediction of long-term HbA1c outcome.
Methods
Trial design and patients
The trials used for evaluation of predictive performance consisted of three phase III trials and one phase IV trial of previously approved pharmaceuticals.20,21,22,23 The data from these trials were previously used to validate one of the models applied in this paper (Method 5).19 Trials were required to include glucose profiles and HbA1c sampling at least three times up to end of trial, which was at either 26 or 28 weeks. Furthermore, in order to use similar data for all methods, each subject was required to have an FPG and an MPG value at 12 weeks, and an HbA1c sample at end of trial (26–28 weeks). MPG values were obtained from glucose profiles sampled 7–11 times during the day, calculated as AUC0–24 h/24 h. FPG was calculated as the mean of all available samples taken before breakfast at each visit. Typically, one FPG sample analyzed in the laboratory, and three prebreakfast SMPG values were available at a given visit, in which case the final FPG value was calculated as the mean of these four values.
Methods used for prediction of HbA1c
Five methods were used to perform predictions based on data up to 12 weeks. The two methods relating single measurements of steady-state glucose to steady-state HbA1c were evaluated assuming the glucose measurement at 12 weeks to be representative of the glucose at steady state (Methods 1 and 2).14,17 In contrast, the longitudinal versions of the FPG/MPG models used all FPG/MPG data from baseline up to 12 weeks (Methods 3 and 4).17,18 The longitudinal glucose and HbA1c model (Method 5)19 used both MPG and HbA1c values up to 12 weeks. A detailed description of each model is provided below. Model codes appear in the Supplementary Appendix online.
Method 1 (FPG–HbA1c steady-state solution)
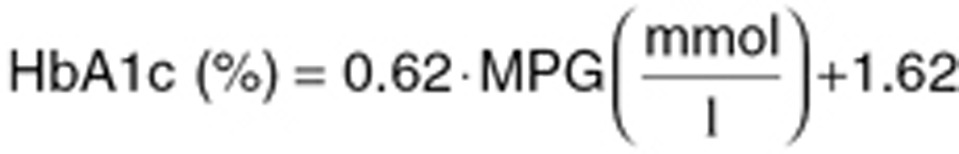
In order to compare longitudinal methods with steady-state solutions,16 we applied the original steady-state relationship between FPG and HbA1c derived by Samtani.17 This relation is based on a model built on an extensive data set with many different oral antidiabetic drugs administered to type 2 diabetes patients. The following relationship between glucose and HbA1c was derived in the original publication and applied here for prediction:
 |
The original parameter values were used for method comparison.
Method 2 (MPG–HbA1c steady-state solution)
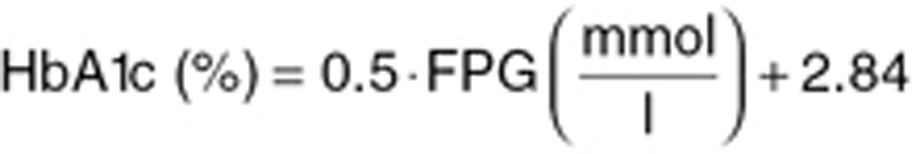
Nathan et al.14 previously established the relation between average glucose and HbA1c data from 507 subjects. The following linear relation was derived in the original paper (revised to relate HbA1c to glucose and not vice versa as presented in the original paper) and applied here to perform predictions of HbA1c:
 |
These parameter values were used for method comparison.
Method 3 (FPG–HbA1c model)
The longitudinal model by Samtani17 is derived based on mean data from various different phase II trials. In order to align with the original publication, we implemented the model using a fixed effects approach, thus keeping all interindividual variability parameters fixed to 0. The following equations describe the relation between glucose and HbA1c:
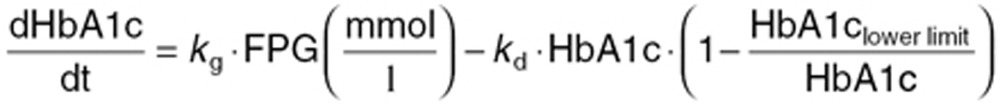 |
Here, kg and kd are the two rate constants for HbA1c production and degradation, respectively, which account for the time delay between FPG and HbA1c. The system is initialized at the baseline value of HbA1c. HbA1clower limit is a physiological limit parameter—which enables integration across trials with different baseline HbA1c levels. For our method comparison, kg and kd were estimated per trial using FPG and HbA1c values week 12, whereas HbA1clower limit was fixed to 2.84% as reported.17
Method 4 (MPG–HbA1c model)
In order to incorporate the possibility of glucose levels affecting the life span of RBCs, Lledó-Garcia et al.18 formulated a transit compartment model for description of aging of RBCs. The HbA1c predictions from the model are the estimated fraction of glycosylated to nonglycosylated RBCs—both of which have to be determined. The below equations describe the nonglycosylated part:
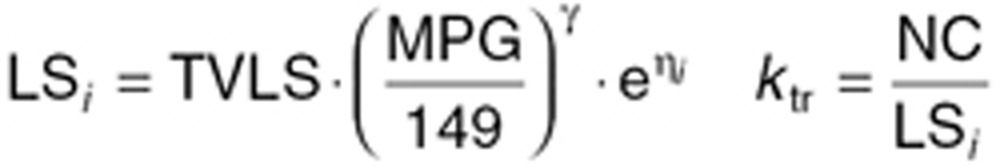 |
 |
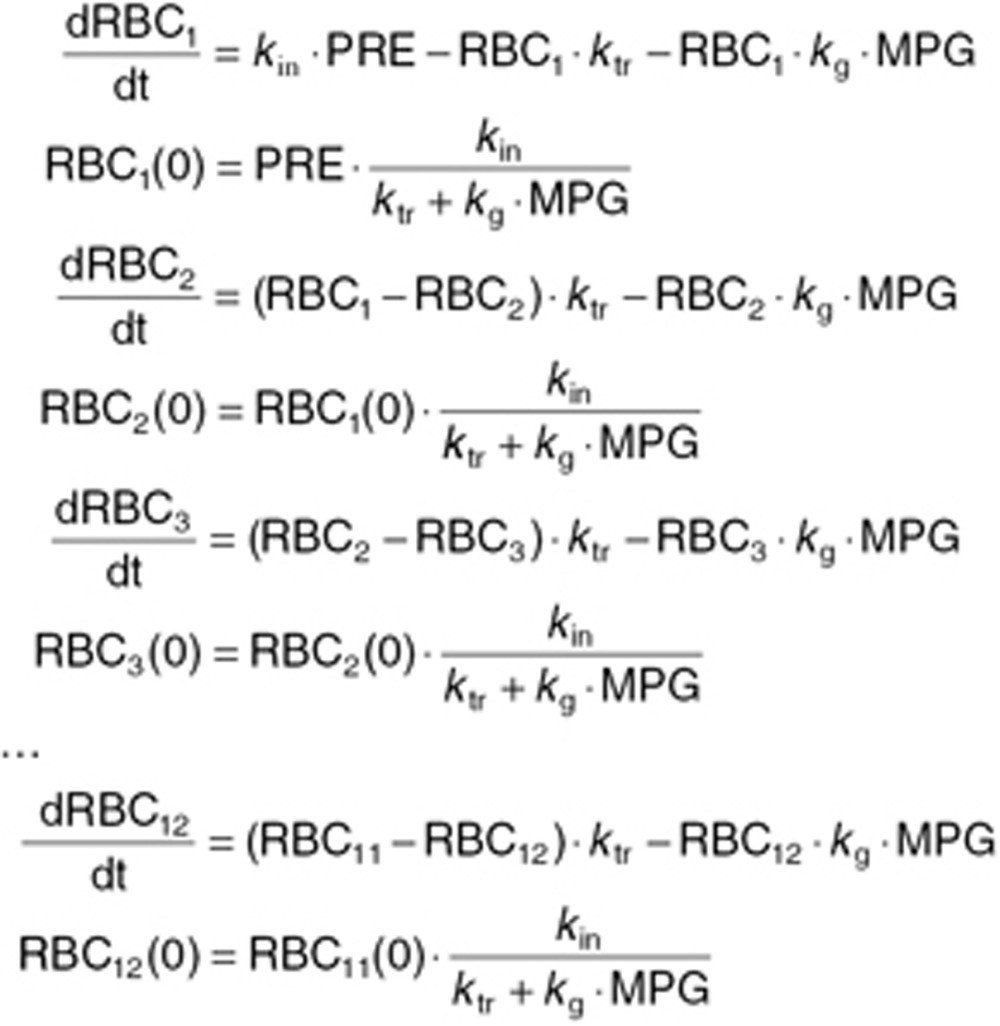 |
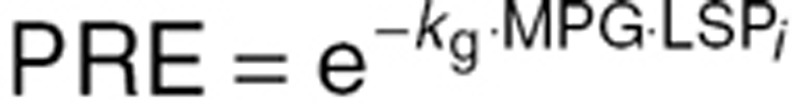
Here LSi represents the mean value life span for the ith individual, ηi is the individual deviation from the population, normally distributed with a mean of zero and a standard deviation of 0.29 (as previously reported).18 TVLS is the typical value for life span, which in our case was fixed to 91.7 days as previously reported.18 The parameter γ described the shape of the effect of MPG on the life span of RBCs. kg is the rate of glycosylation of RBCs, fixed to 8.37 ·10–6 as previously reported. NC is the number of transit compartments (i.e., 12) from which the transit rate per day can be calculated (ktr). PRE is the contribution coming from the precursor pool, which is calculated using the glycosylation and the life span of precursor, fixed to the reported value of 8.2 days with a standard deviation between subjects of 0.34.18 kin = 1 is the normalized production rate of RBCs.
The structure of the coupled differential equations system for the glycosylated RBCs follows the one written above, but with the first equation in this system written as
 |
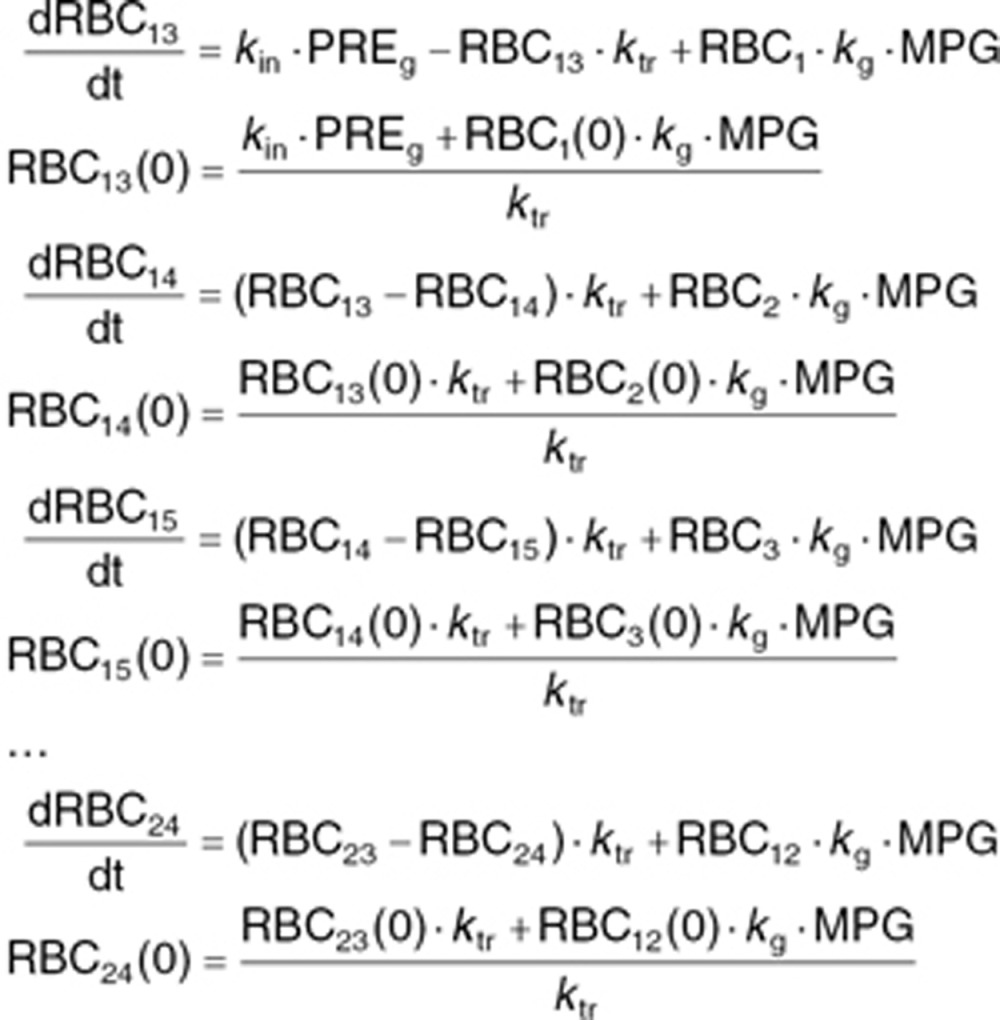 |
In order to obtain a predicted measure of HbA1c (%), the relation between glycosylated RBCs and the total population of RBCs is calculated according to:
 |
Here, RBCgly represents the amount of glycosylated RBCs obtained as the sum of compartments RBC13 to RBC24, whereas RBCtotal is the total sum of RBCs in compartments RBC1 to RBC24.
For our method comparison, we used the published parameter values.18 The only reestimated parameter was the residual error for HbA1c, which was also the most uncertain parameter according to Lledó-Garcia and colleagues.
Method 5 (MPG–HbA1c model)
This model consists of two linked indirect response models, linking MPG dynamics to HbA1c dynamics.19 The model has both MPG and HbA1c as dependent variables and thus requires longitudinal data of both MPG and HbA1c. The structural model is described by
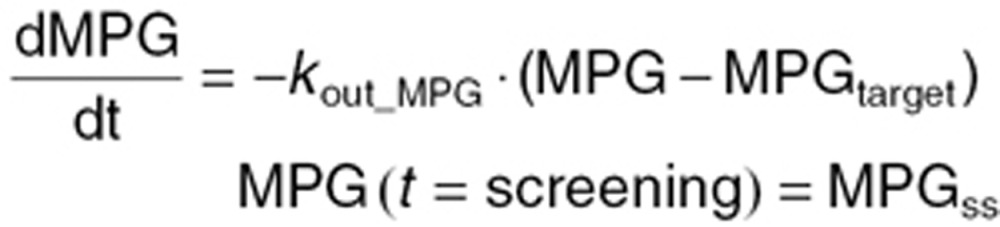 |
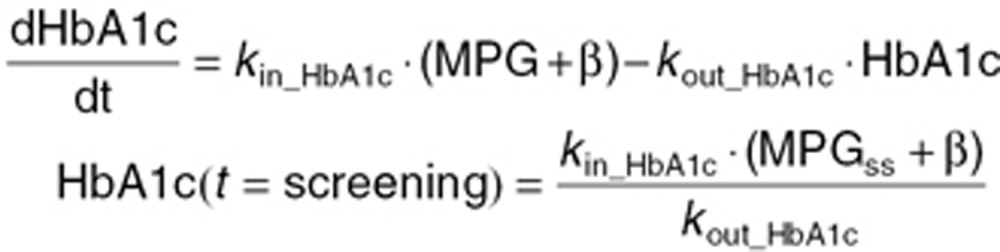 |
where kout_MPG, kin_HbA1c, and kout_HbA1c are parameters characterizing the first-order turnover of MPG and HbA1c, respectively. MPGss is a parameter representing the estimated pretreatment steady-state level, whereas MPGtarget is assigned different values during the course of the trial: during the run-in period, MPGtarget is assigned the value of MPGbase (MPG at randomization), and during the treatment period, it is assigned the value of MPGposttreatment (MPG level at full treatment effect). The time between screening and baseline can vary between trials. As indicated, both MPG and HbA1c are assumed to be at steady state at the time of screening, but not necessarily at randomization. The parameter β relates MPG to HbA1c at steady state and is estimated per subject using a population model.
For method comparison, values of MPGss, MPGtarget, kout_MPG, and β were estimated per subject using a population approach. kin_HbA1c and kout_HbA1c were fixed to 0.081% per mmol/L per week, and 0.226 per week, respectively.19
Evaluation of prediction performance
Two different metrics were used for evaluating prediction performance. Prediction performance on the absolute HbA1c scale was evaluated by comparing mean predictions and mean observations for each method and for each treatment arm at 26–28 weeks, depending on study. The prediction error ɛ(HbA1c)j for each arm (j) was calculated according to
 |
where  represents the mean of the individual predictions for arm j and
  represents the mean of the observations for arm j. Thus, a negative value indicates underprediction of HbA1c. In order to assess the potential bias as well as the mean deviation, summary statistics were derived using absolute prediction errors as well as the actual numerical values. In case all values have the same sign, the mean deviation is thus equal to the bias.
The RMSE was estimated for each treatment arm j as a summary statistic over all subjects i as:
 |
where pHbA1ci and HbA1ci represent the individual predictions and observations for subject i, respectively, and nj is the number of subjects in treatment arm j.
Furthermore, all methods were evaluated with respect to their ability to predict phase III efficacy outcome with respect to performance against comparator. The difference in the ability to lower HbA1c between trial drug and comparator was calculated according to the following formula:
 |
Software
S-PLUS, version 8.0 (TIBCO, Palo Alto, CA) was used for data file processing, explorative data analysis, and plotting. NONMEM version 7.1.2 (ICON Development Solutions, Ellicott City, MD) was used for model estimation and simulation.
Conflict of Interest
J.B.M., N.R.K., S.K., and S.H.I. are all employees of Novo Nordisk A/S and own stocks in the company. The other authors declared no conflict of interest.
Author Contributions
J.B.M., N.R.K., S.K., and M.C.K. wrote the manuscript. J.B.M., N.R.K., S.K., M.O.K., S.H.I., and M.C.K. designed the research. J.B.M., N.R.K., S.K., M.O.K., S.H.I., and M.C.K. performed the research. J.B.M. analyzed the research.
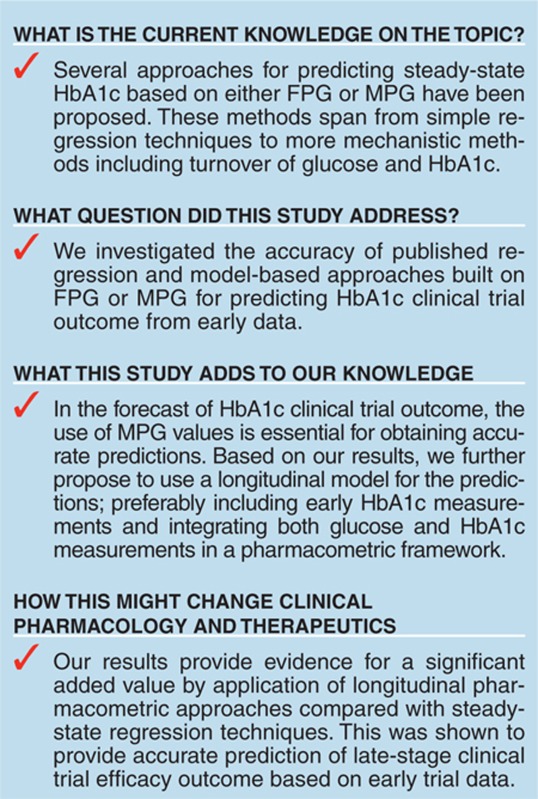
Study Highlights
Acknowledgments
The research leading to these results was conducted within the Drug Development Modelling Resources (DDMoRe) consortium and has received support from the Innovative Medicines Initiative Joint Undertaking under grant agreement no. 115156. Resources for this consortium are composed of financial contributions from the European Union's Seventh Framework Programme (FP7/2007-2013) and European Federation of Pharmaceutical Industries and Associations companies' in-kind contribution. The DDMoRe project is also financially supported by contributions from Academic and small and medium-sized enterprises partners. This work was further funded by Corporate Research Affairs, Novo Nordisk A/S.
Supplementary Material
References
- American Diabetes Association Economic costs of diabetes in the U.S. in 2012. Diabetes Care. 2013;36:1033–1046. doi: 10.2337/dc12-2625. [DOI] [PMC free article] [PubMed] [Google Scholar]
- Paul S.M., et al. How to improve R&D productivity: the pharmaceutical industry's grand challenge. Nat. Rev. Drug Discov. 2010;9:203–214. doi: 10.1038/nrd3078. [DOI] [PubMed] [Google Scholar]
- Danaei G., et al. National, regional, and global trends in fasting plasma glucose and diabetes prevalence since 1980: systematic analysis of health examination surveys and epidemiological studies with 370 country-years and 2.7 million partipants. Lancet. 2011;378:31–40. doi: 10.1016/S0140-6736(11)60679-X. [DOI] [PubMed] [Google Scholar]
- Roden M. Clinical Diabetes Research: Methods and Techniques. John Wiley & Sons; Chichester; 2007. pp. 387–392. [Google Scholar]
- Schrot R.J., Patel K.T., Foulis P. Evaluation of inaccuracies in the measurement of glycemia in the laboraty, by glucose meters, and through measurement of hemoglobin A1c. Clinical Diabetes. 2007;25:43–49. [Google Scholar]
- Frank E.A., Shubha M.C., D'Souza C.J.M. Blood glucose determination: plasma or serum. J. Clin. Lab. Anal. 2012;26:317–320. doi: 10.1002/jcla.21524. [DOI] [PMC free article] [PubMed] [Google Scholar]
- The DCCT Research Group The effect of intensive treatment of diabetes on the development and progression of long-term complications in insulin-dependent diabetes mellitus. N. Engl. J. Med. 1993;329:977–986. doi: 10.1056/NEJM199309303291401. [DOI] [PubMed] [Google Scholar]
- Lind M., Odén A., Fahlén M., Eliasson B. The true value of HbA1c as a predictor of diabetic complications: simulations of HbA1c values. PLoS One. 2009;4:e4412. doi: 10.1371/journal.pone.0004412. [DOI] [PMC free article] [PubMed] [Google Scholar]
- Guidance for Industry, Diabetes Mellitus: Developing Drugs and Therapeutic Biologics for Treatment and PreventionU.S. Department of Health and Human Services, FDA, Center for Drug Evaluation and Research (CDER), Rockville; p. 12.February 2008 [Google Scholar]
- Guideline on Clinical Investigation of Medicinal Products in the Treatment of Diabetes Mellitus Committee for Medicinal Products for Human Use (CHMP), CPMP/EWP/1080/00 Rev. 1, EMA; London, p. 7, (14 May 2012 [Google Scholar]
- Aleyassine H., Gardiner R.J., Tonks D.B., Koch P. Glycosylated hemoglobin in diabetes mellitus: correlations with fasting plasma glucose, serum lipids, and glycosuria. Diabetes Care. 1980;3:508–514. doi: 10.2337/diacare.3.4.508. [DOI] [PubMed] [Google Scholar]
- Karl D., Zhou R., Vlajnic A., Riddle M. Fasting plasma glucose 6–12 weeks after starting insulin glargine predicts likelihood of treatment success: a pooled analysis. Diabet. Med. 2012;29:933–936. doi: 10.1111/j.1464-5491.2012.03640.x. [DOI] [PMC free article] [PubMed] [Google Scholar]
- Rohlfing C.L., Wiedmeyer H.M., Little R.R., England J.D., Tennill A., Goldstein D.E. Defining the relationship between plasma glucose and HbA(1c): analysis of glucose profiles and HbA(1c) in the Diabetes Control and Complications Trial. Diabetes Care. 2002;25:275–278. doi: 10.2337/diacare.25.2.275. [DOI] [PubMed] [Google Scholar]
- Nathan D.M., Kuenen J., Borg R., Zheng H., Schoenfeld D., Heine R.J. Translating the A1C assay into estimated average glucose values. Diabetes Care. 2008;31:1473–1478. doi: 10.2337/dc08-0545. [DOI] [PMC free article] [PubMed] [Google Scholar]
- Monnier L., Lapinski H., Colette C. Contributions of fasting and postprandial plasma glucose increments to the overall diurnal hyperglycemia of type 2 diabetic patients: variations with increasing levels of HbA(1c) Diabetes Care. 2003;26:881–885. doi: 10.2337/diacare.26.3.881. [DOI] [PubMed] [Google Scholar]
- Monnier L., Colette C., Owens D. Postprandial and basal glucose in type 2 diabetes: assessment and respective impacts. Diabetes Technol. Ther. 2011;13 suppl. 1:S25–S32. doi: 10.1089/dia.2010.0239. [DOI] [PubMed] [Google Scholar]
- Samtani M.N. Simple pharmacometric tools for oral anti-diabetic drug development: competitive landscape for oral non-insulin therapies in type 2 diabetes. Biopharm. Drug Dispos. 2010;31:162–177. doi: 10.1002/bdd.700. [DOI] [PubMed] [Google Scholar]
- Lledó-Garcia R., Mazer N.A., Karlsson M.O. A semi-mechanistic model of the relationship between average glucose and HbA1c in healthy and diabetic subjects. J. Pharmacokinet. Pharmacodyn. 2013;40:129–142. doi: 10.1007/s10928-012-9289-6. [DOI] [PubMed] [Google Scholar]
- Møller J.B., et al. Longitudinal modeling of the relationship between mean plasma glucose and HbA1c following antidiabetic treatments. CPT Pharmacometrics Syst. Pharmacol. 2013;2:e82. doi: 10.1038/psp.2013.58. [DOI] [PMC free article] [PubMed] [Google Scholar]
- Rosenstock J., Davies M., Home P.D., Larsen J., Koenen C., Schernthaner G. A randomised, 52-week, treat-to-target trial comparing insulin detemir with insulin glargine when administered as add-on to glucose-lowering drugs in insulin-naive people with type 2 diabetes. Diabetologia. 2008;51:408–416. doi: 10.1007/s00125-007-0911-x. [DOI] [PMC free article] [PubMed] [Google Scholar]
- Raskin P., et al. Initiating insulin therapy in type 2 diabetes: a comparison of biphasic and basal insulin analogs. Diabetes Care. 2005;28:260–265. doi: 10.2337/diacare.28.2.260. [DOI] [PubMed] [Google Scholar]
- Zinman B., et al. LEAD-4 Study Group Efficacy and safety of the human glucagon-like peptide-1 analog liraglutide in combination with metformin and thiazolidinedione in patients with type 2 diabetes (LEAD-4 Met+TZD) Diabetes Care. 2009;32:1224–1230. doi: 10.2337/dc08-2124. [DOI] [PMC free article] [PubMed] [Google Scholar]
- Nauck M., et al. LEAD-2 Study Group Efficacy and safety comparison of liraglutide, glimepiride, and placebo, all in combination with metformin, in type 2 diabetes: the LEAD (liraglutide effect and action in diabetes)-2 study. Diabetes Care. 2009;32:84–90. doi: 10.2337/dc08-1355. [DOI] [PMC free article] [PubMed] [Google Scholar]
- Riddle M., Umpierrez G., DiGenio A., Zhou R., Rosenstock J. Contributions of basal and postprandial hyperglycemia over a wide range of A1C levels before and after treatment intensification in type 2 diabetes. Diabetes Care. 34:2508–2514. doi: 10.2337/dc11-0632. [DOI] [PMC free article] [PubMed] [Google Scholar]
- UK Prospective Diabetes Study Group Effect of intensive blood-glucose control with metformin on complications in overweight patients with type II diabetes (UKPDS 34) Lancet. 1998;352:854–865. [PubMed] [Google Scholar]
Associated Data
This section collects any data citations, data availability statements, or supplementary materials included in this article.