Abstract
Bile salt export pump (BSEP) inhibition has been proposed to be an important mechanism for drug-induced liver injury (DILI). Modeling can prioritize knowledge gaps concerning bile acid (BA) homeostasis and thus help guide experimentation. A submodel of BA homeostasis in rats and humans was constructed within DILIsym, a mechanistic model of DILI. In vivo experiments in rats with glibenclamide were conducted, and data from these experiments were used to validate the model. The behavior of DILIsym was analyzed in the presence of a simulated theoretical BSEP inhibitor. BSEP inhibition in humans is predicted to increase liver concentrations of conjugated chenodeoxycholic acid (CDCA) and sulfate-conjugated lithocholic acid (LCA) while the concentration of other liver BAs remains constant or decreases. On the basis of a sensitivity analysis, the most important unknowns are the level of BSEP expression, the amount of intestinal synthesis of LCA, and the magnitude of farnesoid-X nuclear receptor (FXR)-mediated regulation.
Introduction
The capacity of drugs to inhibit the bile salt export pump (BSEP) has been correlated with clinical drug–induced liver injury (DILI).1 Furthermore, known inhibitors of BSEP and other bile acid (BA) transporters have been implicated in the case studies of DILI. Glibenclamide has been associated with lobular liver injury in the clinic,2,3 bosentan has been associated with many cases of hepatotoxicity and carries a black-box warning for hepatotoxicity,4 and troglitazone was withdrawn from the market due to idiosyncratic DILI.5,6 Currently marketed BSEP inhibitors, such as lapatinib, have been given black-box warnings due to issues with liver toxicity.7 Interestingly, BSEP inhibitors often have additional proposed mechanisms for hepatotoxicity,8,9,10,11 and this can often confound our understanding of how these drugs cause DILI. Understanding the effects of BSEP inhibitors on BA metabolism and processing will prove crucial in understanding the importance of BSEP inhibition in clinical DILI.
BAs are molecules that aid digestion of triglycerides and other fat-soluble nutrients. They are synthesized in the liver and undergo highly efficient enterohepatic recirculation.12,13 While much is understood qualitatively about the basics of BA homeostasis, there are still many aspects of BA transport about which little quantitative information exists. For example, regulation of transporter activity by the farnesoid-X receptor (FXR) and other nuclear receptors generally responsible for BA synthesis has been demonstrated,14,15,16,17 and chenodeoxycholic acid (CDCA) and its amide conjugates have been shown to decrease BA synthesis18 and trigger FXR.19 However, to our knowledge, FXR response and transporter activity have not been linked quantitatively to BA concentrations within hepatocytes. Secondary BAs, such as lithocholic acid (LCA) and deoxycholic acid (DCA), are synthesized in the gut by intestinal bacteria,20 but to our knowledge, the rates of synthesis and the population variability of this synthesis have not been quantified in any species. Transporter kinetic and inhibition studies have used (or focused on) taurocholic acid, a metabolically stable model BA, but similar studies rarely have been performed on other BAs. Furthermore, while certain BA species, such as LCA and CDCA, are more cytotoxic than other BAs,20,21,22,23,24 the effect that intrahepatic concentrations of these BAs have on hepatocytes remains to be elucidated. While BSEP transporter expression variability in humans has been quantified,25 and underlying diseases have been shown to affect transporter expression,26 the significance of this variability has not been explored fully.
The relative importance of these unknowns remains in question. The process of constructing a mathematical model of BA-induced DILI can be helpful in determining which data gaps should be filled first for maximum impact. While any mechanistic model of BA-induced DILI will be lacking in quantitative accuracy due to the significant data gaps, mechanistic modeling can be used to qualitatively describe elements of the system that would be more or less likely to contribute to BA-mediated DILI.
In this study, we use DILIsym (www.dilisym.com), a mechanistic mathematical model of DILI, to explore the nature of BA homeostasis and its disruption by BA transporter inhibitors. DILIsym has been used previously to assess the efficacy of different N-acetylcysteine treatment regimens in acetaminophen-overdosed patients27 and to understand the species differences in methapyrilene toxicity using in vitro metabolism data.28 For this study, we have constructed a module of BA homeostasis within DILIsym for rats and humans; information on the data used to construct this module is available in the Supplementary Materials online.
We have also collected novel in vivo data from the rats treated with the BSEP inhibitor glibenclamide and used these data to ensure the reasonability of the DILIsym model. We also compared the human representation in DILIsym to serum BA data in humans after acetaminophen overdose. This model was used to explore the changes in intrahepatic BA concentrations that are predicted to occur in humans when a BA transporter inhibitor is administered. Finally, a sample population was used to determine which system parameters have the most influence on the magnitude of the intrahepatic BA changes that occur after dosing with a BA transporter inhibitor and would thus be the system components that would be most useful to be illuminated by future experiments.
Results
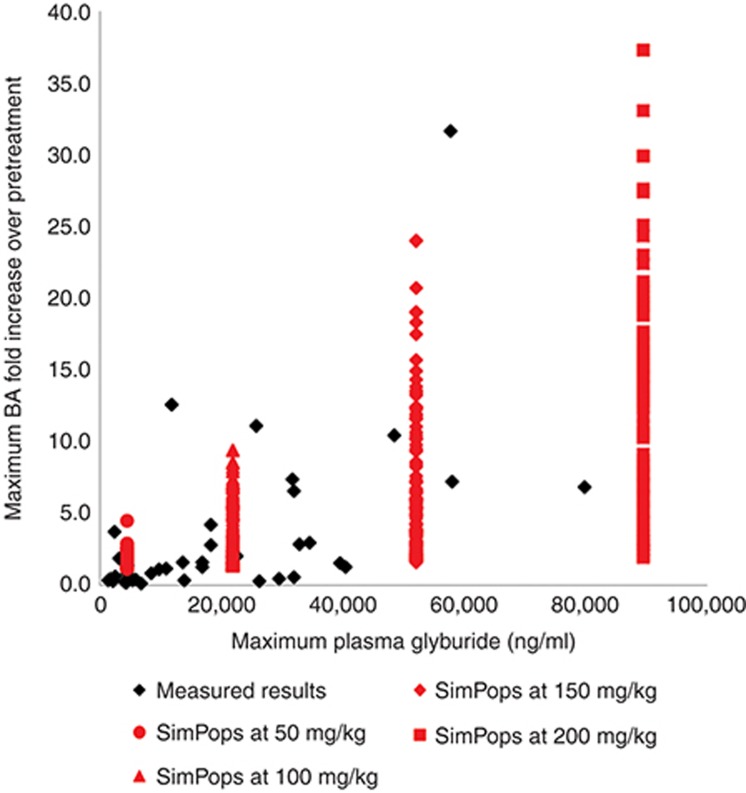
The BSEP and Na+-taurocholate-cotransporting polypeptide inhibitor glibenclamide, when administered orally to rats, causes an increase in total plasma BAs; this increase in BA concentrations is associated with high systemic exposure to glibenclamide, but is not observed at lower exposure levels. Figure 1 shows the results from the single-dose studies. There was no relationship between dose and exposure. Glibenclamide is notoriously poorly absorbed29; as such, the systemic exposure for each individual rat is more important than the dose administered. At concentrations below a Cmax of 10,000 ng/ml, there was little correspondence between glibenclamide concentrations and serum BA fold change, suggesting that the variability in BA processing among rats exceeds the effects of transporter inhibition at these exposure levels. Rats with glibenclamide Cmax >10,000 ng/ml generally displayed a higher concentration of BAs, albeit over a wide range. As shown in Figure 1, the simulated population (SimPops) covers the range of BA increases observed in the experimental rat data at each maximum simulated concentration tested, validating our model.
Figure 1.
Glibenclamide exposure (as measured by Cmax) vs. maximum total BA fold change over initial predose concentration for individual rats given a single oral dose of either 250 or 500 mg/kg glibenclamide (black points), and simulation results (red curves) are shown for different levels of glibenclamide exposure. BA, bile acid.
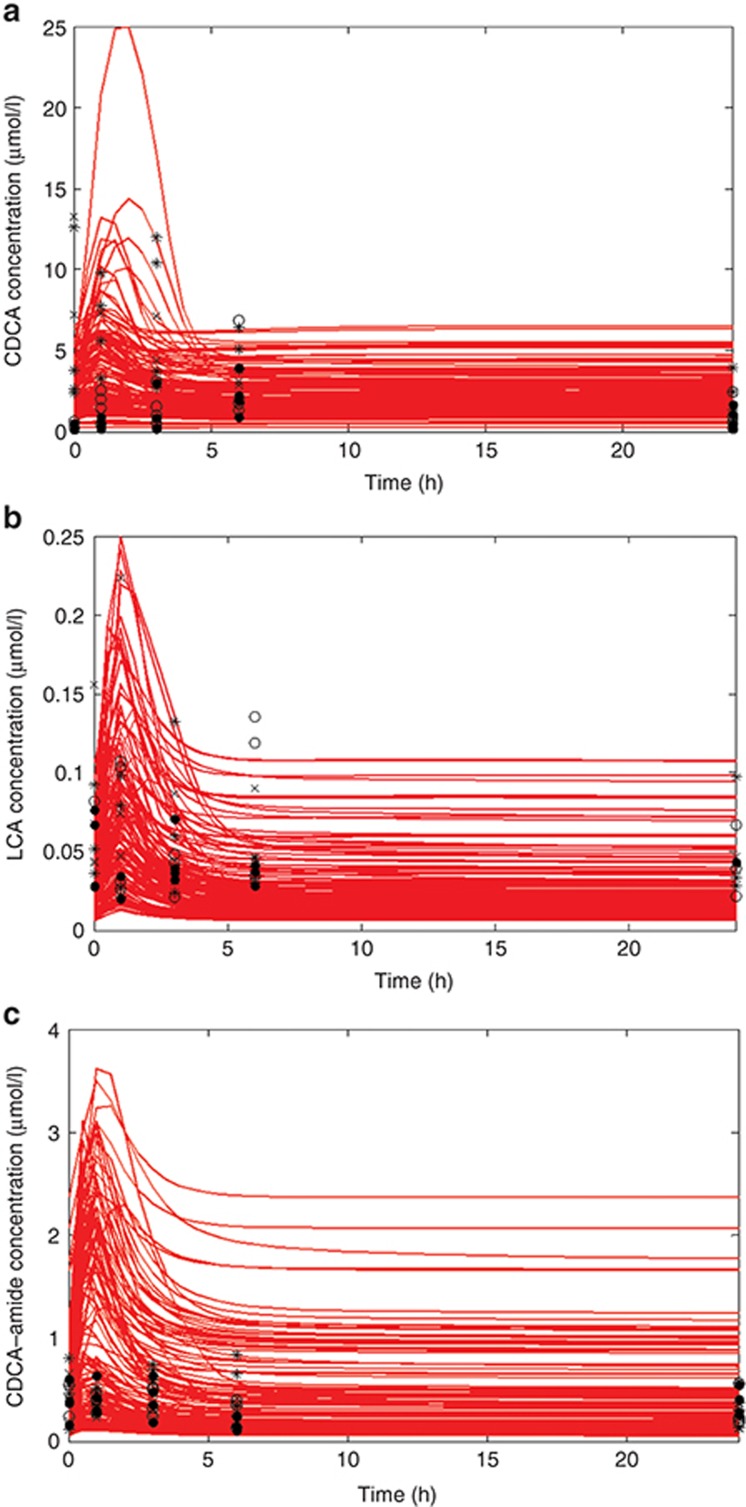
Figure 2 summarizes the results of the multiple-dose (300, 750, and 1,500 mg/kg) studies where individual BA species were measured. Serum data from day 1 are plotted in Figure 2; each data point represents an individual rat. Serum CDCA and LCA concentrations increased very soon after glibenclamide dosing with a return to the baseline predosing value by the end of 24 h; serum CDCA amide conjugates did not appear to change after glibenclamide dosing.
Figure 2.
Time course of (a) CDCA, (b) LCA, and (c) CDCA–amide conjugate concentrations in rat serum after administration of the first dose of 300 (O), 750 (*), and 1,500 (X) mg/kg oral glibenclamide, as well as rats with no glibenclamide (•). Simulation results are for a single dose of oral glibenclamide at a model dose that reproduces an exposure similar to that of the rats in this study. Each point represents a single-individual experimental rat; each red line represents an individual simulated rat. CDCA, chenodeoxycholic acid; LCA, lithocholic acid.
On day 7, plasma concentrations of glibenclamide did not vary widely in animals treated with the three different dose levels (data not shown); as a result, a single simulation was conducted on a rat SimPops at a simulated drug–exposure level similar to that observed in the rats in vivo. The results of this simulation were compared to the experimental data for LCA, CDCA, and CDCA–amide conjugates in Figure 2. The simulated population showed similar dynamics to those observed in vivo; the simulated rats exhibited a mild increase in BAs between 1 and 2 h after dosing and returned to baseline values by 24 h. For unconjugated CDCA, the simulated rat population covered the range of observed responses; for LCA, the simulated responses covered the bulk of the experimental data but missed the highest BA concentrations, while for CDCA–amide, our simulated population covered a much wider range than the experimental data, likely due to a wider range of initial CDCA–amide concentrations in the rat SimPops. Figure 2 demonstrates that DILIsym provides a good approximation of the range of BA increases that were observed after administration of a transporter inhibitor.
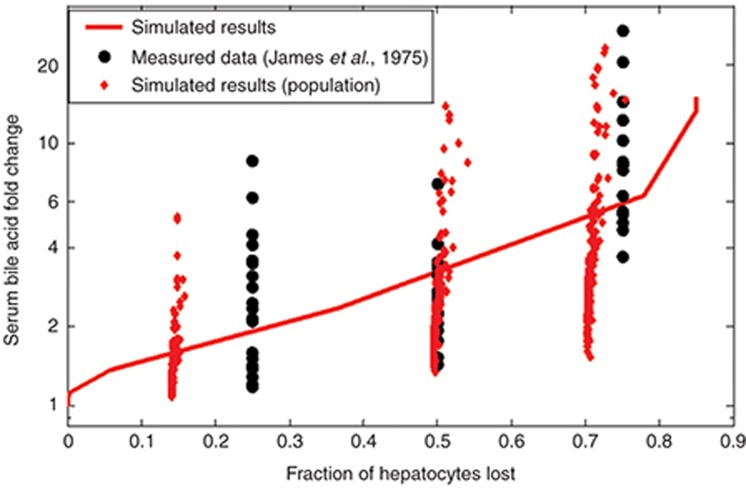
As data detailing the effect of BA transporter inhibitors on BA concentrations in humans were scarce, the model was validated in humans by comparing the response of the system after acetaminophen dosing to serum BA data from the clinic.30 Acetaminophen is not a BSEP inhibitor, so in this case, BA elevations are due to hepatocyte necrosis. The results of this validation are shown in Figure 3. Our baseline human model had a similar response to that demonstrated by James et al., that is, little to no BA elevations in serum when injury was minimal, small but significant increases when there was moderate injury, and large elevations when the injury was severe. The small human SimPops also exhibited a similar range of BA concentration changes to the patients reported in the James study.
Figure 3.
Comparison between DILIsym v2C and data reported in James et al.30 James et al. report their data in terms of histology grade, which was assumed to map to ~25, 50, and 75% hepatocyte loss for grades I, II, and III, respectively. The red line represents the behavior of the baseline human model; the red dots represent individuals in the small human SimPops.
With the model structure validated using the rat and human experimental data, we proceeded to simulate a BSEP inhibitor in our baseline human model. The difference in liver BA area under the curves (AUCs) over the course of simulated drug administration in the presence and absence of the theoretical inhibitor is given in Table 1. In all zones of the liver, increases were observed in the AUC of bulk BAs, CDCA–amide conjugates, and LCA–sulfate conjugates. Meanwhile, the AUC of unconjugated CDCA and unconjugated LCA actually decreased, while the AUC of amide-conjugated LCA remained about the same.
Table 1. Bile acid changes in a model of human bile acid inhibition in the periportal and centrilobular zones of the liver.
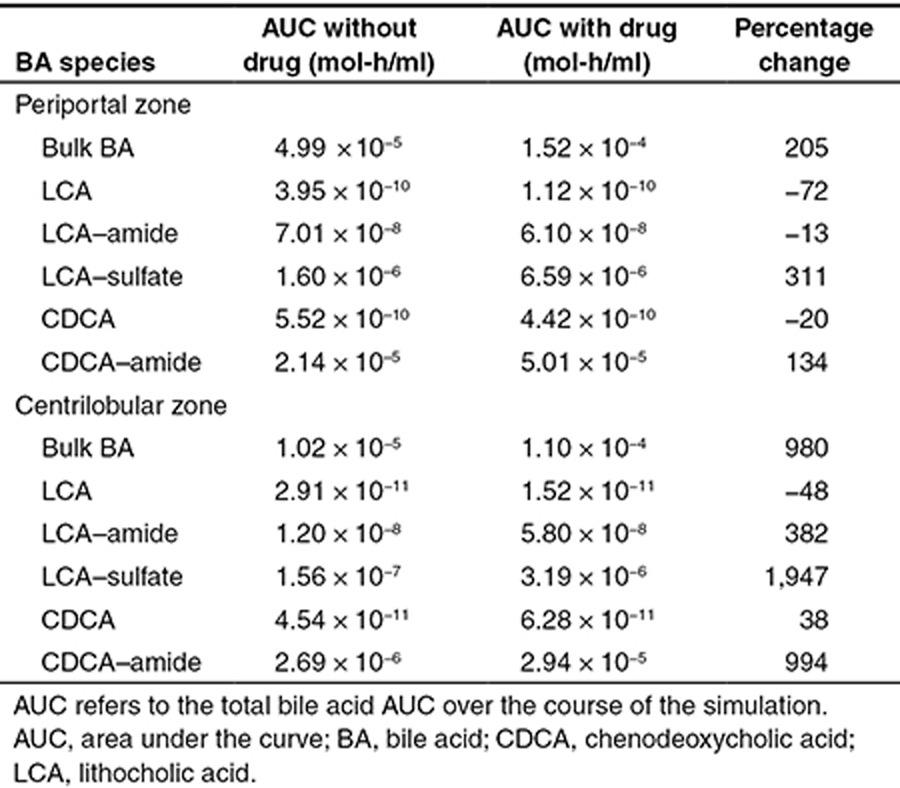
The changes in BA concentrations with inhibitor as a function of the zonality of the liver were also examined using DILIsym (Table 1). In the periportal region, where most BAs are concentrated, the results were similar to those of the overall liver. However, in the centrilobular region, all BA species except for unconjugated LCA increased significantly. For CDCA–amide and LCA–sulfate conjugates, the increases in AUC were far greater than those predicted in the periportal region. However, the absolute centrilobular AUC remained lower than the absolute periportal AUC for all BA species.
The large model human population was used to understand the sensitivity of the model parameters to BA accumulation. The most important variables for the accumulation of each BA species in simulated human liver are shown in Table 2. Since the baseline human model simulations suggested that CDCA–amide and LCA–sulfate were the most likely BA species to accumulate in the liver, we assessed the correlation between changes in system parameters and increases in CDCA–amide and LCA–sulfate concentrations. The sensitivity analysis suggested that BSEP expression, as represented by CDCA–amide canalicular transport Vmax, was the most important variable for CDCA–amide accumulation, while the magnitude of LCA synthesis in the gut was the most important variable for LCA–sulfate accumulation.
Table 2. Correlation coefficients for the 10 most correlated system parameters to hepatic CDCA–amide accumulation and LCA–sulfate accumulation.
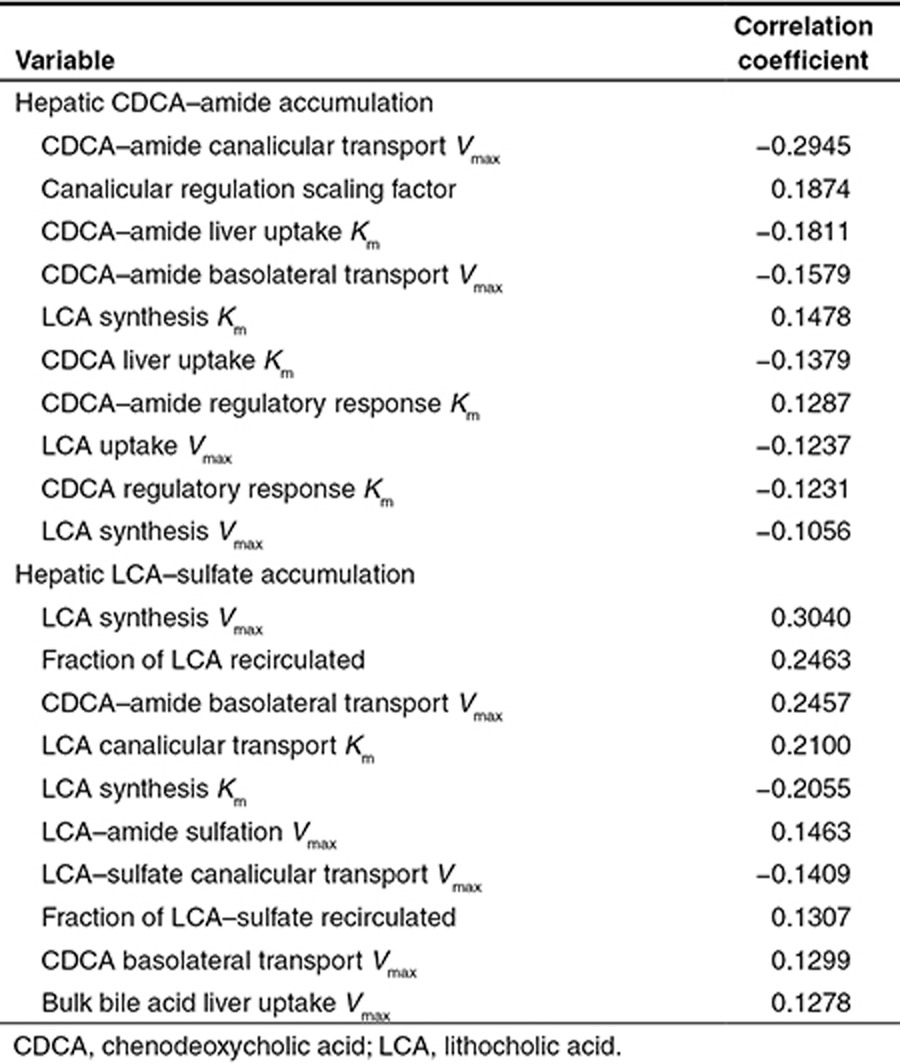
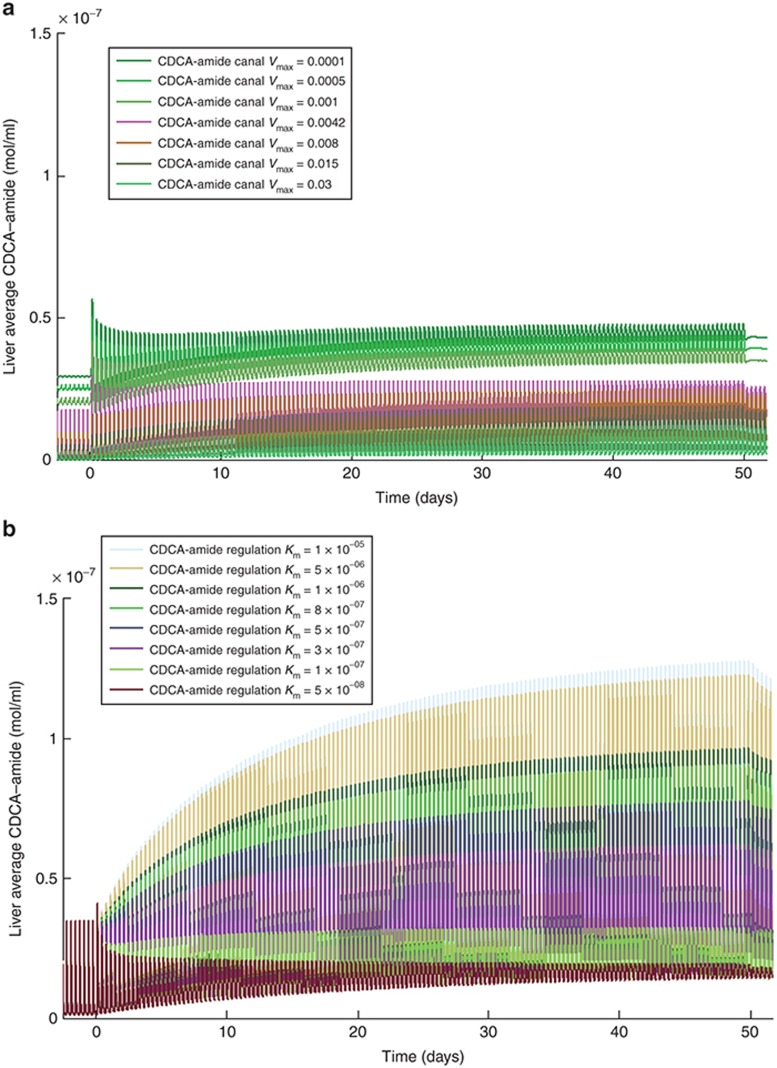
The difference in hepatic CDCA–amide accumulation when CDCA–amide canalicular efflux Vmax changes compared to when the canalicular transport regulation scaling factor changes (which roughly corresponds to the magnitude of the response of BA transporter expression to FXR activation), as seen in Figure 4, is particularly instructive. When CDCA–amide canalicular efflux Vmax was varied, the baseline CDCA–amide concentration of the individual changed; however, the percentage increase in CDCA–amide concentration after administration of the inhibitor was approximately constant across the variable range. In contrast, when the canalicular regulation scaling factor was varied, the baseline concentration of CDCA–amide remained the same (although meal fluctuations were more pronounced with less regulation), while the percentage increase in CDCA–amide concentration was much higher when canalicular transport regulation was lower.
Figure 4.
Change in simulated liver CDCA–amide concentration over 50 days of administration of a model bile salt export pump (BSEP) inhibitor (described in detail in the Supplementary Materials online) at varying values of (a) CDCA–amide canalicular transport (BSEP) Vmax and (b) CDCA–amide regulatory response Km. CDCA, chenodeoxycholic acid.
Discussion
The novel in vivo data included herein demonstrate the importance of considering population variability and individual characteristics in any model of BA homeostasis and its disruption. The variability between rats shrouded the detection of changes in BA due to low concentrations of glibenclamide (Cmax: 500–10,000 ng/ml) and the resultant transporter inhibition. The lack of an apparent exposure/response effect in the individual BA data is due to the population variability. Even with higher doses of glibenclamide, when an exposure/response relationship was observed, we found that there was a wide range of responses, as measured by a fold increase in BA concentrations, among the rats with glibenclamide Cmax higher than 10,000 ng/ml. Few rats reached the higher drug-exposure levels; further experiments, perhaps using a more readily absorbed formulation of glibenclamide, could help illuminate this effect. The variability in the results also makes model validation difficult, as our ability to reproduce the experimental conditions (including individual rats' initial plasma and liver BA concentrations) within the context of a simulation is challenging; while our model is reasonably validated, further experimentation in this area will continue to improve our representation.
Our results suggest that due to the population variability inherent in the BA system, a baseline model is of limited utility for predicting the response of rats (or patients) to BA transporter inhibitors. A baseline model is useful for gleaning interesting information about the basic behavior of the system, but quantitative predictions of BA increases and decreases should not be based on the behavior of a baseline BA model. Constructing an appropriate population for the human model is, therefore, of the utmost importance for the prediction of BA-mediated DILI. To that end, we used the BA model to identify the most important parameters that are likely to vary among individuals. These parameters should be included in the creation of a reasonable population for the prediction of BA toxicity.
The model suggests that the end-product BA conjugates are the BA species that are most likely to accumulate in the liver. This is likely due to the fact that the conjugation of BAs is fairly rapid in the liver, and these pathways do not easily saturate. Previous research has placed the Km for BA amidation in the 1 mmol/l range,31 which is several orders of magnitude higher than typical in vivo unconjugated BA concentrations. As a result of the predicted accumulation of BA conjugates in the liver, BA amide and sulfate conjugates are potential liver toxicophores; the toxicity of these molecules should be explored and quantified with future experimentation.
The model also suggests that an interesting zonal effect exists in BA accumulation. Centrilobular cells, which generally have a lower BA concentration than their periportal counterparts,32 have a much higher predicted relative accumulation of all BA species. In fact, the AUC of unconjugated BAs was predicted to increase in the centrilobular zone, even though the same BAs' AUC decreased in the periportal zone. Despite the differential BA changes in the two zones, the absolute AUC of BAs in the centrilobular zone was predicted to remain lower than the periportal zone. However, if centrilobular cells are more sensitive to BA toxicity than periportal cells, an increase in BA concentrations could lead to zonal centrilobular toxicity. Indeed, some case reports of liver injury due to glibenclamide demonstrate centrilobular injury.2,3 The investigation of the differential effects of BAs on centrilobular and periportal liver cell toxicity would be another interesting and worthwhile experiment.
Simulations using a model population provided further insight into the most valuable experiments that could be performed to improve our understanding of BA-mediated DILI. Among the many system unknowns varied within the model population, the most important variables included LCA synthesis in the gut and the regulatory response to BA accumulation. Therefore, quantifying LCA synthesis in the gut in addition to changes in BSEP expression and activity with increasing hepatocyte BA concentrations would be important and impactful experiments. The importance of BSEP expression levels to BA accumulation in hepatocytes, for example, could be quantified using existing animal or in vitro models.
The modeling also revealed the importance of transporter expression levels on the behavior of the system; however, it is important to note a key difference between the behavior of the system when these expression levels are varied and its behavior when the regulatory response is varied. When transporter expression levels—especially canalicular transporter levels—are decreased, the baseline BA concentration in the liver increases; the percentage increase in BAs after dosing the inhibitor remains somewhat constant. Varying the magnitude of the regulatory response (FXR activation), by contrast, does not have a large effect on baseline BA concentrations in the liver; however, the percentage increase in BAs after inhibitor dosing is highly variable. Both transporter expression levels and the magnitude of the regulatory response are expected to vary within a population; however, only the variability in transporter expression levels may be apparent in untreated individuals. This result suggests both the promise and the limitations of prescreening individuals for certain risk factors before prescribing known BSEP inhibitors.
Methods
The BA submodel in DILIsym comprises several components. It includes (i) the synthesis and metabolism of BAs in hepatocytes, (ii) the basolateral and canalicular active transport of BAs, (iii) the release of BAs from the gallbladder in humans, (iv) the synthesis of secondary BAs and deconjugation of BAs in the gut, (v) the recirculation of BAs from the gut and subsequent active uptake by the liver, and (vi) the regulatory effects of BAs on transporter expression and BA synthesis. The model contains representations of LCA and CDCA and its conjugates, the BA species most frequently linked to toxicity in in vitro experiments,20,21,33,34 and a “bulk” BA representation that contains the other BAs. A more detailed description of the BA homeostasis model and its parameterization is presented in the Supplementary Materials online.
To represent BA dynamics in humans, the model was optimized to the known profile of BAs in serum published by Trottier et al.,35 as well as to overall concentrations of BAs in the liver measured by Setchell36 and García-Cañaveras et al.37 There were 47 system variables that were either unknown or expected to vary within the human population that were fit to the BA profile; a list of the variables used in the optimization is provided in the Supplementary Materials online. The optimization of the model based on the published BA profile was performed in a manner similar to the SimPops method outlined in previous publications, wherein a genetic algorithm was used to generate values of variable parameters that lead to model outcomes (in this case, BA profiles) that are within the range of experimental data.27,28 Using this optimization method allowed the selection of a population of 2,400 individuals with reasonable baseline BA concentrations for the large human sample population. A smaller, 10-parameter, 331-individual SimPops was also constructed for the purpose of model validation. While the large population was given artificially wide parameter ranges for the purpose of the sensitivity analysis, the small human sample population was constructed with more constrained parameter ranges for the purpose of approximating a plausible population of humans. For example, the transporter Vmax ranges included four orders of magnitude in the large population, but were constrained to ranges suggested by transporter expression profiles from Meier et al.25 in the small population.
A smaller SimPops was constructed in rats for the validation against the experimental data. A population of 191 rats using a more limited 11 variable set (Supplementary Table S4 online) was generated. This population was intended to represent rats with both plausible serum BA concentrations and plausible values for the parameters that were varied. The baseline rat model was optimized to the BA profile from the control rats in the present experiment, and the SimPops was constructed around this baseline.
Details on the simulations performed for the model validation and for the model exploration can be found in the Supplementary Materials online. Multivariate analysis on the population sample was performed using JMP 9 from SAS (Cary, NC).
Multiple-dose glibenclamide study in rats
For the BA-profiling experiments, 16 male 8- to 9-week-old CD-1 rats from Charles River Laboratories (Raleigh, NC) weighing between 200 and 300 g were randomized into four groups of four animals each. These groups were administered daily doses of either the vehicle control (0.5% hydroxypropylmethylcellulose /0.1% Tween 80 in water) or glibenclamide (Sigma-Aldrich, St Louis, MO) in vehicle via oral gavage for 7 days at three dose levels (300, 750, and 1,500 mg/kg/day). Details on the treatment of the rats are available in the Supplementary materials online.
Rats underwent a viability check twice per day, and detailed clinical observations were taken at least twice over the course of the study. Blood was drawn for serum BA profiles at 1, 3, 6, and 24 h after dosing on day 1 and day 7, and glibenclamide concentrations were measured for toxicokinetic analysis using the same blood samples from day 7. The animals were euthanized under isoflourane anesthesia on day 8 and underwent necropsy. Clinical and anatomic pathology data were collected from the animals, and these results are reported in the Supplementary Materials online. The serum BA concentrations from day 1 were used for comparison to the simulation results.
BA profiling in serum was performed using liquid chromatography–tandem mass spectrometry analysis at GlaxoSmithKline (Ware, UK). BAs in liver tissue 24 h after the final dose also were profiled; results from this analysis, as well as the liquid chromatography–tandem mass spectrometry analytical method, are presented in the Supplemental Materials online. This study was conducted in accordance with the GlaxoSmithKline Policy on the Care, Welfare and Treatment of Laboratory Animals and was reviewed by the Institutional Animal Care and Use Committee.
For this experiment, doses of glibenclamide were administered every 24 h for 7 days. Systemic exposure data were compared to simulation results for day 7; day 1 BA data were compared to simulated BA concentrations on day 1.
Short-term glibenclamide studies in rats
For the short-term studies, male Han Wistar rats (substrain AlpkHsdBrlHan:WIST; AstraZeneca, Macclesfield, UK) of 10–12-week age (300–400 g) were used. Details on the treatment of the rats used in this study are available in the Supplemental Materials online. All animals were treated in accordance with approved UK Home Office license requirements.
Two experiments were performed in which total plasma BA concentrations and glibenclamide plasma concentrations were determined. Glibenclamide (Sigma-Aldrich) was formulated as a solution or suspension in hydroxypropyl-β-cyclodextrin (Acros Organics, distributed by Fisher Scientific, Loughborough, UK) in aqueous 0.2 mol/l Na2CO3/NaHCO3 buffer (pH 10). In the first experiment (29 animals), four groups of five animals received a single dose via oral gavage of 50, 250, and 500 mg/kg glibenclamide or 10% (w/v) hydroxypropyl-β-cyclodextrin vehicle alone, and blood samples were taken at 1, 6, and 24 h after dosing; an additional three animals per glibenclamide-treated group received a single dose of 50, 250, and 500 mg/kg glibenclamide, and blood samples were taken at 1, 3, 6, 12, and 24 h after dosing. In the second experiment (20 animals), two groups of five animals each received two oral doses of 250 and 500 mg/kg glibenclamide in 20% (w/v) hydroxypropyl-β-cyclodextrin vehicle at 0 and 4 h, and blood samples were taken predose and at 0.5, 1, 2, and 4 h after dosing; blood samples from an additional five animals per glibenclamide-treated group were taken predose and 1 h after dosing to increase the dataset for this time point. Details on the blood-sampling procedure are located in the Supplementary Materials online. Animals were dosed 2 h into the light cycle.
Author Contributions
J.L.W. wrote the manuscript. J.L.W., K.Y., S.Q.S., S.H.S., J.L.A., K.L.R.B., P.B.W., and B.A.H. designed the research. J.L.W. and K.Y. performed the research. J.L.W., K.Y., S.Q.S., S.H.S., J.L.A., D.B., and B.A.H. analyzed the data. D.B. contributed new analytical tools.
Conflict of Interest
The authors declared no conflict of interest.
Study Highlights
Acknowledgments
We thank J. Gerry Kenna, Peter Webborn, and Francois Pognan for scientific discussion and Paul C. Courtney, Andrew Flint, Andrew Downes, Steve Horner, and members of Clinical Pathology and the Formulation & Analytical Support Group at AstraZeneca, Macclesfield, UK, for excellent technical support. For the repeat-dose rat study, we thank the GlaxoSmithKline RTP Safety Assessment Resources group for study conduct and Holly Jordan and Christine Merrill for pathology support. This research was supported in part by the National Institute of General Medical Sciences of the National Institutes of Health under award number R01 GM041935. The content is solely the responsibility of the authors and does not necessarily represent the official views of the National Institutes of Health. We also acknowledge funding from Amgen Inc. and from the partners of the DILI-sim Initiative (http://www.dilisym.com).
Supplementary Material
References
- Dawson S., Stahl S., Paul N., Barber J., Kenna J.G. In vitro inhibition of the bile salt export pump correlates with risk of cholestatic drug induced liver injury in man. Drug Metab. Dispos. 2012;40:130–138. doi: 10.1124/dmd.111.040758. [DOI] [PubMed] [Google Scholar]
- van Basten J.P., van Hoek B., Zeijen R., Stockbrügger R. Glyburide-induced cholestatic hepatitis and liver failure. Case-report and review of the literature. Neth. J. Med. 1992;40:305–307. [PubMed] [Google Scholar]
- Goodman R.C., Dean P.J., Radparvar A., Kitabchi A.E. Glyburide-induced hepatitis. Ann. Intern. Med. 1987;106:837–839. doi: 10.7326/0003-4819-106-6-837. [DOI] [PubMed] [Google Scholar]
- Leslie E.M., Watkins P.B., Kim R.B., Brouwer K.L. Differential inhibition of rat and human Na+-dependent taurocholate cotransporting polypeptide (NTCP/SLC10A1)by bosentan: a mechanism for species differences in hepatotoxicity. J. Pharmacol. Exp. Ther. 2007;321:1170–1178. doi: 10.1124/jpet.106.119073. [DOI] [PubMed] [Google Scholar]
- Jaeschke H. Troglitazone hepatotoxicity: are we getting closer to understanding idiosyncratic liver injury. Toxicol. Sci. 2007;97:1–3. doi: 10.1093/toxsci/kfm021. [DOI] [PubMed] [Google Scholar]
- Funk C., et al. Troglitazone-induced intrahepatic cholestasis by an interference with the hepatobiliary export of bile acids in male and female rats. Correlation with the gender difference in troglitazone sulfate formation and the inhibition of the canalicular bile salt export pump (Bsep) by troglitazone and troglitazone sulfate. Toxicology. 2001;167:83–98. doi: 10.1016/s0300-483x(01)00460-7. [DOI] [PubMed] [Google Scholar]
- Peroukides S., et al. Lapatinib-induced hepatitis: a case report. World J. Gastroenterol. 2011;17:2349–2352. doi: 10.3748/wjg.v17.i18.2349. [DOI] [PMC free article] [PubMed] [Google Scholar]
- Bova M.P., Tam D., McMahon G., Mattson M.N. Troglitazone induces a rapid drop of mitochondrial membrane potential in liver HepG2 cells. Toxicol. Lett. 2005;155:41–50. doi: 10.1016/j.toxlet.2004.08.009. [DOI] [PubMed] [Google Scholar]
- Castellino S., O'Mara M., Koch K., Borts D.J., Bowers G.D., MacLauchlin C. Human metabolism of lapatinib, a dual kinase inhibitor: implications for hepatotoxicity. Drug Metab. Dispos. 2012;40:139–150. doi: 10.1124/dmd.111.040949. [DOI] [PubMed] [Google Scholar]
- Thompson R.A., et al. In vitro approach to assess the potential for risk of idiosyncratic adverse reactions caused by candidate drugs. Chem. Res. Toxicol. 2012;25:1616–1632. doi: 10.1021/tx300091x. [DOI] [PubMed] [Google Scholar]
- Garzel B., Yang H., Zhang L., Huang S.M., Polli J.E., Wang H. The role of bile salt export pump gene repression in drug-induced cholestatic liver toxicity. Drug Metab. Dispos. 2014;42:318–322. doi: 10.1124/dmd.113.054189. [DOI] [PMC free article] [PubMed] [Google Scholar]
- Kullak-Ublick G.A., Stieger B., Hagenbuch B., Meier P.J. Hepatic transport of bile salts. Semin. Liver Dis. 2000;20:273–292. doi: 10.1055/s-2000-9426. [DOI] [PubMed] [Google Scholar]
- Hofmann A.F. The enterohepatic circulation of bile acids in mammals: form and functions. Front. Biosci. (Landmark Ed) 2009;14:2584–2598. doi: 10.2741/3399. [DOI] [PubMed] [Google Scholar]
- Chiang J.Y. Bile acids: regulation of synthesis. J. Lipid Res. 2009;50:1955–1966. doi: 10.1194/jlr.R900010-JLR200. [DOI] [PMC free article] [PubMed] [Google Scholar]
- Li T., Chiang J.Y. Nuclear receptors in bile acid metabolism. Drug Metab. Rev. 2013;45:145–155. doi: 10.3109/03602532.2012.740048. [DOI] [PMC free article] [PubMed] [Google Scholar]
- Jung D., Elferink M.G., Stellaard F., Groothuis G.M. Analysis of bile acid-induced regulation of FXR target genes in human liver slices. Liver Int. 2007;27:137–144. doi: 10.1111/j.1478-3231.2006.01393.x. [DOI] [PubMed] [Google Scholar]
- Modica S., Gadaleta R.M., Moschetta A. Deciphering the nuclear bile acid receptor FXR paradigm. Nucl. Recept. Signal. 2010;8:e005. doi: 10.1621/nrs.08005. [DOI] [PMC free article] [PubMed] [Google Scholar]
- Abrahamsson A., et al. Feedback regulation of bile acid synthesis in human liver: importance of HNF-4alpha for regulation of CYP7A1. Biochem. Biophys. Res. Commun. 2005;330:395–399. doi: 10.1016/j.bbrc.2005.02.170. [DOI] [PubMed] [Google Scholar]
- Jonker J.W., Liddle C., Downes M. FXR and PXR: potential therapeutic targets in cholestasis. J. Steroid Biochem. Mol. Biol. 2012;130:147–158. doi: 10.1016/j.jsbmb.2011.06.012. [DOI] [PMC free article] [PubMed] [Google Scholar]
- Hofmann A.F. Detoxification of lithocholic acid, a toxic bile acid: relevance to drug hepatotoxicity. Drug Metab. Rev. 2004;36:703–722. doi: 10.1081/dmr-200033475. [DOI] [PubMed] [Google Scholar]
- Rolo A.P., Palmeira C.M., Wallace K.B. Interactions of combined bile acids on hepatocyte viability: cytoprotection or synergism. Toxicol. Lett. 2002;126:197–203. doi: 10.1016/s0378-4274(01)00464-7. [DOI] [PubMed] [Google Scholar]
- Delzenne N.M., Calderon P.B., Taper H.S., Roberfroid M.B. Comparative hepatotoxicity of cholic acid, deoxycholic acid and lithocholic acid in the rat: in vivo and in vitro studies. Toxicol. Lett. 1992;61:291–304. doi: 10.1016/0378-4274(92)90156-e. [DOI] [PubMed] [Google Scholar]
- Crocenzi F.A., et al. Impaired localisation and transport function of canalicular Bsep in taurolithocholate induced cholestasis in the rat. Gut. 2003;52:1170–1177. doi: 10.1136/gut.52.8.1170. [DOI] [PMC free article] [PubMed] [Google Scholar]
- Attili A.F., Angelico M., Cantafora A., Alvaro D., Capocaccia L. Bile acid-induced liver toxicity: relation to the hydrophobic-hydrophilic balance of bile acids. Med. Hypotheses. 1986;19:57–69. doi: 10.1016/0306-9877(86)90137-4. [DOI] [PubMed] [Google Scholar]
- Meier Y., et al. Interindividual variability of canalicular ATP-binding-cassette (ABC)-transporter expression in human liver. Hepatology. 2006;44:62–74. doi: 10.1002/hep.21214. [DOI] [PubMed] [Google Scholar]
- Hardwick R.N., Fisher C.D., Canet M.J., Scheffer G.L., Cherrington N.J. Variations in ATP-binding cassette transporter regulation during the progression of human nonalcoholic fatty liver disease. Drug Metab. Dispos. 2011;39:2395–2402. doi: 10.1124/dmd.111.041012. [DOI] [PMC free article] [PubMed] [Google Scholar]
- Woodhead J.L., et al. An analysis of N-acetylcysteine treatment for acetaminophen overdose using a systems model of drug-induced liver injury. J. Pharmacol. Exp. Ther. 2012;342:529–540. doi: 10.1124/jpet.112.192930. [DOI] [PubMed] [Google Scholar]
- Howell B.A., et al. In vitro to in vivo extrapolation and species response comparisons for drug-induced liver injury (DILI) using DILIsym™: a mechanistic, mathematical model of DILI. J. Pharmacokinet. Pharmacodyn. 2012;39:527–541. doi: 10.1007/s10928-012-9266-0. [DOI] [PubMed] [Google Scholar]
- Bachhav Y.G., Patravale V.B. SMEDDS of glyburide: formulation, in vitro evaluation, and stability studies. AAPS PharmSciTech. 2009;10:482–487. doi: 10.1208/s12249-009-9234-1. [DOI] [PMC free article] [PubMed] [Google Scholar]
- James O., et al. Liver damage after paracetamol overdose. Comparison of liver-function tests, fasting serum bile acids, and liver histology. Lancet. 1975;2:579–581. doi: 10.1016/s0140-6736(75)90170-1. [DOI] [PubMed] [Google Scholar]
- Falany C.N., Johnson M.R., Barnes S., Diasio R.B. Glycine and taurine conjugation of bile acids by a single enzyme. Molecular cloning and expression of human liver bile acid CoA:amino acid N-acyltransferase. J. Biol. Chem. 1994;269:19375–19379. [PubMed] [Google Scholar]
- Lindblad L., Lundholm K., Schersten T. Bile acid concentrations in systemic and portal serum in presumably normal man and in cholestatic and cirrhotic conditions. Scand. J. Gastroenterol. 1977;12:395–400. doi: 10.3109/00365527709181679. [DOI] [PubMed] [Google Scholar]
- Heuman D.M. Quantitative estimation of the hydrophilic-hydrophobic balance of mixed bile salt solutions. J. Lipid Res. 1989;30:719–730. [PubMed] [Google Scholar]
- Heuman D.M., Pandak W.M., Hylemon P.B., Vlahcevic Z.R. Conjugates of ursodeoxycholate protect against cytotoxicity of more hydrophobic bile salts: in vitro studies in rat hepatocytes and human erythrocytes. Hepatology. 1991;14:920–926. doi: 10.1002/hep.1840140527. [DOI] [PubMed] [Google Scholar]
- Trottier J., Caron P., Straka R.J., Barbier O. Profile of serum bile acids in noncholestatic volunteers: gender-related differences in response to fenofibrate. Clin. Pharmacol. Ther. 2011;90:279–286. doi: 10.1038/clpt.2011.124. [DOI] [PMC free article] [PubMed] [Google Scholar]
- Setchell K.D., et al. Bile acid concentrations in human and rat liver tissue and in hepatocyte nuclei. Gastroenterology. 1997;112:226–235. doi: 10.1016/s0016-5085(97)70239-7. [DOI] [PubMed] [Google Scholar]
- García-Cañaveras J.C., Donato M.T., Castell J.V., Lahoz A. Targeted profiling of circulating and hepatic bile acids in human, mouse, and rat using a UPLC-MRM-MS-validated method. J. Lipid Res. 2012;53:2231–2241. doi: 10.1194/jlr.D028803. [DOI] [PMC free article] [PubMed] [Google Scholar]
Associated Data
This section collects any data citations, data availability statements, or supplementary materials included in this article.


