Abstract
Alcohol is a teratogen that has diverse effects on brain and craniofacial development, leading to a constellation of developmental disorders referred to as fetal alcohol spectrum disorder (FASD). The molecular basis of ethanol insult remains poorly understood, as does the relationship between molecular and behavioral changes as a consequence of prenatal ethanol exposure. Zebrafish embryos were exposed to a range of ethanol concentrations (0.5–5.0%) during defined developmental stages, and examined for morphological phenotypes characteristic of FASD. Embryos were also analyzed by in situ hybridization for changes in expression of defined cell markers for neural cell types that are sonic hedgehog-dependent. We show that transient binge-like ethanol exposures during defined developmental stages, such as early gastrulation and early neurulation, result in a range of phenotypes and changes in expression of Shh-dependent genes. The severity of fetal alcohol syndrome (FAS) morphological phenotypes, such as microphthalmia, depends on the embryonic stage and concentration of alcohol exposure, as does diminution of retinal Pax6a or forebrain and hindbrain GAD1 gene expression. We also show that changes in eye and brain morphology correlate with changes in Pax6a and GAD1 gene expression. Our results therefore show that transient binge-like ethanol exposures in zebrafish embryos produce the stereotypical morphological phenotypes of FAS, with the severity of phenotypes depending on the developmental stage and alcohol concentration of exposure.
Keywords: FASD, Sonic hedgehog, agrin, zebrafish, ethanol
1. INTRODUCTION
Alcohol is a teratogen that adversely affects brain and craniofacial development (Sulik et al., 1981; Sulik et al., 1986; Jones and Smith, 2003). In humans prenatal alcohol exposure results in congenital abnormalities affecting the development of numerous brain regions, which includes eyes (Stromland, 1985; Chan et al., 1991; Stromland and Pinazo-Duran, 1994), auditory structures (Church and Kaltenbach, 1997) and cerebral cortex (Clarren et al., 1978; Mattson and Riley, 1996). Understanding the mechanisms that lead to fetal alcohol spectrum disorders (FASD) is a critical emphasis of FASD research, and rodent studies have provided important insights into understanding the pathologies and likely molecular targets of ethanol exposure during fetal development. Rodent models have helped identify key molecular bases of FASD, but the processes by which these molecular disruptions lead to abnormal neurodevelopment and behavioral dysfunction are difficult to study in rodents given their inaccessibility during embryonic development. Zebrafish, with their clear chorion and accessibility of embryos, can provide the needed information about the processes of neuromolecular disruption by alcohol.
Since a wide range of developmental processes are perturbed as a consequence of ethanol exposure, it is critical to that the genetic mechanisms that underlie the effects of ethanol are identified. A wealth of evidence indicates that ethanol may exert its effects on brain development via disruption of extracellular matrix (ECM) function, with genes encoding key ECM proteins, such as Fgf2 and Fgf8, being affected by ethanol exposure in prenatal mice (Hard et al., 2005; Rubert et al., 2006; Aoto et al., 2008). Ethanol also perturbs neuronal interactions with the ECM protein laminin, disrupting laminin-mediated axon growth and cell migration (Liesi, 1997). In limb patterning ethanol appears to disrupt this process via perturbation of Fgf8 and sonic hedgehog (Shh) signaling (Chrisman et al., 2004). Shh signaling appears to be a critical target of prenatal ethanol exposure, with disruption of this morphogen’s function likely being responsible for the craniofacial abnormalities of FAS (Ahlgren et al., 2002; Arenzana et al., 2006; Li et al., 2007; Aoto et al., 2008; Loucks and Ahlgren, 2009; Zhang et al., 2013). Prenatal ethanol exposure during gastrulation and early neurulation also disrupts Shh gene expression in mouse and chick embryos, resulting in phenotypes characteristic of perturbed Shh signaling (Ahlgren et al., 2002; Loucks et al., 2007; Aoto et al., 2008). Many of these ECM molecules identified as targets of ethanol have their function modulated by interactions with heparan sulfate proteoglycans (HSPGs), consistent with a reduction in heparan sulfate synthesis following ethanol exposure (Dow and Riopelle, 1990). A major focus of our laboratory has been the analysis of the function of the HSPG agrin during zebrafish development, and in particular in response to ethanol exposure during zebrafish CNS development (Kim et al., 2007; Liu et al., 2008; Zhang et al., 2011; 2013). Our recent studies demonstrated that ethanol-mediated disruption of zebrafish ocular development and GABAergic neuronal differentiation results from perturbed agrin and Shh function (Zhang et al., 2011; 2013).
A potential limitation of many previous ethanol experiments in zebrafish is that the studies utilized chronic exposures of zebrafish embryos to ethanol, sometimes exceeding one day. These typical ethanol exposure times likely suffer from not representing the behavior of a pregnant woman drinking alcohol during pregnancy. For example, the widely used 6–24 hours post-fertilization (hpf) exposure time likely would be equivalent to a pregnant woman drinking throughout a significant portion of the first trimester of pregnancy. Using this chronic exposure protocol, the majority of zebrafish embryos exposed to high-dose ethanol do not survive past the larval stage (Zhang et al., 2011; 2013). Thus, our goal in the present studies was to use transient ethanol exposures in zebrafish that more accurately mimic binge-like alcohol abuse by a pregnant woman and binge-like ethanol exposure in during rodent fetal development. The current studies were designed to test the hypothesis that transient ethanol exposure during defined periods of zebrafish embryogenesis would result in morphological and gene expression phenotypes characteristic of FAS and FASD, and similar to our previous observations following chronic alcohol exposure during zebrafish development.
2. MATERIALS AND METHODS
2.1 Animals
Zebrafish were obtained from Zebrafish International Resource Center. The AB strain was used in these studies and fish were housed in automatic fish housing systems (Aquaneering, San Diego, CA) at 28.5° C. All procedures using zebrafish were approved by the NCCU IACUC.
2.2 Ethanol treatment of zebrafish embryos
Zebrafish embryos in fish water containing a 1:500 dilution of 0.1% methylene blue (to prevent fungal infection) were exposed to 0.5%, 1%, 3% or 5% ethanol from 5.25–6.25, 8–10 or 24–27 hpf. We focused on three embryonic stages for analysis: 5.25– 6.25 hpf, the first hour of zebrafish gastrulation; 8–10 hpf, the transition from gastrulation to neurulation in zebrafish; and 24–27 hpf, a key CNS developmental stage characterized by the formation of the 5-vesicle brain. Figure 1 summarizes the main experiments summarized in Results, showing time of ethanol exposures, MO treatments and analyses conducted. Ethanol was diluted with fish water to its final concentration, and at the selected developmental stage embryos were placed in fresh fish water containing ethanol. Embryos were incubated in 100 mm plates with fish water containing ethanol, with 8–30 embryos per plate. Each experiment was repeated at least 3 times, and the combined number of embryos used to calculate ratios of embryos showing effects in response to ethanol exposure. At the end of the exposure period fish water containing ethanol was removed, embryos were washed once with fresh fish water, and then transferred to fresh fish water for the remainder of the experimental time-course. Ethanol concentrations were analyzed as previously described (Zhang et al., 2013) in embryos with intact chorion that were exposed to 1%, 3% or 5% ethanol.
Figure 1.

Experimental design for ethanol exposure and MO treatment of zebrafish embryos. This schematic diagram summarizes the developmental times embryos were exposed to ethanol, and/or injected with MO, and then analyzed for morphological phenotypes (MHB or eye size) and gene expression changes.
Eye size was measured at 2 dpf as previously described (Zhang et al, 2011), and involved measuring the longest axis along the eye, and calculated against a standard 10 µm ruler under the same magnification. For 2 dpf eye, we designated a diameter less than 240 µm as small eye phenotype, since all untreated eyes were at least 250 µm diameter. Malformation of the MHB was assessed visually based on absence of the defined border between the midbrain and hindbrain. The presence of the MHB was defined as the presence of 3 or 4 ridges (tectal and cerebellar boundaries) perpendicular to the AP axis of the CNS at the midbrain-hindbrain junction. Absence of this defined border was scored as a disruption of MHB development.
2.3 Sorting of embryos into phenotype and no-phenotype groups based on gene expression levels
During our studies we observed that only a subfraction of embryos exhibited morphological hallmarks of FAS as well as gene expression changes. To determine if changes in gene expression were associated with morphological changes we sorted embryos after in situ hybridization based on Pax6a or GAD1 expression levels, into groups designated as normal gene expression levels and reduced gene expression levels. For these two groups of embryos eye size was then quantified as described above.
2.4 Whole-mount in situ hybridization
Whole-mount in situ hybridization was performed as previously described, with probe hybridization at 65°C (Kim et al., 2007; Liu et al., 2008). Digoxygenin-labeled riboprobes were transcribed from cDNAs encoding Pax6a or GAD1 as previously described (Zhang et al., 2011; 2013). Embryos were cleared in 50% glycerol and then viewed using an Olympus MVX-10 stereomicroscope. Stained embryos were then analyzed by two different individuals to score embryos for altered or normal staining as a result of treatment, with the second laboratory member scoring the embryos being blinded to the treatments. In most cases their scoring of gene expression levels was the same as the unblinded laboratory member. In addition, a post hoc analysis was conducted on random embryos using ImageJ to distinguish the intensely stained areas from weakly stained areas. The areas with the supra-threshold intensity were measured and the ratio against the set area of interest was obtained. Those areas with 10% or higher values were defined as the Unchanged and those with lower than 10% were defined as Reduced gene expression. This analysis confirmed the identification of reduced versus unchanged gene expression patterns by the two individual laboratory members as described above.
2.5 Quantitative real-time PCR analysis of GAD1 gene expression
Embryos exposed to 3% ethanol from 8–10hpf were sorted at 1dpf based on MHB morphology into abnormal MHB and normal MHB groups. Embryos exposed to 3% ethanol from 24–27hpf were sorted at 46hpf based on eye size into small eye and normal eye groups. Embryos from control, 8–10hpf 5% ethanol, 8–10hpf 3% ethanol abnormal MHB, 8–10hpf 3% normal MHB, 24–27hpf 5% ethanol, 24–27hpf 3% ethanol small eye and 24–27hpf 3% normal eye were collected in 4% PFA at 2dpf with 10 embryos in each 1.5ml eppendorf tube. mRNA was extracted with TRIzol reagent (Invitrogen; Catalog Number #15596-026). 1µg mRNA was used for cDNA synthesis using superscript III reverse transcriptase (Invitrogen; Catalog Number #18080-044) and oligo(dT) as primer. 100ng cDNA was used for real time PCR amplification, which was performed with TaqMan® Gene Expression Master Mix (Life technology; Catalog Number #4369016) and TaqMan Gene Expression Assay ID (Dr03080474_g1) (Life technology; Cat. # 4351372) for zebrafish GAD1 expression or TaqMan Gene Expression Assay ID (Dr03432610_m1) (Life technology; Cat. # 4331182) for endogenous control zebrafish ß-actin expression. The PCR reaction plate was run on an Applied Biosystems real-time quantitative PCR instrument using the default PCR thermal cycling conditions. Quantitation of GAD1 was normalized to the internal ß-actin. Relative GAD1 mRNA levels from each treatment group was compared against control, untreated GAD1 mRNA levels.
2.6 Antisense morpholino injection
Antisense morpholino oligonucleotides (MOs) to agrin and Shh (Gene Tools, Philomath, OR) were designed against exon/intron splice sites. The LG2 agrin MO, which we have shown previously to produce mild to severe phenotypes depending on the concentration of MO injected into one-cell embryos (Kim et al., 2007; Zhang et al., 2011), was employed for these studies. We have shown previously that all agrin MO-induced defects are specific and not p53-mediated off-target defects (Liu et al., 2008). MOs were solubilized in water at a concentration of 0.1–1.0 mM before injection into one to two-cell stage embryos. A general control MO purchased from Gene Tools to preclude MO toxicity, and used at the same concentration and volume, produces no detectable effects on zebrafish development either at high concentration or combined with ethanol (Kim et al., 2007; Zhang et al, 2011). For subthreshold agrin or Shh MO experiments, embryos were injected with 0.1 pmol LG2 MO (5’-CCTCTCCTTTAC GCTGTGAAGACAA-3), or 0.15 pmol or 0.3 pmol Shh MO (5'-CAGCACTCTCGTCAAAAGCCGCATT-3'), and then exposed to 1% ethanol at the designated developmental stages.
2.7 Statistical analyses
Graphpad Prism 6.0e was used for two-way ANOVA or one-way ANOVA analysis of all morphological and gene expression data, with statistical significance set at 0.05. For the two-way ANOVA the two factors were alcohol concentration and the treatment timing. We also employed Tukey’s multiple comparison test as a post-hoc test. One-way ANOVA analysis was performed to determine if a statistical significance existed between individual replicates from morphological or gene expression analyses. This one-way ANOVA analysis showed no difference between experimental replicates (data not shown).
3. RESULTS
3.1 Effect of transient ethanol exposure on zebrafish embryo survival
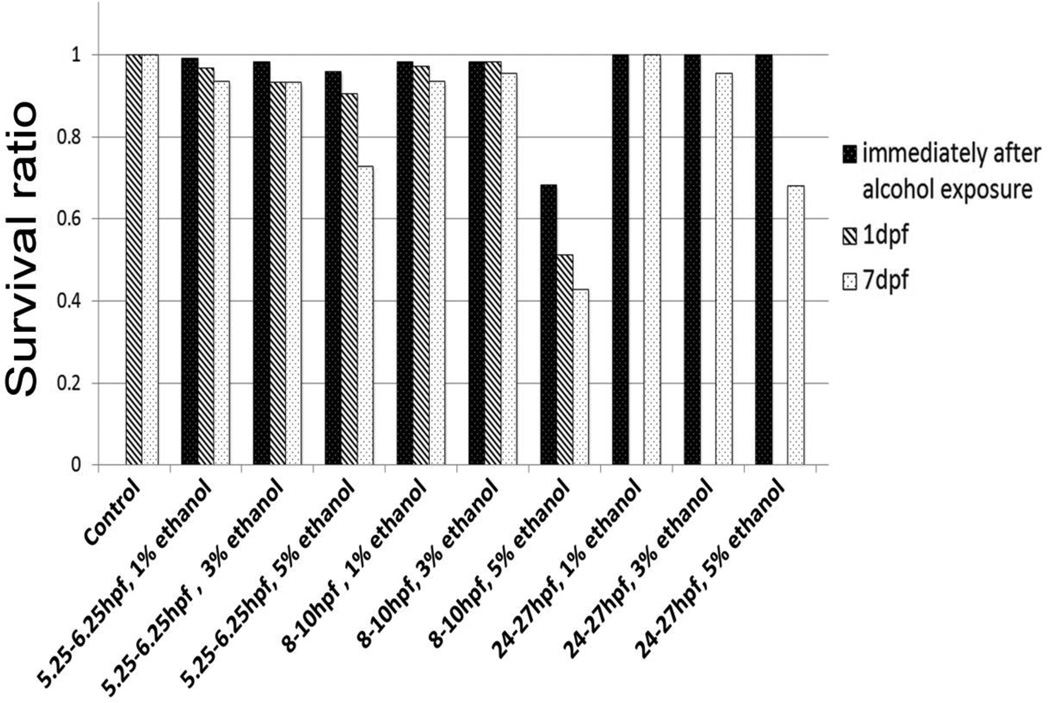
To begin to assess whether transient ethanol exposures would produce the same FAS and FASD phenotypes in zebrafish embryos as observed with chronic ethanol exposure, we exposed zebrafish to ethanol during defined stages of zebrafish embryogenesis. Because previous studies by Ali et al (2011) employed one-hour exposures to 10% ethanol, which at many developmental stages resulted in embryonic lethality, we initially selected an acute 5% ethanol exposure to mimic binge-like alcohol exposure in humans, expecting this ethanol exposure to result in FAS phenotypes. However, due to obvious physical defects in adult zebrafish exposed to 5% ethanol as embryos, primarily characterized by curved bodies (data not shown), we also employed a transient 3% ethanol exposure to induce FAS and FASD phenotypes. Survival of embryos was assessed immediately following ethanol exposures, and then at 1 dpf and 7 dpf (Figure 2). These results show that >90% of embryos survived to 7 dpf following exposure to 1% or 3% ethanol, with only 5% ethanol exposure leading to significant embryo lethality (Figure 2).
Figure 2.
Quantitation of embryo survival following ethanol exposure. Data are shown as percent survival and number of embryos surviving from the total number of embryos treated.
To obtain insight into the tissue ethanol levels of zebrafish embryos following these transient ethanol exposures, we measured ethanol concentrations in homogenized embryos immediately following ethanol exposure (Table 1). Tissue levels of ethanol were approximately 30–35% of the level in solution, comparable to previous reports in zebrafish (Reimers et al, 2004; Zhang et al, 2013).
Table 1.
Ethanol levels in exposed embryos with intact chorion
| Ethanol treatment | Concentration |
|---|---|
| Control | 0.6 ± 0.4 mM |
| 1% ethanol (167 mM) 8–10 hpf |
49.4 ± 4.2 mM |
| 3% ethanol (500 mM) 8–10 hpf |
151.6 ± 6.7 mM |
| 5% ethanol (833 mM) 8–10 hpf |
281.0 ± 6.2 mM |
| 1% ethanol (167 mM) 24–27 hpf |
51.7 ± 5.6 mM |
| 3% ethanol (500 mM) 24–27 hpf |
184.8 ± 12.9 mM |
| 5% ethanol (833 mM) 24–27 hpf |
310.1 ± 10.7 mM |
3.2 Effect of acute ethanol exposure on zebrafish embryo morphology
3.2.1 Midbrain-hindbrain boundary(MHB) formation
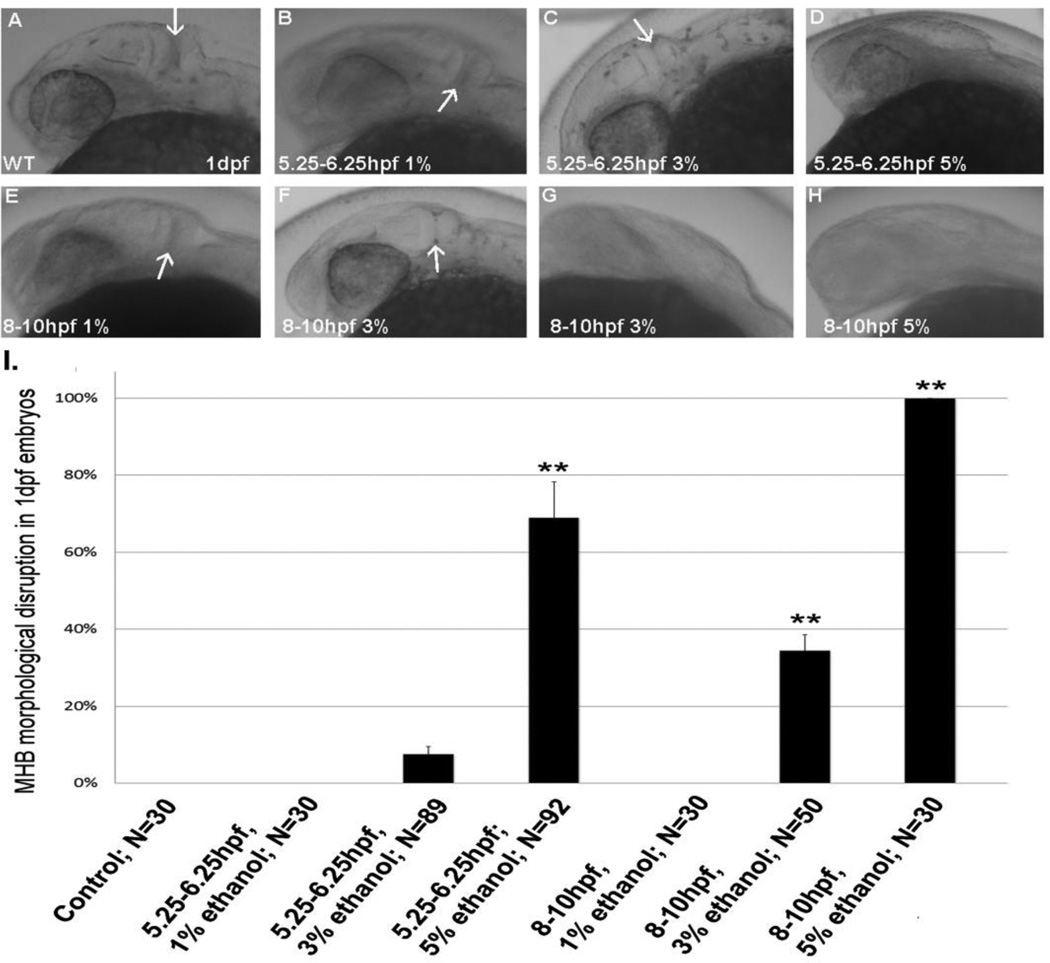
To assess effects of ethanol on CNS morphology, we first evaluated MHB formation. 0.5% (data not shown) or 1% ethanol were used as subthreshold ethanol exposures that do not produce FAS or FASD phenotypes, even with chronic exposure (Zhang et al, 2011; McCarthy et al, 2013). No alterations in MHB formation were induced by 1% ethanol (Figure 3 B,E). When embryos were exposed to 5% ethanol from 5.25–6.25 hpf, during the first hour of gastrulation, we observed perturbation of MHB formation in the majority of embryos (Figure 3 D, I). 5% ethanol exposure from the transition of gastrulation to early neurulation (8–10 hpf) showed a similar perturbation of MHB formation in all embryos (Figure 3 H, I).
Figure 3.
MHB formation in embryos exposed to acute ethanol. A, untreated 24 hpf control embryo; B–D, embryos exposed to ethanol, from 5.25–6.25 hpf. E–H, embryos exposed to ethanol from 8–10 hpf. Panel F shows a 3% ethanol exposed embryo with normal MHB, and Panel G shows a 3% ethanol embryo with a malformed MHB. I, quantitation of MHB disruption 1 dpf embryos. Data shown as Mean ± SD for the percentage of embryos displaying MHB disruption. The sample size represents the total number of embryos analyzed across all experiments, with at least 3 independent experiments with at least 10 embryos per experimental group. **, significantly different from control P< 0.0001.
Due to transient 5% alcohol exposure during embryogenesis resulting in clear physical abnormalities in adult fish, we therefore reduced the transient alcohol exposure to 3% ethanol. When analyzed for MHB formation, we observed that exposure from 5.25–6.25 hpf during early gastrulation only disrupts MHB formation in 7/89 of embryos, but exposure from 8–10 hpf during the gastrulation to neurulation transition disrupted MHB formation in 17/50 embryos (Figure 3 C, G, I).
3.2.2 Effect of ethanol on eye development
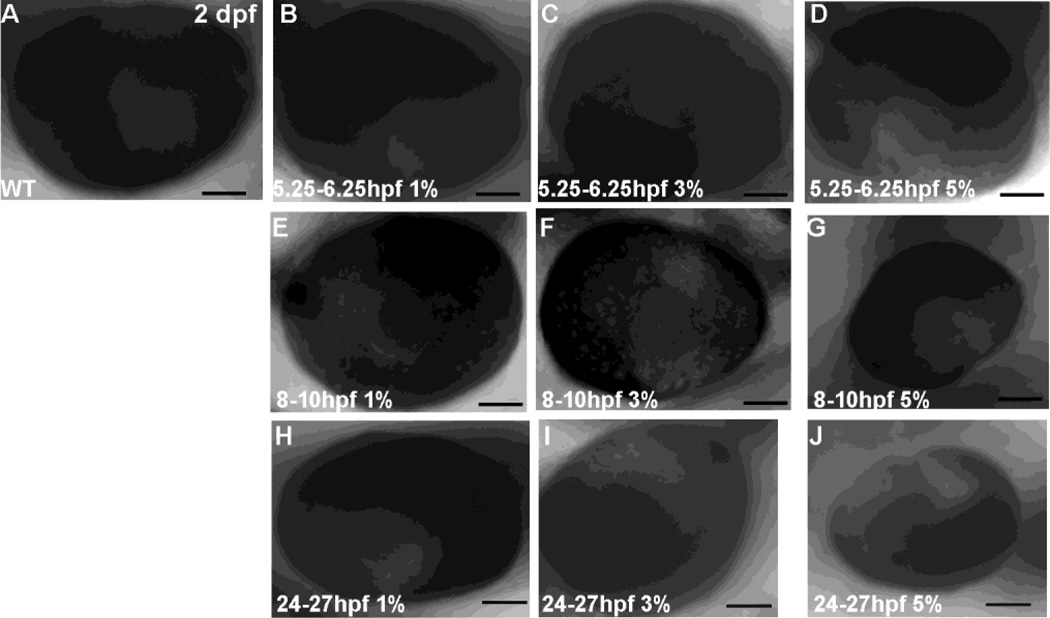
We also observed the characteristic FAS morphological phenotype of microphthalmia in embryos exposed to 5% ethanol from 5.25–6.25 hpf (in 9/38 of embryos; Figure 4 D), 8–10 hpf (24/27 embryos; Figure 4G), and 24–27 hpf (28/29 of embryos; Figure 4J). Quantitation of eye size confirmed these effects for 8–10 and 24–27 hpf treatments, with Control eye size of 258.13 ± 10.5 µm (n=29), 8–10 hpf eye size decreased by ethanol exposure (216.09 ± 26.0 µm, P<0.001, n=27), and 24–27 hpf eye size decreased by ethanol exposure (220.97 ± 12.6 µm, P<0.001, n=29).
Figure 4.
Ocular development in embryos exposed to acute ethanol. A, 2 dpf control embryo not exposed to ethanol; B–D, ethanol exposure from 5.25–6.25 hpf; E–G, ethanol exposure from 8–10 hpf; H–J, ethanol exposure from 24–27 hpf. The calibration bar is 50 µm.
When ocular development was assessed following exposure to 3% ethanol, we again noted that 3% ethanol exposure from 5.25–6.25 hpf only produced modest effects on eye size, with only 2/41 of embryos displaying decreased eye size (Figure 4C). With 3% ethanol exposure from 8–10 hpf, microphthalmia was observed in 15/59 of embryos (Figure 4F), and with 3% ethanol exposure from 24–27 hpf microphthalmia was observed in 33/69 of embryos (Figure 4I).
3.3 Effect of binge ethanol exposure on gene expression during CNS development
Our previous studies have utilized Pax6a gene expression in retina and GAD1 gene expression in forebrain and hindbrain GABAergic neurons as markers of ethanol-mediated disruption of Shh function, with rescue of expression of GAD1 by Fgf8, Fgf19 or Shh overexpression (Zhang et al., 2011; 2013). We have therefore used these two genes as markers of whether transient binge-like ethanol exposure in zebrafish disrupts Shh-dependent pathways.
3.3.1 Pax6a expression in retina
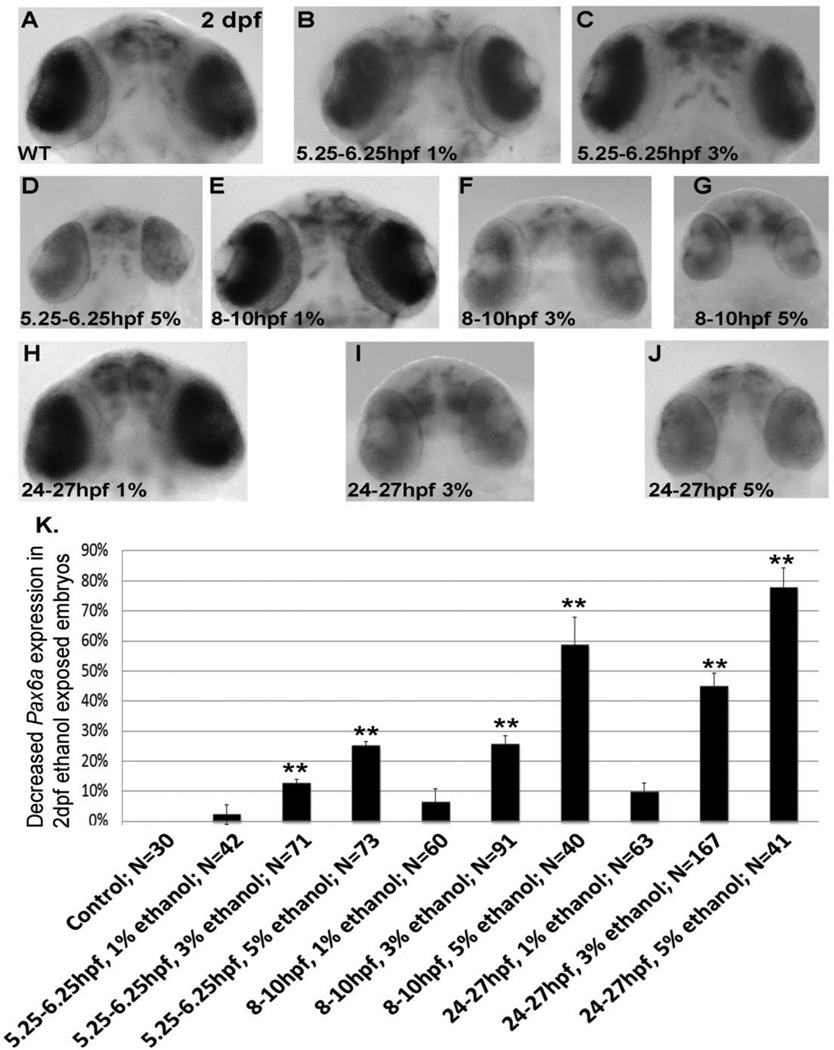
To confirm that a binge-like ethanol exposure would recapitulate chronic ethanol treatment in terms of expression of Shh-dependent genes in zebrafish, we first analyzed Pax6a gene expression in 2 dpf eyes after 5% ethanol-exposure, with a marked decrease in retinal Pax6a expression observed (Figure 5 D,G,J). The number of embryos affected by 5% ethanol exposure with a resulting decrease in Pax6a gene expression is quantified in Figure 5 K.
Figure 5.
Pax6a mRNA expression in 2 dpf retina following transient binge-like ethanol exposure. A, untreated; B–D, ethanol exposure from 5.25–6.25 hpf; E–G, ethanol exposure from 8–10 hpf; H–J, ethanol exposure from 24–27 hpf.1% ethanol. K, quantitation of decreased Pax6a expression in 2dpf ethanol embryos. Data are shown as Mean ± SD for at least 3 independent experiments, with total number of embryos analyzed shown. **, significantly different from control Pax6a expression, P< 0.0001.
Similar to our observations with morphological phenotypes, 3% ethanol exposure produced more modest effects on Pax6a gene expression when compared to 5% ethanol (Figure 5K). Only 9/71 of embryos exposed to 3% ethanol from 5.25–6.25 hpf displayed diminished Pax6a expression in 2 dpf retina (Figure 5C), while a significantly higher percentage of embryos exposed to 3% ethanol from 8–10 hpf, and 24–27 hpf, displayed reduced Pax6a gene expression (Figure 5 F,I,K).
3.3.2 GAD1 expression in forebrain and hindbrain
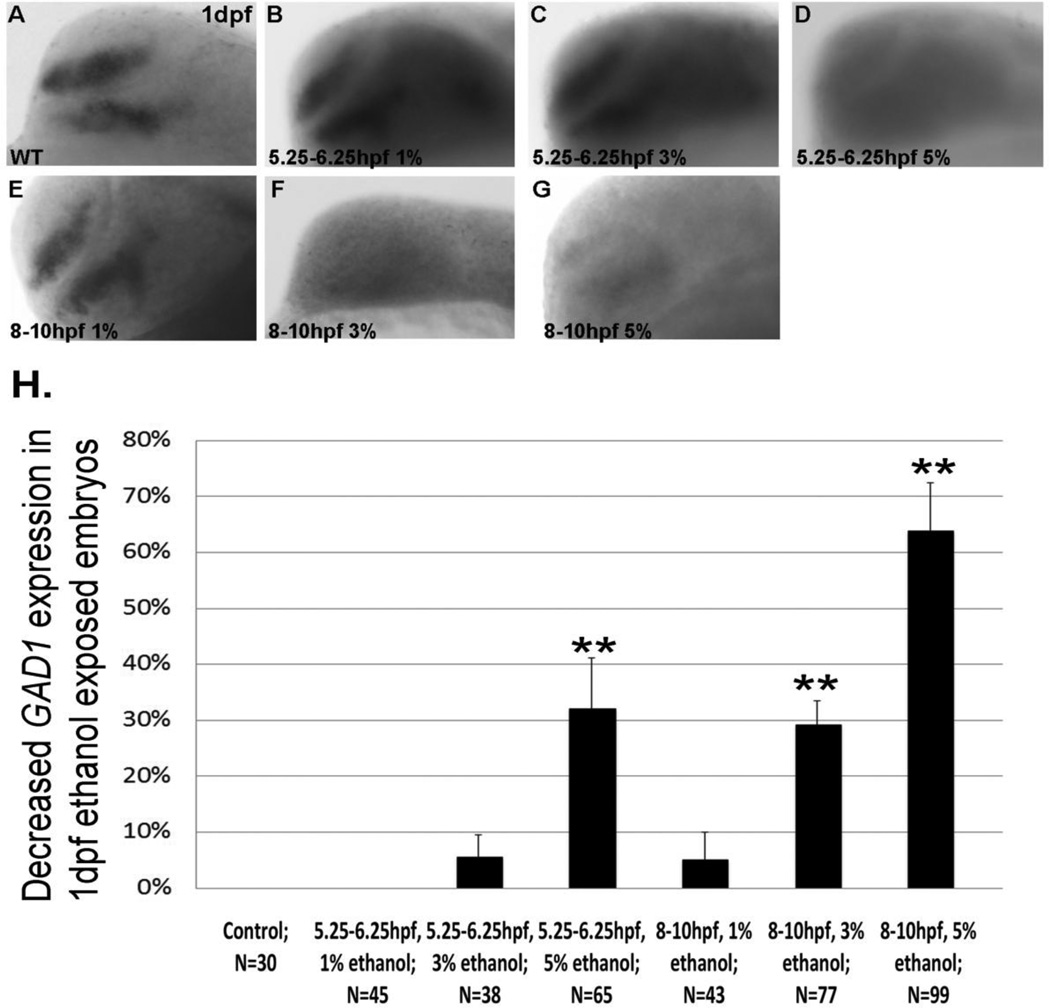
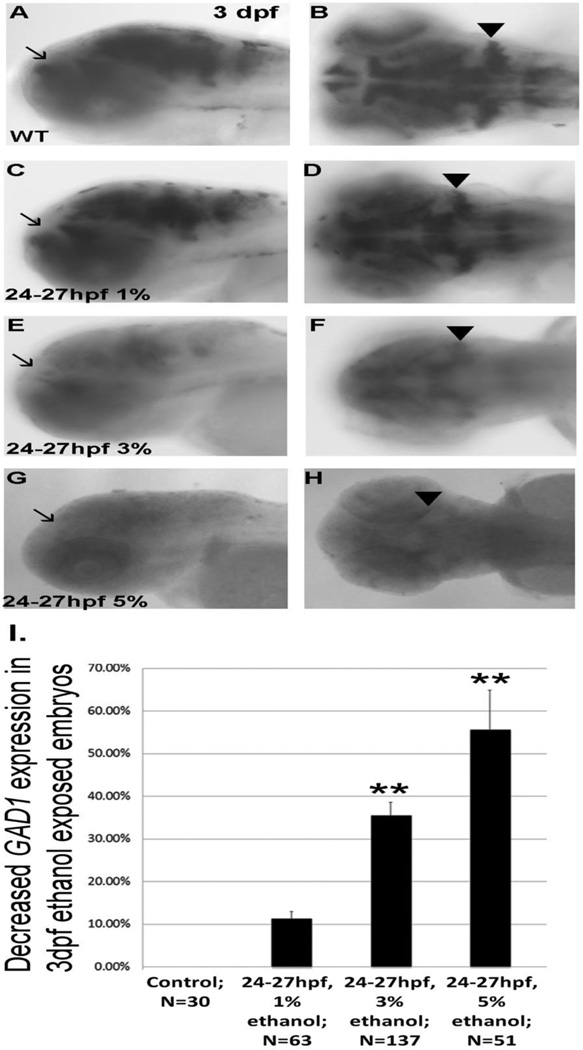
Analysis of GAD1 mRNA expression in 1 dpf forebrain, to assess development of Shh-dependent GABAergic neurons, showed marked diminution in GAD1 mRNA expression following 5% ethanol exposure at 5.25–6.25 hpf or 8–10 hpf (Figure 6 D, G, H). 5% ethanol exposure from 24–27 hpf also reduced GAD1 expression in 3 dpf forebrain and cerebellum (Figure 7 G, H, I).
Figure 6.
GAD1 gene expression in 1 dpf forebrain following transient ethanol exposure. A, control untreated embryo; B–D, embryos exposed to ethanol from 5.25–6.25 hpf; E–G, embryos exposed to 3% or 5% ethanol from 8–10 hpf. H, quantitation of decreased GAD1 expression in ethanol exposed embryos. Data are shown as Mean ± SD for at least 3 independent experiments, with total number of embryos analyzed shown. **, significantly different from control GAD1 expression, P< 0.0001.
Figure 7.
GAD1 expression in 3 dpf forebrain and hindbrain following transient binge-like ethanol exposure. A, B, lateral and dorsal views of embryos not exposed to ethanol; C, D, lateral and dorsal view of embryos exposed to 1% ethanol from 24–27 hpf; E, F, lateral and dorsal view of embryos after 3% ethanol; G,H, lateral and dorsal view of embryos following 5% ethanol. Arrows denote forebrain expression of GAD1, and arrowheads indicate expression of GAD1 in cerebellum. I, quantitation of decreased GAD1 expression in ethanol exposed embryos. Data are shown as Mean ± SD for at least 3 independent experiments, with total number of embryos analyzed shown. **, significantly different from control GAD1 expression, P< 0.0001.
Following exposure to 3% ethanol, GAD1 gene expression in 1 dpf forebrain or 3 dpf forebrain and hindbrain showed a similar phenomenon as observed with Pax6a expression, with a higher percentage of embryos exhibiting reduced GAD1 expression when exposed to 3% ethanol from 8–10 hpf or 24–27 hpf, when compared to 5.25–6.25 hpf (Figures 6 C, F, H; 7 E, F, I).
3.3.3 Correlation of gene expression changes to morphological phenotypes of FAS
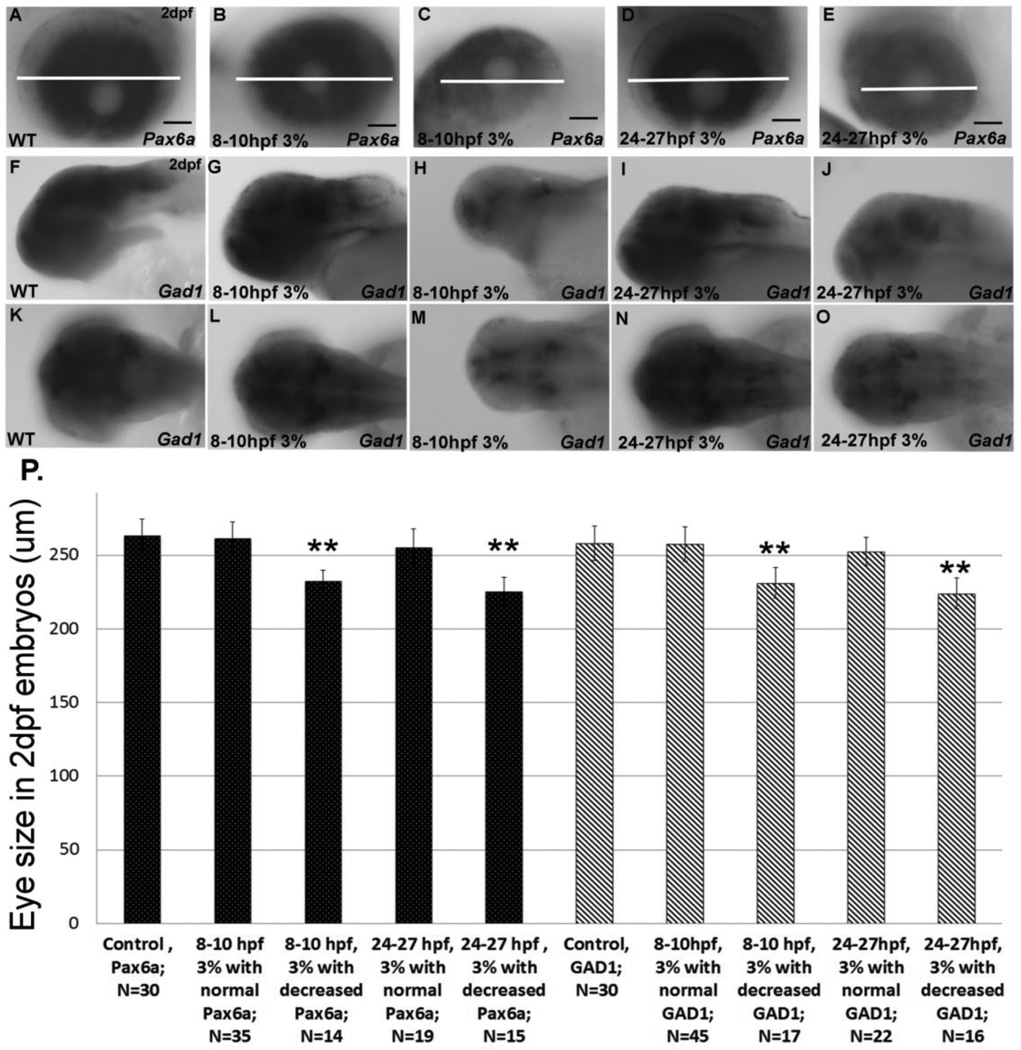
Since only a subfraction of embryos exhibited morphological hallmarks of FAS or gene expression changes, we determined if changes in gene expression were associated with morphological changes by sorting embryos after in situ hybridization and then quantifying eye diameter. Embryos exposed to 3% ethanol from 8–10 hpf or 24–27 hpf, that did not display apparent decreases in Pax6a gene expression, exhibited normal eye size (Figure 8 A,B,D,P). In contrast, embryos that displayed microphthalmia as a consequence of 3% ethanol exposure also exhibited markedly reduced Pax6a gene expression (Figure 8 A,C,E,P). A similar pattern was observed when GAD1 expression was assessed in 2 dpf embryos, as only embryos with decreased GAD1 gene expression displayed microphthalmia (Figure 8 H, J, M, O, P). From these data, it can be seen that only embryos with reduced Pax6a or GAD1 gene expression exhibited decreased eye diameter.
Figure 8.
Correlation between ethanol-induced morphological changes and reduced neuronal marker gene expression. A–E, Pax6a gene expression in 2 dpf eye, showing wild-type gene expression (A), embryos exposed to ethanol with normal Pax6a expression (B,D) and embryos displaying decreased Pax6a expression after ethanol exposure (C,E). The white bars indicate the diameter of the eye and allow comparison between decreased eye diameter (C,E) and unchanged eye diameter (B,D) when compared to control (A). F–O, GAD1 gene expression in sorted 2 dpf embryos, showing normal expression in control (F,K), and 3% ethanol exposed (G,I,L,N). P, correlation of eye diameter to gene expression in 2 dpf embryos. Data are shown as Mean ± SD for at least 3 independent experiments, with total number of embryos analyzed shown. **, significantly different from control eye size, P< 0.0001.
3.3.4 Quantitative analysis of GAD1 gene expression following ethanol exposure
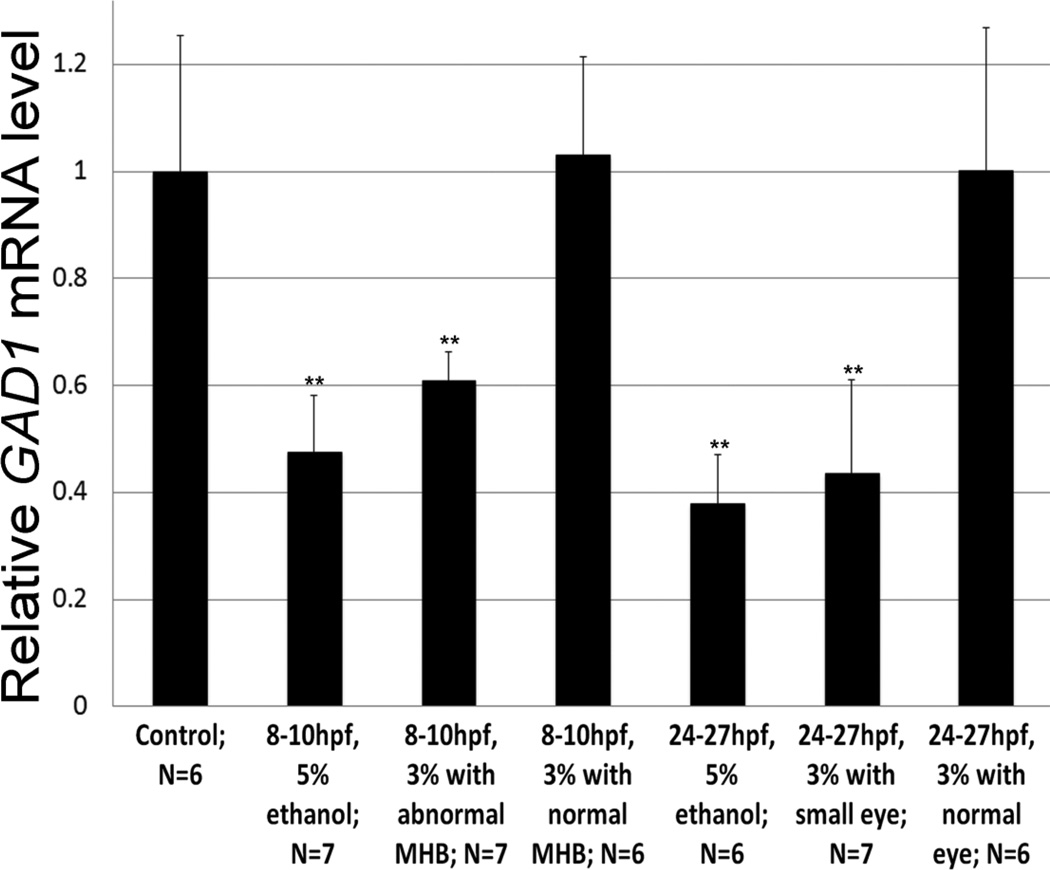
Since the in situ hybridization analyses were qualitative in nature, experiments were initiated to analyze GAD1 gene expression by quantitative real-time PCR. In these experiments embryos were either exposed to 5% ethanol from 8–10 or 24–27 hpf, which resulted in almost 100% of embryos exhibiting morphological or gene expression changes (Figures 3, 4, 5, and 6), or 3% ethanol and then sorted based on MHB morphology or eye size into FAS/FASD phenotype groups. GAD1 mRNA levels were then determined by qPCR, standardizing GAD1 mRNA levels to β-actin mRNA levels (Figure 9). These data show that 5% ethanol exposure decreased GAD1 mRNA expression by approximately 60% (Figure 9). Importantly, embryos exposed to 3% ethanol that displayed FAS/FASD morphological phenotypes exhibited significant decreases in GAD1 mRNA expression, while 3% ethanol-exposed embryos not displaying morphological phenotypes did not exhibit reduced GAD1 mRNA expression (Figure 9).
Figure 9.
GAD1 mRNA expression levels in response to ethanol exposure. GAD1 mRNA levels were quantified by real-time PCR and normalized to an internal ß-actin mRNA control, in embryos exposed to 5% ethanol or 3% ethanol followed by sorting based on absence or presence of the MHB or decreased eye size. The number of experiments, each using 10-pooled embryos per treatment, is shown. **, significantly different from control expression, P< 0.01.
3.4 Combined ethanol and morpholino effects on morphology and gene expression
3.4.1 Morphological changes induced by ethanol and MO treatment
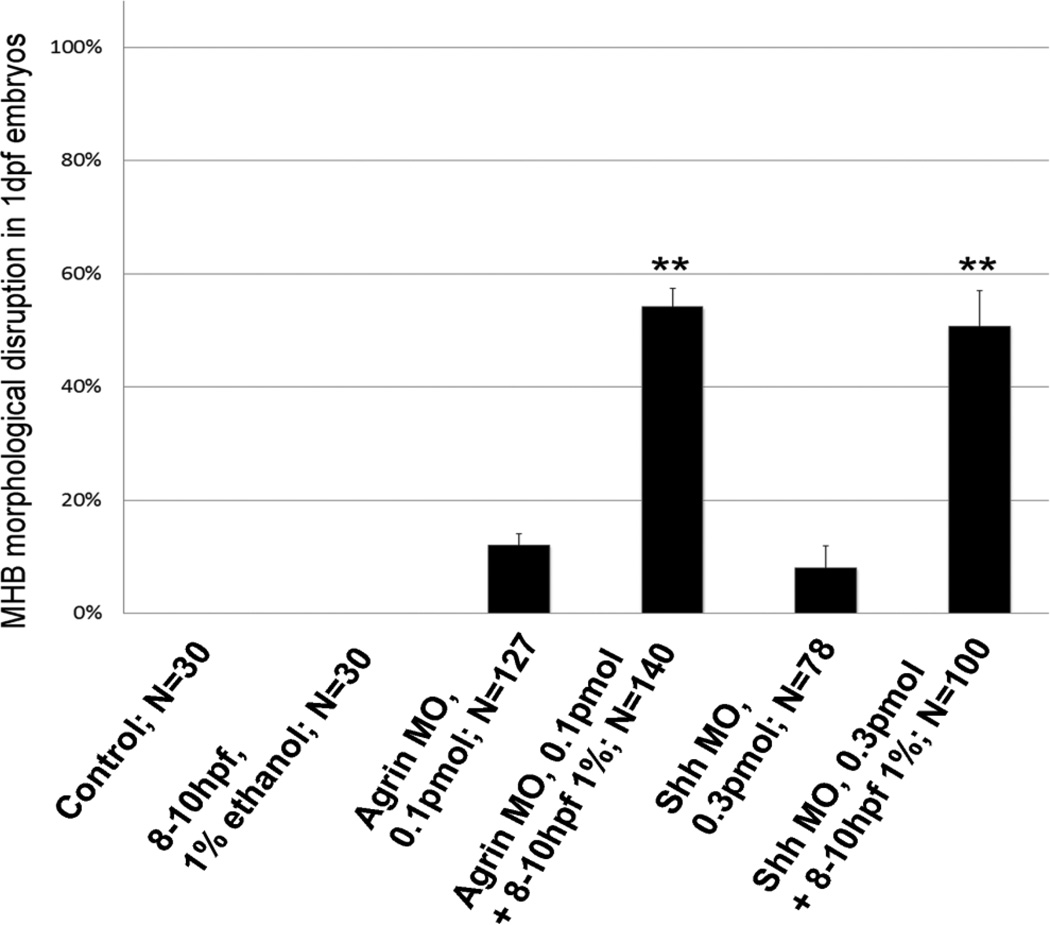
Our previous studies have used low dose ethanol exposures that do not produce morphological phenotypes, combined with morpholino (MO) treatment that also does not produce phenotypes, to induce FAS phenotypes and identify ethanol sensitive molecular pathways (Zhang et al., 2011; 2013). When low dose agrin or Shh MO injection was combined with 1% ethanol exposure from 8–10 hpf or 24–27 hpf, MHB formation was perturbed in 76/140 of embryos exposed to 1% ethanol and agrin MO from 8–10 hpf, with 51/100 of embryos displaying perturbed MHB formation with 8–10 hpf ethanol and 0.3 pmol Shh MO (Figure S1 A – F and Figure 10). A lower dose of Shh MO (0.15 pmol) combined with 1% ethanol did not markedly affect MHB formation (6/53 embryos; data not shown). We observed microphthalmia in 21/51 of embryos exposed to ethanol and agrin MO from 8–10 hpf, and 11/33 of embryos exposed to ethanol and Shh MO from 8–10 hpf (Figure S1 G,H,J,K). For combined MO and 24–27 hpf ethanol exposure, we observed microphthalmia in 33/65 of embryos treated with agrin MO, and 9/29 of embryos treated with Shh MO (Figure S1 G,I,J,L,M,O).
Figure 10.
Combined ethanol and MO treatment disrupts MHB formation. The percentage of embryos displaying absence of a defined MHB is shown for ethanol or MO alone, or combined ethanol and MO. Data are shown as Mean ± SD for at least 3 independent experiments, with total number of embryos analyzed shown. **, significantly different from control eye size, P< 0.0001.
3.4.2 Combined ethanol and MO treatment induces gene expression changes
Following combined ethanol and MO treatment, Pax6a expression was diminished in approximately 45% of embryos treated with agrin MO and then exposed to ethanol at 8–10 hpf or 24–27 hpf (Figures 11A and S2 A – F). When embryos were exposed to ethanol and Shh MO, Pax6a gene expression was likewise significantly reduced in a subfraction of embryos (Figures 11A and S2 A–C, G–I). A similar effect of combined ethanol and MO treatment was observed for GAD1 gene expression, with 30/84 of embryos exhibiting decreased GAD1 in 1 dpf forebrain after 8–10 hpf exposure to ethanol and agrin MO, and 20/52 of embryos having decreased GAD1 after 8–10 hpf exposure to ethanol and Shh MO (Figures 11B and S2 J – O). In 3 dpf forebrain and cerebellum, a similar percentage of embryos exposed to both MOs and ethanol exhibited diminished GAD1 gene expression (Figures 11C and S2 P – Z).
Figure 11.
Combined ethanol and MO treatment perturbs CNS gene expression. A, Pax6a gene expression following ethanol, MO or ethanol plus MO treatment. B, C, GAD1 gene expression in 1 dpf or 3 dpf embryos following ethanol, MO or ethanol plus MO treatment. Data are shown as Mean ± SD for at least 3 independent experiments, with total number of embryos analyzed shown. **, significantly different from control eye size, P< 0.0001.
4. DISCUSSION
While the zebrafish has been gaining traction as an animal model for FAS and FASD, most developmental zebrafish studies have used chronic ethanol exposure times (Bilotta et al., 2004; Arenzana et al., 2006; Dlugos and Rabin, 2007; Kashyap et al., 2007; Loucks et al., 2007; Loucks and Ahlgren, 2009; Kashyap et al., 2011; McCarthy et al., 2013) that likely suffer from not truly representing the behavior of a pregnant woman drinking alcohol during pregnancy. Importantly, the majority of zebrafish embryos exposed to ethanol for these chronic exposures do not survive past the larval stage, suggesting that these chronic exposure models are not representative of human FASD. The present study was therefore undertaken to address whether transient binge-like ethanol exposures in zebrafish would produce the stereotypical morphological defects found in FAS or FASD, and molecular changes that have been associated with alcohol exposure in rodent and zebrafish. A suggested disadvantage of zebrafish as an FASD model is that ethanol levels in zebrafish greatly exceed mammalian exposure levels in order to elicit the FAS phenotypes, which was also observed with even our binge-like ethanol exposures. Importantly, in terms of tissue ethanol levels we show that the binge-like exposed embryos, after 3% ethanol, are similar to chronic 2% ethanol exposure (Zhang et al., 2013), but without the high embryonic lethality. In addition, with these brief exposures to high concentrations of ethanol we observed tissue levels that were approximately 30–35% of the ethanol concentration in the bathing fish water, similar to previous chronic exposures (Reimers et al, 2004; McCarthy et al, 2013; Zhang et al, 2013) and a recent study using a similar binge exposure model (Flentke et al, 2014). Thus, the binge-like 3% ethanol exposure appears to be a more appropriate experimental paradigm to allow zebrafish ethanol exposure to mimic mammalian FAS or FASD.
The present study initiated proof of concept studies to mimic binge-like ethanol exposures for zebrafish embryos, assessing morphology (microphthalmia and MHB formation) and expression of genes dependent upon Shh signaling, since Shh function has been linked to FASD in mouse (Aoto et al., 2008; Hong and Krauss, 2012) and zebrafish (Loucks and Ahlgren, 2009; Zhang et al., 2011; 2013). We initially selected an acute 5% ethanol exposure since previous studies with 1 h exposure to 10% ethanol resulted in poor embryo survival (Ali et al, 2011). When raised to adults we observed that a significant proportion of embryos exposed to 5% ethanol exhibited body deformities, even following just a 1 h exposure to 5% ethanol from 5.25–6.25 hpf. These data suggest this acute high dose ethanol exposure may produce physical abnormalities typically not observed in human FASD and may not be clinically relevant to human FASD. Accordingly, we showed that embryos exposed to 3% ethanol at all of the developmental stages selected in our studies survive past the larval stage, with no body defects in adults and similar percentages of ethanol-exposed and control embryos surviving to adulthood. However, recent studies by Flentke et al (2014) suggested that even binge ethanol exposures >2% v/v were of limited clinical relevance, but these studies employed longer exposure times of 3 h for binge exposure. Thus, using a binge-like exposure paradigm in zebrafish it is likely that the duration and developmental timing of exposure, as well as the ethanol concentration employed, will need to be considered.
A key observation from our studies is that only a subset of embryos exposed to 3% ethanol displayed the characteristic FAS morphological phenotypes, such as microphthalmia. Interestingly, our studies demonstrated a high degree of correlation between reduction in eye size and concomitant reduction in Pax6a or GAD1 gene expression. As further evidence of this correlation, when GAD1 mRNA expression levels were quantified by qPCR it was observed that 3% ethanol exposures that perturbed MHB or eye development produced significant decreases in GAD1 mRNA expression, while embryos exposed to 3% ethanol that did not display morphological alterations also did not exhibit reduced GAD1 mRNA expression. Although Pax6a mRNA levels were not quantified in the current studies, based on in situ hybridization analyses and the GAD1 qPCR data we would predict that Pax6a mRNA levels would also exhibit similar quantitative decreases in response to ethanol exposure.
A goal of this study was to determine whether transient binge-like ethanol exposures at defined developmental stages would elicit alterations in the expression of genes related to Shh function, thus allowing correlation between ethanol exposure and Shh function at defined periods of embryogenesis. We elected to use Pax6a gene expression as a marker of Shh function during eye development, since Pax6a is critical to eye development (Glaser et al., 1992), is affected by ethanol exposure in zebrafish (Kashyap et al., 2007; Loucks et al., 2007; Zhang et al., 2011) and zebrafish eye development is dependent on Shh signaling (Vinothkumar et al., 2008). The importance of the developmental timing of transient binge-like ethanol exposure in zebrafish was illustrated with Pax6a expression, with only 5% ethanol exposure from 5.25–6.25 hpf, during the initial stage of gastrulation, being capable of disrupting Pax6a gene expression. Conversely, 3% ethanol exposure from either 8–10 hpf or 24–27 hpf was capable of disrupting Pax6a gene expression.
Forebrain GABAergic neuronal differentiation also requires Shh signaling (Yung et al., 2002; Gulasci and Lillien, 2003; Miyake et al, 2005) and our previous work has shown that ethanol exposure in zebrafish perturbs forebrain and hindbrain GABAergic neuron differentiation (Zhang et al., 2013). Like Pax6a expression, the 5.25–6.25 hpf stage was more resistant to ethanol exposure, with only 5% ethanol resulting in diminished GAD1 gene expression in forebrain. Again as observed with Pax6a, the 8–10 and 24–27 hpf stages were more sensitive to ethanol exposure, with 3% transient ethanol exposure resulting in perturbed GAD1 expression in forebrain and hindbrain GABAergic neurons. It is known that ethanol exposure during mouse gastrulation results in similar phenotypes (Sulik et al., 1981; Godin et al., 2010), and thus it will be of interest to ascertain whether the early period of mouse gastrulation is also more resistant to ethanol exposure, and if Shh function is also perturbed with ethanol exposure during these analogous stages of mouse development.
There is increasing interest in elucidating the genetic susceptibility to FASD, by identifying genes that interact with ethanol to produce the characteristic phenotypes of FAS and FASD. In mouse it has been shown that a co-receptor for Shh, Cdon, interacts with ethanol to produce holoprosencephaly (Hong and Krauss, 2012). Recent studies using zebrafish mutants suggest that pdgfra interacts with ethanol to produce craniofacial defects that are characteristic of FAS (McCarthy et al., 2013), and additional genes that are ethanol-sensitive have been identified in zebrafish using mutant screens (Swartz et al, 2013). Our laboratory has been using exposure to subthreshold levels of ethanol, combined with low dose MO injection that does not produce overt phenotypes, as a means to identify genetic susceptibilities to ethanol (Zhang et al., 2011; 2013). Using this approach we now provide evidence that binge-like ethanol exposure during defined developmental periods can lead to molecular changes associated with FAS. Our studies reported here provide support for the gastrulation/neurulation transition period (8–10 hpf), and early nervous system development (24–27 hpf), as being sensitive to low levels of transient ethanol when agrin or Shha gene expression has been partially reduced using MO treatment. Previously we have shown that overexpression of Shha or Fgf8/Fgf19 mRNA can rescue these combined alcohol/MO phenotypes, indicating that agrin and Shha signaling are sensitive to ethanol exposure (Zhang et al., 2013). While we have not analyzed Shhb (Twhh) function as being involved in ethanol-mediated affects, previous studies have shown that Shha expression is much more widespread than Twhh expression from 16.5 to 26 hpf (Schlopp et al, 2006). Thus, our studies provide support for an alternative approach to identify ethanol-sensitive genes, and demonstrate that even binge-like ethanol exposures that do not produce FAS phenotypes can lead to FAS phenotypes when ethanol exposure occurs concomitant with reduced gene expression.
In conclusion, these studies described here provide strong evidence that transient binge-like ethanol exposures in zebrafish embryos will produce the hallmark FAS morphological defects observed with mammalian fetal alcohol exposure. In addition, these studies show that alterations in expression of neuronal genes that are dependent on Shh signaling for normal expression are disrupted by binge-like ethanol exposure, as well as subthreshold binge-like ethanol exposure when exposure occurs in combination with diminished target gene expression. Collectively, these studies provide further support for the genetic tractability of the zebrafish model as a model for FAS and FASD research, particularly in defining gene-ethanol interactions.
Supplementary Material
Highlights.
Binge-like ethanol exposure of zebrafish embryos produces the characteristic phenotypes of FASD
Expression of genes regulated by Shh signaling is disrupted by binge-like ethanol exposure
Combined acute ethanol and subthreshold morpholinos produces FASD phenotypes
Acknowledgments
This work was supported by NIH grant U54 AA019765. The authors thank Ms. Shanta Mackinnon for zebrafish husbandry.
Footnotes
Publisher's Disclaimer: This is a PDF file of an unedited manuscript that has been accepted for publication. As a service to our customers we are providing this early version of the manuscript. The manuscript will undergo copyediting, typesetting, and review of the resulting proof before it is published in its final citable form. Please note that during the production process errors may be discovered which could affect the content, and all legal disclaimers that apply to the journal pertain.
REFERENCES
- Ahlgren SC, Thakur V, Bronner-Fraser M. Sonic hedgehog rescues cranial neural crest from cell death induced by ethanol exposure. Proc Natl Acad Sci USA. 2002;99:10476–10481. doi: 10.1073/pnas.162356199. [DOI] [PMC free article] [PubMed] [Google Scholar]
- Ali S, Champagne DL, Alia A, Richardson MK. Large-scale analysis of acute ethanol exposure in zebrafish development: a critical time window and resilience. PLoS One. 2011;6:e20037. doi: 10.1371/journal.pone.0020037. [DOI] [PMC free article] [PubMed] [Google Scholar]
- Aoto K, Shikata Y, Higashiyama D, Shiota K, Motoyama J. Fetal ethanol exposure activates protein kinase A and impairs Shh expression in prechordal mesendoderm cells in the pathogenesis of holoprosencephaly. Birth Defects Res (Part A) 2008;82:224–231. doi: 10.1002/bdra.20447. [DOI] [PubMed] [Google Scholar]
- Arenzana FJ, Carvan MJ, 3rd, Aijon J, Sanchez-Gonzalez R, Arevalo R, Porteros A. Teratogenic effects of ethanol exposure on zebrafish visual system development. Neurotoxicol Teratol. 2006;28:342–348. doi: 10.1016/j.ntt.2006.02.001. [DOI] [PubMed] [Google Scholar]
- Bilotta J, Barnett JA, Hancock L, Saszik S. Ethanol exposure alters zebrafish development: a novel model of fetal alcohol syndrome. Neurotoxicol Teratol. 2004;26:737–743. doi: 10.1016/j.ntt.2004.06.011. [DOI] [PubMed] [Google Scholar]
- Chan T, Bowell R, O'Keefe M, Lanigan B. Ocular manifestations in fetal alcohol syndrome. Br J Ophthalmol. 1991;75:524–526. doi: 10.1136/bjo.75.9.524. [DOI] [PMC free article] [PubMed] [Google Scholar]
- Chrisman K, Kenney R, Comin J, Thai T, Suchocki L, Yueh YG, Gardner DP. Gestational ethanol exposure disrupts the expression of FGF8 and Sonic hedgehog signaling during limb patterning. Birth Defects Res. (Part A) 2004;70:163–171. doi: 10.1002/bdra.20019. [DOI] [PubMed] [Google Scholar]
- Church MW, Kaltenbach JA. Hearing, speech, language and vestibular disorders in the fetal alcohol syndrome: a literature review. Alcohol Clin Exp Res. 1997;21:495–512. doi: 10.1111/j.1530-0277.1997.tb03796.x. [DOI] [PubMed] [Google Scholar]
- Clarren SK, Alvord EC, Jr, Sumi SM, Streissguth AP, Smith DW. Brain malformations related to prenatal exposure to ethanol. J Pediatrics. 1978;92:64–67. doi: 10.1016/s0022-3476(78)80072-9. [DOI] [PubMed] [Google Scholar]
- Dlugos CA, Rabin RA. Ocular deficits associated with alcohol exposure during zebrafish development. J. Comp. Neurol. 2007;502:497–506. doi: 10.1002/cne.21320. [DOI] [PubMed] [Google Scholar]
- Dow KE, Riopelle RJ. Specific effects of ethanol on neurite-promoting proteoglycans of neuronal origin. Brain Res. 1990;508:40–45. doi: 10.1016/0006-8993(90)91114-v. [DOI] [PubMed] [Google Scholar]
- Flentke GR, Klingler RH, Tanguay RL, Carvan MJ, 3rd, Smith SM. An evolutionarily conserved mechanism of calcium-dependent neurotoxicity in a zebrafish model of fetal alcohol spectrum disorders. Alcohol Clin Exp Res. 2014;38:1255–1265. doi: 10.1111/acer.12360. [DOI] [PMC free article] [PubMed] [Google Scholar]
- Glaser T, Walton DS, Maas RL. Genomic structure, evolutionary conservation and aniridia mutations in the human PAX6 gene. Nat Genet. 1992;2:232–239. doi: 10.1038/ng1192-232. [DOI] [PubMed] [Google Scholar]
- Godin EA, O’Leary-Moore SK, Khan AA, Parnell SE, Ament JJ, Dehart DB, et al. Magnetic resonance microscopy defines ethanol-induced brain abnormalities in prenatal mice: effects of acute ethanol on gestational day 7. Alcohol Clin Exp Res. 2010;34:98–111. doi: 10.1111/j.1530-0277.2009.01071.x. [DOI] [PMC free article] [PubMed] [Google Scholar]
- Gulasci A, Lillien L. Sonic hedgehog and bone morphogenetic protein regulate interneuron development from dorsal telencephalic progenitors in vitro. J Neurosci. 2003;23:9862–9872. doi: 10.1523/JNEUROSCI.23-30-09862.2003. [DOI] [PMC free article] [PubMed] [Google Scholar]
- Hard ML, Abdolell M, Robinson BH, Koren G. Gene-expression analysis after alcohol exposure in the developing mouse. J Lab Clin Med. 2005;145:47–54. doi: 10.1016/j.lab.2004.11.011. [DOI] [PubMed] [Google Scholar]
- Hong M, Krauss RS. Cdon mutation and fetal ethanol exposure synergize to produce midline signaling defects and holoprosencephaly spectrum disorders in mice. PLOS Genetics. 2012;8:e1002999. doi: 10.1371/journal.pgen.1002999. [DOI] [PMC free article] [PubMed] [Google Scholar]
- Jones KL, Smith DW. Recognition of the fetal alcohol syndrome in early infancy. Lancet. 2003;2:999–1001. doi: 10.1016/s0140-6736(73)91092-1. [DOI] [PubMed] [Google Scholar]
- Kashyap B, Frederickson LC, Stenkamp DL. Mechanisms for persistent microphthalmia following ethanol exposure during retinal neurogenesis in zebrafish embryos. Vis. Neurosci. 2007;24:409–421. doi: 10.1017/S0952523807070423. [DOI] [PMC free article] [PubMed] [Google Scholar]
- Kashyap B, Frey RA, Stenkamp DL. Ethanol-induced microphthalmia is not mediated by change sin retinoic acid or sonic hedgehog signaling during retinal neurogenesis. Alcohol Clin Exp Res. 2011;35:1644–1661. doi: 10.1111/j.1530-0277.2011.01511.x. [DOI] [PMC free article] [PubMed] [Google Scholar]
- Kim MJ, Liu IH, Song Y, Lee JA, Halfter W, Balice-Gordon RJ, Linney E, Cole GJ. Agrin is required for posterior development and axon pathway formation in embryonic zebrafish. Glycobiology. 2007;17:231–247. doi: 10.1093/glycob/cwl069. [DOI] [PubMed] [Google Scholar]
- Kimmel CB, Ballard WW, Kimmel SR, Ullmann B, Schilling TF. Stages of embryonic development of the zebrafish. Dev Dyn. 1995;203:253–310. doi: 10.1002/aja.1002030302. [DOI] [PubMed] [Google Scholar]
- Li YX, Yang HT, Zdanowicz M, Sicklick JK, Qi Y, Camp TJ, Diehl AM. Fetal alcohol exposure impairs Hedgehog cholesterol modification and signaling. Lab Invest. 2007;87:231–240. doi: 10.1038/labinvest.3700516. [DOI] [PubMed] [Google Scholar]
- Liesi P. Ethanol-exposed central neurons fail to migrate and undergo apoptosis . J. Neurosci Res. 1997;48:439–448. doi: 10.1002/(sici)1097-4547(19970601)48:5<439::aid-jnr5>3.0.co;2-f. [DOI] [PubMed] [Google Scholar]
- Liu IH, Zhang C, Kim MJ, Cole GJ. Retina development in zebrafish requires the heparan sulfate proteoglycan agrin. Dev Neurobiol. 2008;68:877–898. doi: 10.1002/dneu.20625. [DOI] [PubMed] [Google Scholar]
- Loucks EJ, Schwend T, Ahlgren SC. Molecular changes associated with teratogen-induced cyclopia. Birth Defects Res. (Part A) 2007;79:642–651. doi: 10.1002/bdra.20387. [DOI] [PubMed] [Google Scholar]
- Loucks EJ, Ahlgren SC. Deciphering the role of Shh signaling in axial defects produced by ethanol exposure. Birth Defects Res (Part A) 2009;85:556–567. doi: 10.1002/bdra.20564. [DOI] [PubMed] [Google Scholar]
- Mattson SN, Riley EP. Fetal Alcohol Syndrome: From Mechanism to Prevention. In: Abel EL, editor. Brain anomalies in fetal alcohol syndrome. Boca Raton: CRC Press; 1996. pp. 50–68. [Google Scholar]
- McCarthy N, Wetherill L, Lovely CB, Swartz ME, Foroud TM, Eberhart JK. Pdgfra protects against ethanol-induced craniofacial defects in a zebrafish model of FASD. Development. 2013;140:3254–3265. doi: 10.1242/dev.094938. [DOI] [PMC free article] [PubMed] [Google Scholar]
- Miyake A, Nakayama Y, Konishi M, Itoh N. Fgf19 regulated by Hh signaling is required for zebrafish forebrain development. Dev Biol. 2005;288:259–275. doi: 10.1016/j.ydbio.2005.09.042. [DOI] [PubMed] [Google Scholar]
- Reimers MJ, Flockton AR, Tanguay RL. Ethanol- and acetaldehyde-mediated developmental toxicity in zebrafish. Neurotoxicol Teratol. 2004;26:769–781. doi: 10.1016/j.ntt.2004.06.012. [DOI] [PubMed] [Google Scholar]
- Rubert G, Minana R, Pascual M, Guerri C. Ethanol exposure during embryogenesis decreases the radial glial progenitor pool and affects the generation of neurons and astrocytes. J Neurosci Res. 2006;84:483–496. doi: 10.1002/jnr.20963. [DOI] [PubMed] [Google Scholar]
- Schlopp S, Wolf O, Brand M, Lumsden A. Hedgehog signalling from the zona limitans intrathalamica orchestrates patterning of the zebrafish diencephalon. Development. 2006;133:855–864. doi: 10.1242/dev.02248. [DOI] [PubMed] [Google Scholar]
- Stromland K. Ocular abnormalities in the fetal alcohol syndrome. Acta Ophthamol Suppl. 1985;171:1–50. [PubMed] [Google Scholar]
- Stromland K, Pinazo-Duran MD. Optic nerve hypoplasia: comparative effects in children and rats exposed to alcohol during pregnancy. Teratology. 1994;50:100–111. doi: 10.1002/tera.1420500204. [DOI] [PubMed] [Google Scholar]
- Sulik KK, Johnston MC, Webb MA. Fetal alcohol syndrome: embryogenesis in a mouse model. Science. 1981;214:936–938. doi: 10.1126/science.6795717. [DOI] [PubMed] [Google Scholar]
- Sulik KK, Johnston MC, Daft PA, Russell WE, Dehart DB. Fetal alcohol syndrome and DiGeorge anomaly: critical ethanol exposure periods for craniofacial malformations as illustrated in an animal model. Am J Med Genet Suppl. 1986;2:97–112. doi: 10.1002/ajmg.1320250614. [DOI] [PubMed] [Google Scholar]
- Swartz ME, Wells MB, Griffin M, McCarthy N, Lovely CB, McGurk P, Rozacky J, Eberhart JK. A screen of zebrafish mutants identifies ethanol-sensitive genetic loci. Alcohol Clin Exp Res. 2013 doi: 10.1111/acer.12286. Epub ahead of print] [DOI] [PMC free article] [PubMed] [Google Scholar]
- Vinothkumar S, Rastegar S, Takamiya M, Ertzer R, Strahle U. Sequential and cooperative action of Fgfs and Shh in the zebrafish retina. Dev Biol. 2008;314:200–214. doi: 10.1016/j.ydbio.2007.11.034. [DOI] [PubMed] [Google Scholar]
- Yung SY, Gokhan S, Jurcsak J, Molero AE, Abrajano JJ, Mehler MF. Differential modulation of BMP signaling promotes the elaboration of cerebral cortical GABAergic neurons or oligodendrocytes from a common sonic hedgehog-responsive ventral forebrain progenitor species. Proc Natl Acad Sci U S A. 2002;99:16273–16278. doi: 10.1073/pnas.232586699. [DOI] [PMC free article] [PubMed] [Google Scholar]
- Zhang C, Turton QM, MacKinnon S, Sulik KK, Cole GJ. Agrin function associated with ocular development is a target of ethanol exposure in embryonic zebrafish. Birth Defects Res (Part A) 2011;91:129–141. doi: 10.1002/bdra.20766. [DOI] [PMC free article] [PubMed] [Google Scholar]
- Zhang C, Ojiaku P, Cole GJ. Forebrain and hindbrain development in zebrafish is sensitive to ethanol exposure involving agrin, Fgf and Sonic hedgehog function. Birth Defects Res. (Part A) 2013;97:8–27. doi: 10.1002/bdra.23099. [DOI] [PMC free article] [PubMed] [Google Scholar]
Associated Data
This section collects any data citations, data availability statements, or supplementary materials included in this article.


