

Abstract
The hypoxic environment imposes severe selective pressure on species living at high altitude. To understand the genetic bases of adaptation to high altitude in dogs, we performed whole-genome sequencing of 60 dogs including five breeds living at continuous altitudes along the Tibetan Plateau from 800 to 5100 m as well as one European breed. More than 150× sequencing coverage for each breed provides us with a comprehensive assessment of the genetic polymorphisms of the dogs, including Tibetan Mastiffs. Comparison of the breeds from different altitudes reveals strong signals of population differentiation at the locus of hypoxia-related genes including endothelial Per-Arnt-Sim (PAS) domain protein 1 (EPAS1) and beta hemoglobin cluster. Notably, four novel nonsynonymous mutations specific to high-altitude dogs are identified at EPAS1, one of which occurred at a quite conserved site in the PAS domain. The association testing between EPAS1 genotypes and blood-related phenotypes on additional high-altitude dogs reveals that the homozygous mutation is associated with decreased blood flow resistance, which may help to improve hemorheologic fitness. Interestingly, EPAS1 was also identified as a selective target in Tibetan highlanders, though no amino acid changes were found. Thus, our results not only indicate parallel evolution of humans and dogs in adaptation to high-altitude hypoxia, but also provide a new opportunity to study the role of EPAS1 in the adaptive processes.
The mechanisms of organismal adaptation to high-altitude hypoxia are of great interest during recent years. Highland wild animals have a long life history at high altitude, and the whole genomes of yak (descendants of wild yak) (Qiu et al. 2012), Tibetan antelope (Ge et al. 2013), snow leopard (Cho et al. 2013), and wild boar (Li et al. 2013) have been sequenced. In contrast, the human settlement history on highland is rather short, which dates from ∼25,000 yr ago (Zhao et al. 2009). Whole-genome genotyping and re-sequencing have been performed for three typical highland populations including Tibetans (Beall et al. 2010; Bigham et al. 2010; Simonson et al. 2010; Yi et al. 2010; Peng et al. 2011; Xu et al. 2011), Andeans (Bigham et al. 2009, 2010), and Ethiopians (Alkorta-Aranburu et al. 2012; Scheinfeldt et al. 2012).
The increased oxygen uptake and delivery are physiological hallmarks of high-altitude adaptation. On one hand, the capacity of oxygen uptake is determined by hemoglobin concentration and oxygen affinity. For example, the Andean highlanders display a high level of hemoglobin concentration (Beall et al. 2002; Beall 2007). The high oxygen affinity of hemoglobin is found in many highland animals such as yak (Weber et al. 1988), alpaca (Piccinini et al. 1990), deer mice (Storz et al. 2007; Storz et al. 2009), bar-headed goose (Zhang et al. 1996; Liang et al. 2001), and Andean goose (Jessen et al. 1991). On the other hand, the rate of oxygen delivery is determined by blood flow. For example, although Tibetans maintain a nearly normal level of hemoglobin concentration and a low level of oxygen saturation, they display a high level of blood flow, resulting in the increase of oxygen delivery (Beall et al. 2001; Erzurum et al. 2007).
Whole-genome scans revealed that positive selection for human high-altitude adaptation occurred in the hypoxia-inducible factor (HIF) pathway (Bigham et al. 2009; Beall et al. 2010; Bigham et al. 2010; Simonson et al. 2010; Yi et al. 2010; Peng et al. 2011; Xu et al. 2011; Alkorta-Aranburu et al. 2012; Scheinfeldt et al. 2012), which regulates genes associated with blood physiology. In addition, metabolic pathways may also be involved in the adaptive process of yak (Qiu et al. 2012) and Tibetan antelope (Ge et al. 2013).
Although a lot of studies focused on wildlife and human highlanders, no research was performed on domesticated animals that migrated to the plateau with humans, which represent an adaptation pattern on a short evolutionary time scale of thousands of years. For example, the Tibetan Mastiff is a native dog living in the Tibetan Plateau with an altitude of 3000–6000 m. It is also an ancient dog in the world (Li and Zhang 2012). However, the genetic and physiological mechanisms of its adaptation to high-altitude environments remain elusive.
In this study, we sampled five dog breeds including the Tibetan Mastiff from continuous altitudes along the Ancient Tea Horse Road in southwestern China as well as one European breed. We performed whole-genome sequencing for the dogs and identified candidate genes for high-altitude adaptation using selective sweep mapping. We also measured the hematologic and hemorheologic parameters of the dogs and tested the association between the candidate alleles and blood physiology.
Results
Genetic diversity and population structure
We sampled 60 dogs belonging to six breeds living at continuous altitudes (Table 1). To avoid potential kinships, each dog was sampled from one individual village, which is dispersed along the Ancient Tea Horse Road and far away from each other. The sex ratio was kept as 1:1 for each breed. We classified the breeds into three altitude levels, i.e., high (>3000 m), middle (2000–3000 m), and low (<2000 m). The high-altitude breeds include Tibetan Mastiffs (TM) and Diqing indigenous dogs (DQ). The middle-altitude breed was chosen as Lijiang indigenous dogs (LJ). The low-altitude breeds contain Yingjiang indigenous dogs (YJ), Kunming dogs (KM), and German Shepherds (GS). Grouping multiple breeds living at similar altitudes could contribute to reducing the influence of breed-specific genetic background.
Table 1.
Sample, sequencing, and polymorphism information for the six dog breeds
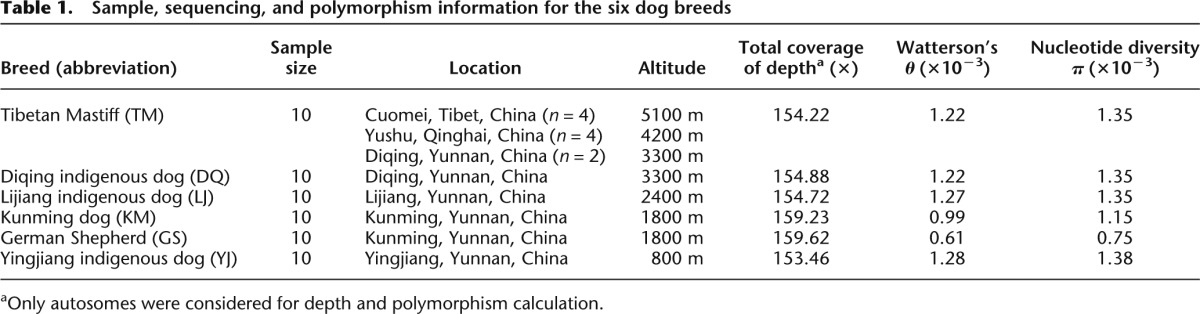
We performed whole-genome sequencing for each individual dog. The coverage depth after genome alignment is ∼15× for each dog (Supplemental Fig. 1; Supplemental Tables 1, 2), resulting in >150× for each breed for variant calling (Supplemental Tables 3–5). The levels of genome-wide genetic diversity, as measured by Watterson’s θ and pairwise nucleotide diversity π, are relatively higher in the TM and indigenous breeds (DQ, LJ, and YJ) than those in KM and GS (Table 1; Supplemental Fig. 2), consistent with the fact that the former are more ancient breeds than the latter working dogs that have been domesticated recently (Vonholdt et al. 2010; Wang et al. 2013). In agreement with this, the minor allele frequency (MAF) distribution and Tajima’s D indicate a larger proportion of low frequency minor alleles in the ancient breeds than in the modern breeds (Supplemental Fig. 3). Additionally, linkage disequilibrium (LD) and haplotype analyses show that the ancient breeds have a faster decay of pairwise correlation coefficient (r2) and lower integrated haplotype homozygosity (iHH) (Voight et al. 2006) than the modern breeds (Supplemental Fig. 4).
To examine genetic relationships among the dogs, we conducted principal component analysis (PCA) based on whole-genome SNPs. In the PCA plot, the LJ, YJ, KM, and GS breeds could be separated by the first and second eigenvectors, while TM and DQ are mixed (Fig. 1A). However, when more eigenvectors are incorporated, most dogs in TM and DQ could still be separated (Fig. 1A). These results suggest close but different genetic backgrounds between TM and DQ. To resolve their phylogenetic relationships, we constructed a neighbor-joining (NJ) tree based on the pairwise genetic distances (Fig. 1B). The tree also splits TM and DQ into distinct branches except one dog in TM. Considering possible admixture among the breeds, we further performed population structure analysis with frappe (Tang et al. 2005), which estimates individual ancestry and admixture proportions assuming K ancestral populations (Fig. 1C). When K = 2, we found a division between the ancient (TM, DQ, LJ, and YJ) and modern breeds (KM and GS). When K = 3, we found a division between the breeds living at high altitude (TM and DQ) and at middle/low altitude (LJ and YJ). When K = 5, TM and DQ are separated, though a slight extent of ingression from DQ happened in the TM breed.
Figure 1.
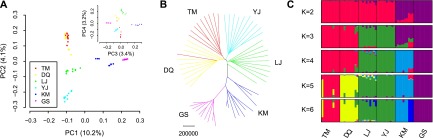
Genetic relationships and population structure of the 60 dogs based on all autosomal SNPs. (A) Principal component plot. The first (PC1) and second component (PC2) are shown in the main figure, while the third (PC3) and fourth component (PC4) are shown in the inset. The percentages indicate the proportion of variance explained by each component. (B) Unrooted neighbor-joining tree. The evolutionary distance is measured by the number of net nucleotide substitutions between individuals. (C) Population structures with the number of ancestral clusters K from 2 to 6. Each color represents one ancestral cluster and each vertical bar represents one dog. The length of colored segments represents corresponding ancestry attributions.
Signature of selection associated with high altitude
To detect the signature of natural selection associated with high altitude, we searched the dog genome for regions with a high coefficient of nucleotide differentiation FST among the breeds living at high (TM, DQ), middle (LJ), and low altitude (YJ, KM, GS) (Fig. 2A). The approach of population differentiation has been widely used to detect selective sweeps based on whole-genome SNPs, such as artificial selection during dog domestication (Axelsson et al. 2013) and diversification (Akey et al. 2010; Vonholdt et al. 2010). We scanned the autosomes with a nonoverlapping 100-kb window and calculated the FST value for each window. As previous studies (Axelsson et al. 2013), we focused on the regions with extremely high Z-transformed FST values [Z(FST) > 5] in the genome-wide empirical distribution. In total, 28 unique autosomal regions containing 141 candidate genes were identified (Supplemental Table 6), and five genes of them including EPAS1, MSRB3, HBB, CDK2, and GNB1 belong to the gene ontology (GO) categories “response to oxygen levels” and “response to oxidative stress” (Fig. 2A). To date the sweeps during the migration of dogs from low to high altitude, we also calculated the pairwise FST and Z(FST) between the three altitude levels (Supplemental Fig. 5; Supplemental Table 7).
Figure 2.
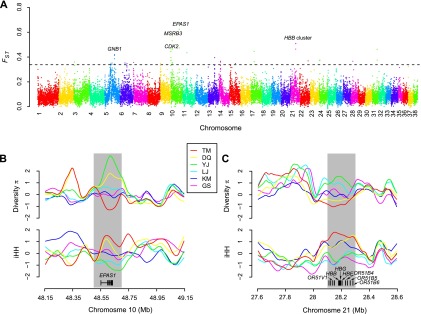
Selective sweep analysis of the breeds from different altitude levels. (A) Manhattan plot of FST among the high- (TM, DQ), middle- (LJ), and low- (YJ, KM, GS) altitude breeds. The FST was calculated for each 100-kb autosomal window. The dashed line denotes a threshold of Z(FST) = 5. (B) Diversity π and iHH around the EPAS1 loci. The region with Z(FST) > 5 is shaded. π and iHH were calculated for each 10-kb window and Z-transformed on the genome scale. The values were smoothed by lowess regression. (C) π and iHH around the beta hemoglobin loci.
The region with the strongest differentiation signal [Z(FST) = 10.83] (Fig. 2A) among the three altitude levels incorporates endothelial Per-Arnt-Sim (PAS) domain protein 1 (EPAS1), a gene encoding the HIF 2A (Patel and Simon 2008). The region is also highly differentiated when the high-altitude breeds were compared with the low- and middle-altitude ones [Z(FST) = 10.97 and 8.02, respectively] (Supplemental Fig. 5), suggesting that it is involved in a selective sweep during the move of dogs from middle to high altitude (Supplemental Table 7). Interestingly, EPAS1 was also identified as a selective target in Tibetan people (Beall et al. 2010; Yi et al. 2010; Peng et al. 2011; Xu et al. 2011), which is associated with their hemoglobin concentration (Beall et al. 2010; Yi et al. 2010). Network analysis indicated that the other candidate hypoxia-response genes we identified would all be regulated by HIF signaling pathway (Supplemental Fig. 6), suggesting an essential role of EPAS1 in the adaptation of high-altitude dogs.
The region with the second largest FST value [Z(FST) = 9.75] (Fig. 2A) among the three altitude levels is overlapped with methionine sulfoxide reductase B3 (MSRB3). Both the high- and middle-altitude breeds show high differentiation to the low-altitude ones in this region [Z(FST) = 9.77 and 6.75, respectively] (Supplemental Fig. 5), implying that the selective sweep occurred on the migration of dogs from low to middle altitude (Supplemental Table 7). MSRB3 has been identified as a gene associated with ear types in dogs (Boyko et al. 2010; Vaysse et al. 2011), but its association with altitude has not been reported previously. The beta hemoglobin (HBB) cluster region is also among the top three outliers [Z(FST) = 8.51] (Fig. 2A) and has a large differentiation between the high- and low-altitude breeds [Z(FST) = 8.84] (Supplemental Fig. 5), indicating a selective sweep on the dogs’ settlement from low to high altitude (Supplemental Table 7). The increases in oxygen affinity of hemoglobin have been found in diverse animal species to mediate the adaptive response to high altitude hypoxia (Storz and Moriyama 2008).
In addition to the increase of population differentiation, selective sweeps could result in the decrease of genetic diversity and increase of LD around the selective target (Nielsen 2005). Therefore, we compared π and iHH of the six breeds around the EPAS1 (Fig. 2B) and HBB loci (Fig. 2C), respectively. The π value of TM is decreased in the EPAS1 region and is the lowest among the six breeds. The iHH value of TM is increased in the EPAS1 region and is the highest among the six breeds (Fig. 2B). Both of the results supported that a selective sweep occurred in the EPAS1 region in TM. The DQ breed also shows an increased iHH value in the EPAS1 region as TM. However, the π value is increased in DQ, which may be caused by genetic admixture (Fig. 2B). The diversity of LJ in the EPAS1 region is the highest among the six breeds, suggesting extensive admixture and weak directional selection in the middle altitude dogs (Fig. 2B). When we inspected the beta hemoglobin cluster region, we observed a decrease of π value and increase of iHH value in both TM and DQ (Fig. 2C), confirming the FST screening that a selective sweep occurred in the loci of high-altitude dogs.
Mutations in the EPAS1 gene and physiological association
We examined the mutations in the EPAS1 gene in detail and found four nonsynonymous mutations in our sample, which cause amino acid variants Gly305-Ser (G305S), Asp494-Glu (D494E), Val500-Met (V500M), and Pro750-Ser (P750S) in the translated protein (based on Ensembl annotation) (Fig. 3A; Supplemental Table 8; Flicek et al. 2014). The four mutant alleles are in complete LD (pairwise r2 = 1) in all breeds, which are part of an 8-kb LD block (Supplemental Fig. 7). Haplotype tree (Fig. 3B) and network (Supplemental Fig. 7) of the LD block show that the haplotypes comprising the four mutant alleles all belong to the high-altitude clade, which have a long evolutionary distance from the haplotypes of the low-altitude clade. Also, the phylogenetic tree of the six breeds reconstructed from the LD block show separated clades between high and middle/low altitude (Supplemental Fig. 8), which is quite distinct from the genome-wide tree (ancient-modern separation). Interestingly, the frequency of the four mutant alleles is increased with the elevated altitude. It keeps rare in low-altitude breeds (KM 0%, GS 0%, YJ 5%), moderate in middle-altitude breeds (LJ 30%) but reaches high frequency in high-altitude breeds (DQ 80%, TM 100%) (Fig. 3C). To confirm this observation based on high-throughput sequencing, we performed genotyping of the four alleles on additional samples with Sanger sequencing and the result was similar: KM 0% (n = 11), GS 0% (n = 10), YJ 0% (n = 20), LJ 20% (n = 32), DQ 73% (n = 30), TM 94% (n = 35) (Fig. 3C). The high divergence of the haplotypes and alleles among the breeds indicates that the nonsynonymous mutations may be responsible for the selective sweep at EPAS1.
Figure 3.
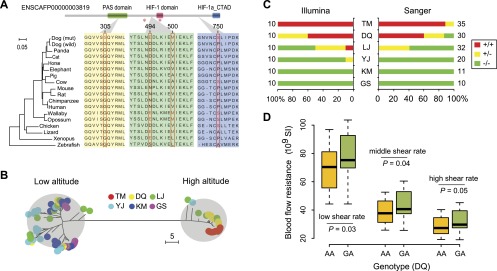
EPAS1 mutations in the coding region. (A) Structural and evolutionary analysis of the four amino acid variants. The protein coordinate is based on Ensembl ID ENSCAFP00000003819. The coordinate of NCBI RefSeq XP_531807.2 is slightly different but the variants remain the same. The upper panel shows the Pfam domains of the protein. The orthologous protein sequences from 17 vertebrates are aligned with the mutant residues shown in red. The NJ tree derived from the multiple alignment is shown in the left panel. The red stars indicate two hydroxylation sites (Pro405 and Pro531), which are essential for oxygen sensing (Patel and Simon 2008). (PAS) Per-Arnt-Sim; (HIF) hypoxia-inducible factor; (CTAD) C-terminal transactivation domain. (B) NJ tree of the 8-kb haplotypes comprising the four nonsynonymous mutations. The evolutionary distance is defined as the number of different nucleotides between haplotypes. The haplotypes from high- and low-altitude breeds were grouped into two distinct clades. (C) Percentages of homozygotes and heterozygotes in the six breeds. The mutant and reference alleles are represented by “+” and “−”, respectively. Besides the 60 dogs sequenced with the Illumina technology, additional samples were genotyped with Sanger sequencing. The sample size is shown beside the bars. (D) Association between EPAS1 genotypes (mutant allele, A; reference allele, G) and blood flow resistance in DQ. The blood flow resistance was measured at different shear rates. In the boxplot, the line within the box defines the median; the ends of the boxes define the 25th and 75th percentiles; and the error bars define the 10th and 90th percentiles. The ANOVA F-test was performed, taking the age as covariant.
Among the four variants, only one (G305S) occurred in a well-defined protein domain (PAS domain, Fig. 3A). This domain facilitates heterodimerization with the aryl hydrocarbon receptor nuclear translocator (ARNT), resulting in a functional transcriptional complex (Patel and Simon 2008). Taking the crystal structure of PAS domain in human EPAS1 as template, our homology modeling suggested that the mutation G305S occurred in a beta sheet, which may affect the thermodynamic stability of the domain (Supplemental Fig. 9). To further evaluate the functional impact of the variants, we aligned the mutant EPAS1 protein with its ortholog proteins in diverse vertebrates (Fig. 3A). The comparison reveals that G305S is also a quite conserved amino acid mutation, which is invariant among all the other animals we examined. In contrast, the remaining three variants could all be found in other species. Prediction of functional effects of the variants supports that only G305S is deleterious, while the others are tolerated (Supplemental Table 8). All of these results imply that G305S is the most likely causal mutation for the EPAS1 sweep in high-altitude dogs.
To explore the physiology of the dogs’ adaptation to high-altitude hypoxia, we measured the hematologic and hemorheologic parameters for indigenous dogs living in a range from 500 to 3000 m (Supplemental Table 9). There are evident tendencies of the blood-related traits with the increase of altitude. Especially, the adult hemoglobin concentrations among middle- and high-altitude dogs reach 170 g/L as compared with 130 g/L among low-altitude dogs, which is a clear advantage in the rise of arterial oxygen content. However, with the increase of hemoglobin concentration, the blood viscosity and vascular resistance are also increased (Supplemental Table 9), which brings about potential risks for cardiovascular systems (Somer and Meiselman 1993; Allen and Patterson 1995). As the association between SNPs at EPAS1 and blood-related traits has been well established in humans (van Patot and Gassmann 2011), we conducted association testing for the variant G305S in DQ (Supplemental Table 10), the high-altitude breed where enough homozygotes (n = 40) and heterozygotes (n = 29) could be collected. Although no evident relationship with hemoglobin concentration was found, we discovered a statistically significant association between the genotypes and vascular resistance (Fig. 3D). The homozygotes with two mutant alleles show decreased vascular resistance as compared with the heterozygotes. The results suggest that the G305S variant may play important roles in the improvement of blood fluidity, which confers advantages for oxygen delivery and cardiovascular functions.
Discussion
In this study, we performed whole-genome sequencing of 60 dogs including five breeds from continuous altitudes along the Ancient Tea Horse Road in the Tibetan Plateau as well as one breed of GS. We catalogued millions of SNPs of each breed for evolutionary and genetic researches. Specifically, this is the first study to characterize the genetic polymorphisms of TM, which are known as “oriental deiform dogs” in Tibet and one of the most ancient and ferocious dogs in the world (Li and Zhang 2012). Our population structure analyses revealed that TM have a close but different genetic background with other indigenous dogs living at high altitude (Fig. 1), though their origin and relationship with plateau wolves need further studies. We also found the existence of admixture among TM and indigenous dogs (Fig. 1), which raised the demands for genetic testing in the identification and breeding of TM.
We conducted selective sweep mapping for the breeds from different altitudes and identified several candidate regions with a high extent of differentiation on the genome scale (Fig. 2A). Two of the genes contained in the top regions, EPAS1 and HBB, were previously reported as targets of natural selection for hypoxia adaptation in humans and other animals (Storz and Moriyama 2008; van Patot and Gassmann 2011). The two loci also displayed reduced genetic diversity and/or increased LD in high-altitude dogs especially TM (Fig. 2B,C). These results suggest that, driven by the same hypoxic environment, natural selection could act on a similar group of genes in the adaptive process of different species. Interestingly, the parallel evolution on the molecular level may extensively exist between humans and dogs in metabolic and neurological processes, probably due to their similar environments in the recent past (Wang et al. 2013).
We discovered and validated four novel nonsynonymous mutations at EPAS1 in high-altitude dogs, of which G305S occurred in a well-defined domain and quite conserved site (Fig. 3A). The mutant alleles and corresponding haplotypes have a large divergence between low- and high-altitude dogs (Fig. 3B,C), implying that the amino acid variations may be responsible for the signal of selective sweep at the EPAS1 locus.
The transcription factor encoded by EPAS1 plays a key role in transcriptional response to hypoxia in various physiological and pathologic conditions, including up-regulating the expression of erythropoietin (EPO) (Patel and Simon 2008). Especially, mutations at EPAS1 in humans are strongly associated with hematologic phenotypes (van Patot and Gassmann 2011). On one hand, clinical case studies found that several gain-of-function mutations occurred in close vicinity to the primary hydroxylation site (Pro531) at EPAS1 cause erythrocytosis (Percy et al. 2008a,b). On the other hand, the EPAS1 polymorphisms unique to the native Tibetan people were found to be associated with their lower hemoglobin concentrations (Beall et al. 2010; Yi et al. 2010), suggesting a loss-of-function role of EPAS1 in high-altitude adaptation. As erythrocytosis is a common symptom of chronic mountain sickness which will lead to high blood viscosity and cardiovascular disorders, the decrease in hemoglobin level may provide a protective mechanism for Tibetan people (Beall et al. 2010; van Patot and Gassmann 2011). In fact, comparing with Andeans and other highland migrants with shorter settlement history, Tibetans do not show markedly elevated hemoglobin concentration (Beall 2007), probably due to their unique EPAS1 genotypes (van Patot and Gassmann 2011). Instead, Tibetans display a higher blood flow for oxygen delivery (Erzurum et al. 2007), which could compensate the effect of lower hemoglobin concentration.
Nonetheless, it is worth noting that all EPAS1 variations detected previously in the Tibetan population are at introns (Beall et al. 2010; Yi et al. 2010), inhibiting further study of its molecular mechanism in the adaptive process. Fortunately, the key amino acid mutation we identified at EPAS1 in dogs, G305S, is predicted to be damaging, which is also likely to cause the loss of function of EPAS1. Moreover, we demonstrated that the variation is associated with lower blood flow resistance in high-altitude dogs (Fig. 3D). Therefore, we propose that similar mechanisms may be adopted by both humans and dogs in adaptation to high-altitude hypoxia. Although the physiological responses need further comparison between humans and dogs, these novel variations of EPAS1 could shed new insights into the study of the gene function.
Methods
Sample preparation and sequencing
For each dog, the genomic DNA was extracted from 200 μL peripheral venous blood with the QIAamp DNA Blood Mini kit (Qiagen). The quality and integrity of DNA was controlled by A260/280 ratio and agarose gel electrophoresis. For sequencing library preparation, the genomic DNA was sheared to fragments of 300–500 bp, which were then end-repaired, “A”-tailed, and ligated to Illumina sequencing adapters. The ligated products with sizes of 400–500 bp were selected on 2% agarose gels and then amplified by LM-PCR. The libraries were sequenced on Illumina HiSeq 2000 with 2 × 100 bp paired-end mode, which was controlled by Illumina HiSeq Control Software.
Reads processing and variant calling
The raw reads were processed by two rounds of quality control (QC) (Supplemental Table 1). Firstly, low quality reads marked by Illumina sequencers in the FASTQ files (Casava v1.8) were filtered. Secondly, for each read, the low quality end with base quality scores <20 were trimmed. The read was removed if its length was <35 after trimming. Only paired reads were preserved during QC. Reads after QC were mapped to the dog reference genome assembly canFam3 (http://hgdownload.soe.ucsc.edu/goldenPath/canFam3/bigZips/canFam3.fa.gz) using BWA-MEM (v0.7.4) (Li and Durbin 2009) with default parameters on a per-individual basis. We removed duplicated reads and calculated mapping statistics including the coverage of depth from the .bam files by SAMtools (v0.1.19) (Li et al. 2009; Supplemental Table 2).
The SNPs and small indels were called using the SAMtools pipeline (Li 2011) on a per-breed (10 individuals) basis (Supplemental Table 3). Firstly, .mpileup files were generated by SAMtools mpileup with the parameters “-u -C50 -DS -q20”. Secondly, .vcf files containing raw variants were generated by bctools view with the parameters “-evcgN”. Finally, the raw variants were filtered by vcfutils.pl varFilter with the minimum depth “-d 20” and maximum depth “-D 300”. The cutoffs were set according to the sequencing depth distribution per individual (Supplemental Fig. 1). Other parameters for filtering were default, including P-value of Hardy–Weinberg equilibrium (0.0001). Given the position of a variant, the genotype with the maximum posterior probability of each individual was given in the .vcf file. The variants after filtering were annotated by ANNOVAR (v2013-06-21) (Wang et al. 2010) according to Ensembl (Flicek et al. 2014) gene annotation (http://hgdownload.soe.ucsc.edu/goldenPath/canFam3/database/ensGene.txt.gz) (Supplemental Tables 4, 5).
Population genetics analysis
The .vcf files for the six breeds were merged by vcf-merge in VCFtools (v0.1.11) (Danecek et al. 2011). When a genotype was missing in one breed, it was set to the reference allele with the option “-R 0/0”. Only biallelic SNPs in autosomes were preserved for subsequent population structure and polymorphism analysis. The merged .vcf file was converted to tab-delimited text file by vcf-to-tab in VCFtools, and to PLINK format files (.ped and .map) by VCFtools and PLINK (v1.07) (Purcell et al. 2007) when appropriate. The PCA was performed by GCTA (v1.13) (Fig. 1A; Yang et al. 2011), which first generated the genetic relationship matrix (GRM) with the “–make-grm” option and then estimated the first four principal components with the “–pca 4” option. The pairwise genetic distances between individuals were measured by the number of net nucleotide substitutions (formula 12.67 in Nei and Kumar 2000), which were calculated for each SNP sites and then summed up. Based on the distance matrix, the NJ tree was constructed and displayed by MEGA (v5.2) (Fig. 1B; Tamura et al. 2011). The population structure was inferred by frappe (v1.1) (Tang et al. 2005) with a maximum likelihood method (Fig. 1C). The number of ancestral clusters K ranged from 2 to 6, with 10,000 iterations each run. The graphs of the population structure were displayed by distruct (v1.1) (Rosenberg 2004) on a per-individual basis.
Standard population genetic statistics, including Watterson’s θ, pairwise nucleotide diversity π (Supplemental Fig. 2), and Tajima’s D (Supplemental Fig. 3) were calculated for each breed by the Bio∷PopGen∷Statistics package in BioPerl (v1.6.1) (Stajich et al. 2002). The coefficient of nucleotide differentiation FST among the breeds was calculated by the Bio∷PopGen∷PopStats package in BioPerl (Supplemental Table 6). The statistics were estimated over a sliding window with a fixed size along the genome. The Manhattan plot of genome-wide FST values was generated using the mhtplot function in the R package gap (Fig. 2A; Supplemental Fig. 5). The level of LD measured by the correlation coefficient (r2) between unphased markers (Supplemental Fig. 4A) was calculated by Haploview (v4.2) (Barrett et al. 2005) with the option “-dprime -maxdistance 50 -minMAF 0.1 -hwcutoff 0.05”. We also phased the genotypes of all individuals into haplotypes by fastPHASE (v1.4.0) (Scheet and Stephens 2006) with the parameters “-T10 -K8 -u”. The iHH (Voight et al. 2006) for each breed was calculated by XP-EHH (Pickrell et al. 2009) based on the phased data (Supplemental Fig. 4B). The iHH values were log-transformed and averaged over a sliding window with fixed size along the genome.
EPAS1 mutation analysis
The protein domains of EPAS1 were predicted by the Pfam web service (Fig. 3A; Punta et al. 2012). The ortholog proteins of EPAS1 in 17 representative vertebrates were retrieved from Ensembl (Flicek et al. 2014) (release 72) and only one-to-one orthologs were included (Fig. 3A). The multiple sequence alignment was performed by ClustalX (v2.1) (Larkin et al. 2007) and displayed by Jalview (v2.8) (Waterhouse et al. 2009). The LD block containing the nonsynonymous mutations was detected and visualized by Haploview (v4.2) (Supplemental Fig. 7A; Barrett et al. 2005). The haplotype NJ tree was constructed by MEGA (v5.2) (Tamura et al. 2011) with the default parameters (Fig. 3B). The haplotype network was constructed and plotted by Network (v4.611, Fluxus Engineering) (Supplemental Fig. 7B). It was calculated with the median-joining method (Bandelt et al. 1999) (ɛ = 0), followed by reduction with the MP option (Polzin and Daneshmand 2003). The sequence of dog EPAS1 was searched against the PDB database (Rose et al. 2013) using BLAST-P (Altschul et al. 1997) to identify suitable templates for homology modeling (Supplemental Fig. 9). I-TASSER (v2.1) (Roy et al. 2010) was used for structure modeling by threading the sequence onto the selected templates. The three-dimensional model structures were visualized with PyMOL (v1.6, Schrödinger, LLC). Structure-based energy calculation was performed by the Eris server (Yin et al. 2007) using the flexible backbone method upon single amino acid substitutions. The functional consequences of amino acid mutations were predicted by SIFT (Kumar et al. 2009), which was invoked through Ensembl’s (Flicek et al. 2014) Variant Effect Predictor (Supplemental Table 8).
Physiological measurement and association test
The foreleg venous blood was collected to measure the physiological parameters in situ. The hematologic and hemorheologic parameters were measured by BC-2800Vet Auto Hematology Analyzer (Mindray Co., Ltd.) and ZL1000 Auto Blood Rheology Analyzer (Zonci Co., Ltd.), respectively (Supplemental Tables 9, 10). The nonsynonymous mutations at EPAS1 were genotyped by traditional Sanger sequence technology. The association testing was performed with each physiological parameter as the response variable, genotype as the predictive variable, and age (<1 yr vs. >1 yr) as the covariate. We also modeled the gender as a covariate but no difference was found in this factor. The F test in the analysis of variance (ANOVA) was used to evaluate the significance of genotypes (Fig. 3D).
Data access
All sequencing data from this study have been submitted to the NCBI Sequence Read Archive (SRA; http://www.ncbi.nlm.nih.gov/sra) under accession number SRP035294.
Acknowledgments
We thank Professor Li Yang from CAS-MPG Partner Institute for Computational Biology, SIBS, CAS, and Dr. Zhongkai Gu from the Institute of Biomedical Sciences, Fudan University for their help in providing sequencing instruments. We also thank the anonymous reviewers for their constructive comments. We are indebted to many people whose names are not included in the author list, but who contributed to this project. This work was supported by the State Key Basic Research Program (973) (2011CB910204, 2010CB529206, 2011CBA00801), Research Program of CAS (KSCX2-EW-R-04, KSCX2-YW-R-190, XXH12503-02-02-09), National Natural Science Foundation of China (31260544, U1036604, 31070752, 31301032), Chinese Ministry for Science and Technology Grant (2008BAI64B01), Chinese High-Tech R&D Program (863) (2013AA102503, 2009AA02Z304, 2012AA020404), China Postdoctoral Science Foundation (2013M531226), Shanghai Postdoctoral Scientific Program (13R21417300), and the SA-SIBS Scholarship Program.
Footnotes
[Supplemental material is available for this article.]
Article published online before print. Article, supplemental material, and publication date are at http://www.genome.org/cgi/doi/10.1101/gr.171876.113.
References
- Akey JM, Ruhe AL, Akey DT, Wong AK, Connelly CF, Madeoy J, Nicholas TJ, Neff MW. 2010. Tracking footprints of artificial selection in the dog genome. Proc Natl Acad Sci 107: 1160–1165 [DOI] [PMC free article] [PubMed] [Google Scholar]
- Alkorta-Aranburu G, Beall CM, Witonsky DB, Gebremedhin A, Pritchard JK, Di Rienzo A. 2012. The genetic architecture of adaptations to high altitude in Ethiopia. PLoS Genet 8: e1003110. [DOI] [PMC free article] [PubMed] [Google Scholar]
- Allen MT, Patterson SM. 1995. Hemoconcentration and stress: a review of physiological mechanisms and relevance for cardiovascular disease risk. Biol Psychol 41: 1–27 [DOI] [PubMed] [Google Scholar]
- Altschul SF, Madden TL, Schaffer AA, Zhang J, Zhang Z, Miller W, Lipman DJ. 1997. Gapped BLAST and PSI-BLAST: a new generation of protein database search programs. Nucleic Acids Res 25: 3389–3402 [DOI] [PMC free article] [PubMed] [Google Scholar]
- Axelsson E, Ratnakumar A, Arendt ML, Maqbool K, Webster MT, Perloski M, Liberg O, Arnemo JM, Hedhammar A, Lindblad-Toh K. 2013. The genomic signature of dog domestication reveals adaptation to a starch-rich diet. Nature 495: 360–364 [DOI] [PubMed] [Google Scholar]
- Bandelt HJ, Forster P, Rohl A. 1999. Median-joining networks for inferring intraspecific phylogenies. Mol Biol Evol 16: 37–48 [DOI] [PubMed] [Google Scholar]
- Barrett JC, Fry B, Maller J, Daly MJ. 2005. Haploview: analysis and visualization of LD and haplotype maps. Bioinformatics 21: 263–265 [DOI] [PubMed] [Google Scholar]
- Beall CM 2007. Two routes to functional adaptation: Tibetan and Andean high-altitude natives. Proc Natl Acad Sci (Suppl 1) 104: 8655–8660 [DOI] [PMC free article] [PubMed] [Google Scholar]
- Beall CM, Laskowski D, Strohl KP, Soria R, Villena M, Vargas E, Alarcon AM, Gonzales C, Erzurum SC. 2001. Pulmonary nitric oxide in mountain dwellers. Nature 414: 411–412 [DOI] [PubMed] [Google Scholar]
- Beall CM, Decker MJ, Brittenham GM, Kushner I, Gebremedhin A, Strohl KP. 2002. An Ethiopian pattern of human adaptation to high-altitude hypoxia. Proc Natl Acad Sci 99: 17215–17218 [DOI] [PMC free article] [PubMed] [Google Scholar]
- Beall CM, Cavalleri GL, Deng L, Elston RC, Gao Y, Knight J, Li C, Li JC, Liang Y, McCormack M, et al. 2010. Natural selection on EPAS1 (HIF2α) associated with low hemoglobin concentration in Tibetan highlanders. Proc Natl Acad Sci 107: 11459–11464 [DOI] [PMC free article] [PubMed] [Google Scholar]
- Bigham AW, Mao X, Mei R, Brutsaert T, Wilson MJ, Julian CG, Parra EJ, Akey JM, Moore LG, Shriver MD. 2009. Identifying positive selection candidate loci for high-altitude adaptation in Andean populations. Hum Genomics 4: 79–90 [DOI] [PMC free article] [PubMed] [Google Scholar]
- Bigham A, Bauchet M, Pinto D, Mao XY, Akey JM, Mei R, Scherer SW, Julian CG, Wilson MJ, Herraez DL, et al. 2010. Identifying signatures of natural selection in Tibetan and Andean populations using dense genome scan data. PLoS Genet 6: e1001116. [DOI] [PMC free article] [PubMed] [Google Scholar]
- Boyko AR, Quignon P, Li L, Schoenebeck JJ, Degenhardt JD, Lohmueller KE, Zhao K, Brisbin A, Parker HG, vonHoldt BM, et al. 2010. A simple genetic architecture underlies morphological variation in dogs. PLoS Biol 8: e1000451. [DOI] [PMC free article] [PubMed] [Google Scholar]
- Cho YS, Hu L, Hou H, Lee H, Xu J, Kwon S, Oh S, Kim HM, Jho S, Kim S, et al. 2013. The tiger genome and comparative analysis with lion and snow leopard genomes. Nat Commun 4: 2433. [DOI] [PMC free article] [PubMed] [Google Scholar]
- Danecek P, Auton A, Abecasis G, Albers CA, Banks E, DePristo MA, Handsaker RE, Lunter G, Marth GT, Sherry ST, et al. 2011. The variant call format and VCFtools. Bioinformatics 27: 2156–2158 [DOI] [PMC free article] [PubMed] [Google Scholar]
- Erzurum SC, Ghosh S, Janocha AJ, Xu W, Bauer S, Bryan NS, Tejero J, Hemann C, Hille R, Stuehr DJ, et al. 2007. Higher blood flow and circulating NO products offset high-altitude hypoxia among Tibetans. Proc Natl Acad Sci 104: 17593–17598 [DOI] [PMC free article] [PubMed] [Google Scholar]
- Flicek P, Amode MR, Barrell D, Beal K, Billis K, Brent S, Carvalho-Silva D, Clapham P, Coates G, Fitzgerald S, et al. 2014. Ensembl 2014. Nucleic Acids Res 42: D749–D755 [DOI] [PMC free article] [PubMed] [Google Scholar]
- Ge RL, Cai QL, Shen YY, San A, Ma L, Zhang Y, Yi X, Chen Y, Yang LF, Huang Y, et al. 2013. Draft genome sequence of the Tibetan antelope. Nat Commun 4: 1858. [DOI] [PMC free article] [PubMed] [Google Scholar]
- Jessen TH, Weber RE, Fermi G, Tame J, Braunitzer G. 1991. Adaptation of bird hemoglobins to high altitudes: demonstration of molecular mechanism by protein engineering. Proc Natl Acad Sci 88: 6519–6522 [DOI] [PMC free article] [PubMed] [Google Scholar]
- Kumar P, Henikoff S, Ng PC. 2009. Predicting the effects of coding non-synonymous variants on protein function using the SIFT algorithm. Nat Protoc 4: 1073–1081 [DOI] [PubMed] [Google Scholar]
- Larkin MA, Blackshields G, Brown NP, Chenna R, McGettigan PA, McWilliam H, Valentin F, Wallace IM, Wilm A, Lopez R, et al. 2007. Clustal W and Clustal X version 2.0. Bioinformatics 23: 2947–2948 [DOI] [PubMed] [Google Scholar]
- Li H 2011. A statistical framework for SNP calling, mutation discovery, association mapping and population genetical parameter estimation from sequencing data. Bioinformatics 27: 2987–2993 [DOI] [PMC free article] [PubMed] [Google Scholar]
- Li H, Durbin R. 2009. Fast and accurate short read alignment with Burrows-Wheeler transform. Bioinformatics 25: 1754–1760 [DOI] [PMC free article] [PubMed] [Google Scholar]
- Li Y, Zhang YP. 2012. High genetic diversity of Tibetan Mastiffs revealed by mtDNA sequences. Chin Sci Bull 57: 1483–1487 [Google Scholar]
- Li H, Handsaker B, Wysoker A, Fennell T, Ruan J, Homer N, Marth G, Abecasis G, Durbin R. 2009. The Sequence Alignment/Map format and SAMtools. Bioinformatics 25: 2078–2079 [DOI] [PMC free article] [PubMed] [Google Scholar]
- Li M, Tian S, Jin L, Zhou G, Li Y, Zhang Y, Wang T, Yeung CK, Chen L, Ma J, et al. 2013. Genomic analyses identify distinct patterns of selection in domesticated pigs and Tibetan wild boars. Nat Genet 45: 1431–1438 [DOI] [PubMed] [Google Scholar]
- Liang Y, Hua Z, Liang X, Xu Q, Lu G. 2001. The crystal structure of bar-headed goose hemoglobin in deoxy form: the allosteric mechanism of a hemoglobin species with high oxygen affinity. J Mol Biol 313: 123–137 [DOI] [PubMed] [Google Scholar]
- Nei M, Kumar S. 2000. Molecular evolution and phylogenetics. Oxford University Press, New York. [Google Scholar]
- Nielsen R 2005. Molecular signatures of natural selection. Annu Rev Genet 39: 197–218 [DOI] [PubMed] [Google Scholar]
- Patel SA, Simon MC. 2008. Biology of hypoxia-inducible factor-2α in development and disease. Cell Death Differ 15: 628–634 [DOI] [PMC free article] [PubMed] [Google Scholar]
- Peng Y, Yang Z, Zhang H, Cui C, Qi X, Luo X, Tao X, Wu T, Ouzhuluobu, Basang, et al. 2011. Genetic variations in Tibetan populations and high-altitude adaptation at the Himalayas. Mol Biol Evol 28: 1075–1081 [DOI] [PubMed] [Google Scholar]
- Percy MJ, Beer PA, Campbell G, Dekker AW, Green AR, Oscier D, Rainey MG, van Wijk R, Wood M, Lappin TR, et al. 2008a. Novel exon 12 mutations in the HIF2A gene associated with erythrocytosis. Blood 111: 5400–5402 [DOI] [PMC free article] [PubMed] [Google Scholar]
- Percy MJ, Furlow PW, Lucas GS, Li X, Lappin TR, McMullin MF, Lee FS. 2008b. A gain-of-function mutation in the HIF2A gene in familial erythrocytosis. N Engl J Med 358: 162–168 [DOI] [PMC free article] [PubMed] [Google Scholar]
- Piccinini M, Kleinschmidt T, Jurgens KD, Braunitzer G. 1990. Primary structure and oxygen-binding properties of the hemoglobin from guanaco (Lama guanacoe, Tylopoda). Biol Chem Hoppe Seyler 371: 641–648 [DOI] [PubMed] [Google Scholar]
- Pickrell JK, Coop G, Novembre J, Kudaravalli S, Li JZ, Absher D, Srinivasan BS, Barsh GS, Myers RM, Feldman MW, et al. 2009. Signals of recent positive selection in a worldwide sample of human populations. Genome Res 19: 826–837 [DOI] [PMC free article] [PubMed] [Google Scholar]
- Polzin T, Daneshmand SV. 2003. On Steiner trees and minimum spanning trees in hypergraphs. Oper Res Lett 31: 12–20 [Google Scholar]
- Punta M, Coggill PC, Eberhardt RY, Mistry J, Tate J, Boursnell C, Pang N, Forslund K, Ceric G, Clements J, et al. 2012. The Pfam protein families database. Nucleic Acids Res 40: D290–D301 [DOI] [PMC free article] [PubMed] [Google Scholar]
- Purcell S, Neale B, Todd-Brown K, Thomas L, Ferreira MA, Bender D, Maller J, Sklar P, de Bakker PI, Daly MJ, et al. 2007. PLINK: a tool set for whole-genome association and population-based linkage analyses. Am J Hum Genet 81: 559–575 [DOI] [PMC free article] [PubMed] [Google Scholar]
- Qiu Q, Zhang GJ, Ma T, Qian WB, Wang JY, Ye ZQ, Cao CC, Hu QJ, Kim J, Larkin DM, et al. 2012. The yak genome and adaptation to life at high altitude. Nat Genet 44: 946. [DOI] [PubMed] [Google Scholar]
- Rose PW, Bi C, Bluhm WF, Christie CH, Dimitropoulos D, Dutta S, Green RK, Goodsell DS, Prlic A, Quesada M, et al. 2013. The RCSB Protein Data Bank: new resources for research and education. Nucleic Acids Res 41: D475–D482 [DOI] [PMC free article] [PubMed] [Google Scholar]
- Rosenberg NA 2004. DISTRUCT: a program for the graphical display of population structure. Mol Ecol Notes 4: 137–138 [Google Scholar]
- Roy A, Kucukural A, Zhang Y. 2010. I-TASSER: a unified platform for automated protein structure and function prediction. Nat Protoc 5: 725–738 [DOI] [PMC free article] [PubMed] [Google Scholar]
- Scheet P, Stephens M. 2006. A fast and flexible statistical model for large-scale population genotype data: applications to inferring missing genotypes and haplotypic phase. Am J Hum Genet 78: 629–644 [DOI] [PMC free article] [PubMed] [Google Scholar]
- Scheinfeldt LB, Soi S, Thompson S, Ranciaro A, Woldemeskel D, Beggs W, Lambert C, Jarvis JP, Abate D, Belay G, et al. 2012. Genetic adaptation to high altitude in the Ethiopian highlands. Genome Biol 13: R1. [DOI] [PMC free article] [PubMed] [Google Scholar]
- Simonson TS, Yang Y, Huff CD, Yun H, Qin G, Witherspoon DJ, Bai Z, Lorenzo FR, Xing J, Jorde LB, et al. 2010. Genetic evidence for high-altitude adaptation in Tibet. Science 329: 72–75 [DOI] [PubMed] [Google Scholar]
- Somer T, Meiselman HJ. 1993. Disorders of blood viscosity. Ann Med 25: 31–39 [DOI] [PubMed] [Google Scholar]
- Stajich JE, Block D, Boulez K, Brenner SE, Chervitz SA, Dagdigian C, Fuellen G, Gilbert JG, Korf I, Lapp H, et al. 2002. The Bioperl toolkit: Perl modules for the life sciences. Genome Res 12: 1611–1618 [DOI] [PMC free article] [PubMed] [Google Scholar]
- Storz JF, Moriyama H. 2008. Mechanisms of hemoglobin adaptation to high altitude hypoxia. High Alt Med Biol 9: 148–157 [DOI] [PMC free article] [PubMed] [Google Scholar]
- Storz JF, Sabatino SJ, Hoffmann FG, Gering EJ, Moriyama H, Ferrand N, Monteiro B, Nachman MW. 2007. The molecular basis of high-altitude adaptation in deer mice. PLoS Genet 3: e45. [DOI] [PMC free article] [PubMed] [Google Scholar]
- Storz JF, Runck AM, Sabatino SJ, Kelly JK, Ferrand N, Moriyama H, Weber RE, Fago A. 2009. Evolutionary and functional insights into the mechanism underlying high-altitude adaptation of deer mouse hemoglobin. Proc Natl Acad Sci 106: 14450–14455 [DOI] [PMC free article] [PubMed] [Google Scholar]
- Tamura K, Peterson D, Peterson N, Stecher G, Nei M, Kumar S. 2011. MEGA5: molecular evolutionary genetics analysis using maximum likelihood, evolutionary distance, and maximum parsimony methods. Mol Biol Evol 28: 2731–2739 [DOI] [PMC free article] [PubMed] [Google Scholar]
- Tang H, Peng J, Wang P, Risch NJ. 2005. Estimation of individual admixture: analytical and study design considerations. Genet Epidemiol 28: 289–301 [DOI] [PubMed] [Google Scholar]
- van Patot MCT, Gassmann M. 2011. Hypoxia: adapting to high altitude by mutating EPAS-1, the gene encoding HIF-2 α. High Alt Med Biol 12: 157–167 [DOI] [PubMed] [Google Scholar]
- Vaysse A, Ratnakumar A, Derrien T, Axelsson E, Rosengren Pielberg G, Sigurdsson S, Fall T, Seppala EH, Hansen MS, Lawley CT, et al. 2011. Identification of genomic regions associated with phenotypic variation between dog breeds using selection mapping. PLoS Genet 7: e1002316. [DOI] [PMC free article] [PubMed] [Google Scholar]
- Voight BF, Kudaravalli S, Wen X, Pritchard JK. 2006. A map of recent positive selection in the human genome. PLoS Biol 4: e72. [DOI] [PMC free article] [PubMed] [Google Scholar]
- Vonholdt BM, Pollinger JP, Lohmueller KE, Han E, Parker HG, Quignon P, Degenhardt JD, Boyko AR, Earl DA, Auton A, et al. 2010. Genome-wide SNP and haplotype analyses reveal a rich history underlying dog domestication. Nature 464: 898–902 [DOI] [PMC free article] [PubMed] [Google Scholar]
- Wang K, Li M, Hakonarson H. 2010. ANNOVAR: functional annotation of genetic variants from high-throughput sequencing data. Nucleic Acids Res 38: e164. [DOI] [PMC free article] [PubMed] [Google Scholar]
- Wang GD, Zhai WW, Yang HC, Fan RX, Cao X, Zhong L, Wang L, Liu F, Wu H, Cheng LG, et al. 2013. The genomics of selection in dogs and the parallel evolution between dogs and humans. Nat Commun 4: 1860. [DOI] [PubMed] [Google Scholar]
- Waterhouse AM, Procter JB, Martin DM, Clamp M, Barton GJ. 2009. Jalview Version 2—a multiple sequence alignment editor and analysis workbench. Bioinformatics 25: 1189–1191 [DOI] [PMC free article] [PubMed] [Google Scholar]
- Weber RE, Lalthantluanga R, Braunitzer G. 1988. Functional characterization of fetal and adult yak hemoglobins: an oxygen binding cascade and its molecular basis. Arch Biochem Biophys 263: 199–203 [DOI] [PubMed] [Google Scholar]
- Xu S, Li S, Yang Y, Tan J, Lou H, Jin W, Yang L, Pan X, Wang J, Shen Y, et al. 2011. A genome-wide search for signals of high-altitude adaptation in Tibetans. Mol Biol Evol 28: 1003–1011 [DOI] [PubMed] [Google Scholar]
- Yang J, Lee SH, Goddard ME, Visscher PM. 2011. GCTA: a tool for genome-wide complex trait analysis. Am J Hum Genet 88: 76–82 [DOI] [PMC free article] [PubMed] [Google Scholar]
- Yi X, Liang Y, Huerta-Sanchez E, Jin X, Cuo ZX, Pool JE, Xu X, Jiang H, Vinckenbosch N, Korneliussen TS, et al. 2010. Sequencing of 50 human exomes reveals adaptation to high altitude. Science 329: 75–78 [DOI] [PMC free article] [PubMed] [Google Scholar]
- Yin S, Ding F, Dokholyan NV. 2007. Eris: an automated estimator of protein stability. Nat Methods 4: 466–467 [DOI] [PubMed] [Google Scholar]
- Zhang J, Hua Z, Tame JR, Lu G, Zhang R, Gu X. 1996. The crystal structure of a high oxygen affinity species of haemoglobin (bar-headed goose haemoglobin in the oxy form). J Mol Biol 255: 484–493 [DOI] [PubMed] [Google Scholar]
- Zhao M, Kong QP, Wang HW, Peng MS, Xie XD, Wang WZ, Jiayang, Duan JG, Cai MC, Zhao SN, et al. 2009. Mitochondrial genome evidence reveals successful Late Paleolithic settlement on the Tibetan Plateau. Proc Natl Acad Sci 106: 21230–21235 [DOI] [PMC free article] [PubMed] [Google Scholar]