

Abstract
The evolution of immunology research from measurements of single entities to large scale data-intensive assays necessitates the integration of experimental work with bioinformatics and computational approaches. The introduction of physics into immunology has led to the study of new phenomena, such as cellular noise, that are likely to prove increasingly important to understand immune system responses. The fusion of “hard science” and biology is also leading to a reexamination of data acquisition, analysis and statistical validation and is resulting in the development of easy-to-access tools for immunology research. Here we review some of our models, computational tools and results related to studies of the innate immune response of human dendritic cells to viral infection.
Our project functions on an open model across institutions with electronic record keeping and public sharing of data. Our tools, models and data can be accessed at http://tsb.mssm.edu/primeportal/
Keywords: computational immunology, tools, models, dendritic cells
Project
We have undertaken an NIAID-sponsored Modeling Immunity for Biodefense project that involves a tight collaboration between experimenters and modelers. The aim is to develop a mechanistic understanding of the initial stages of viral infection, in order to be able to comprehend and predict pathogenicity of newly emerging viruses.
We focus on the innate immune response in dendritic cells (DC). DCs, as professional antigen presenting cells, contribute to the development of the adaptive immune response tailored to each specific virus [1]. For the in vitro component of our experimental work, the DCs studied are derived from monocytes extracted from human blood. The interaction between viruses and DCs is a complicated dance, where the cells attempt to limit the impact of the virus and the virus attempts to circumvent cellular defenses. The viruses studied are the Newcastle Disease virus (NDV) and H1N1 influenza A viruses. NDV, because it is avian, does not counteract the cellular immune response in human DCs, thus allowing a full view of the temporal development of that response [2]. Influenza A H1N1 viruses studied range from PR8 to the 1918 pandemic virus, include seasonal viruses such as Texas/91, New Caledonia/99 and the recent pandemic virus Cal/09, as well as sequence modified viruses to alter their immune antagonists or to incorporate fluorescent reporter proteins. These viruses interfere with the immune responses at many different levels once they have entered the cell [3]. A comparison of their impact on the immune response, both in terms of its dynamics and its strength, is expected to lead to mechanistic insights about the different strategies employed by virus to achieve a successful infection.
Role of computational approaches
Computational approaches serve to organize multiple sets of data in a common framework, to highlight in this way salient features and to illuminate connections between different aspects of the system under study. Once the model is built, it can be used to explore biological regimes not covered by the experiments at hand, to make predictions that are a test of the model, and to lead to new insights about hidden components or unexplored relationships between known ones.
Computational approaches can also be used to improve data acquisition and analysis, e.g. flow cytometry through flow compensation and clustering algorithms.
Population and Single cell experiments
The experiments are meant to probe the early dynamics of the innate immune responses up to 10 hours after infection. Measurements (microarray, PCR, multiplex ELISA, flow cytometry) need therefore be made at a number of time points. They encompass population wide measurements, which are assumed to describe the behavior of a typical cell, but also single cell measurements which give insight into cell-to-cell variability under similar conditions of stimulation [4,5]. Cell-to-cell variability can play a crucial role in cellular response, such as in the case of all-or-none behavior [6]. Extreme variability in the responses of individual cells can misleadingly appear smooth and gradual in biochemical assays that measure the responses of populations of cells.
Computational methods
Diverse computational approaches are useful for immunology, including deterministic differential equation modeling that reflects average cell response, stochastic models that account for single cell variability [7], data-driven reverse engineering approaches that predict relationships among entities measured and hybrid approaches. For time-course microarray data, on top of the usual clustering analysis, we have developed an algorithm (TIDAL) to reconstruct the temporal development of the network of transcription factors active in the immune response [8]. For PCR population studies we build networks of cellular infection, immune response, and viral antagonism based on gene expression levels, which are derived from a set of chemical reactions. These reactions form the basis of a system of time dependent ordinary differential equations (ODE) that depend on a number of reaction rate constants that are fitted to the data or extracted from the literature, and describe the time evolution in the extracellular medium, intracellular cytoplasm and nucleus of the measured molecular species. For single cell measurements where cell to cell variability is important, the above mathematical description is no longer appropriate, and needs to be replaced by a probabilistic description for which one commonly uses an algorithm proposed by Gillespie [9]. As paracrine signaling plays an important part in propagating and priming cells for infection, we have constructed an agent based model (ABM) of individual cells interacting through interferon secretion and diffusion that allows to study whether only a small subset of infected cells initiates the immune response.
Examples
We present selected examples of our use of computational approaches in the study of dendritic cell responses to virus and computational immunology tool development. Additional examples of the application of all these approaches to immunology can be accessed at tsb.mssm.edu/primeportal.
1) Allelic imbalance in single cell IFNβ measurements (Figure 1)
Fig. 1.

Allelic imbalance (AI) in individual DCs. (A–B) Measurement of IFNB1 AI as a function of total transcript number for individual DCs exposed to NDV at 9 and 10 h. The color changes from green to yellow to red are set as a function of the relative mRNA expression from the two alleles. (C–F) Histogram of percent of cells showing different levels of AI for IFNB1 in single human DCs at 9 and 10 h after infection. (C) Stochastic model simulation at 9h. (D) Stochastic model simulation at 10h. (E) Experimental results at 9h. (F) Experimental results at 10h. Reprinted with permission from Hu et al. Nucleic Acids Research 35: 232–5241, 2007
Taking advantage of an IFNβ polymorphism, we measured IFNβ induction from each allele in individual human DCs infected by the NDV virus [10]. Allelic imbalance, the ratio AI=m1−m2/m1+m2 which is the ratio of the difference over the sum of IFNβ mRNAs measured from the two alleles, is shown in Fig. 1A and B for 9 and 10 hours after infection as a function of log10(m1+m2). In Fig. 1C–F the histogram of AI is shown at 9 and 10 hours after infection, for both model (C–D) and experiment (E–F). In Fig. 1A–B each point represents the AI value of one cell. Several things are clear from the data. There is an enormous cell-to-cell variability. The total number of transcripts varies over three orders of magnitude, shown in a later study to correspond to a power law distribution with an exponent less than 1 [11]. Moreover for a large number of cells, allelic imbalance is close to a 100%, which means that in these cells IFNβ induction is predominantly monoallelic [12]. This effect is damped as time increases after infection, as is also evident from a comparison of the two experimental histograms of AI, namely as time increases a decrease of the number of cells at high AI in favor of an accumulation around low AI. The model wherein individual cells are followed in time fits the experimental data qualitatively. The high values of AI in many cells indicate that intrinsic stochasticity is important [13], since the difference m1−m2 is not sensitive to any extrinsic randomness such a cell-to-cell variability in the number of signaling molecules. Therefore in the model, transcriptional noise is deemed to be responsible for the observed allelic imbalance. This noise is attributed to the formation of the enhanceosome complex necessary for IFNβ induction. The enhanceosome complex formation requires the cooperative binding of three activator proteins, and the presence of an architectural protein accompanied by chromatin remodeling. The binding of the complete enhanceosome is like a random walk on each allele that sometimes reaches completion but often moves away from it rather than towards it. This model later on was augmented by transcriptional bursting to account for the power law behavior mentioned above [11].
The preceding stochastic model has been extended to include Jak/Stat pathway activation, and study the effect of different types of cell heterogeneity on IFN production [14].
2) Signaling network for IFNβ pretreated and PR8 infected human DC (Figures 2 and 3)
Fig. 2.

Induction of IFNs after virus infection in IFN-β pretreated human DCs. IFN-β, after binding to IFNAR, engages the JAK/STAT pathway, leading to STAT phosphorylation and production of IRF7 and SOCS. The latter acts back negatively on JAK/STAT pathway activation. Viral infection is detected by RIG-I and leads via IRF7 activation to induction and secretion of IFN-β/α, which bind to IFNAR in a positive feedback loop. Protein tyrosine phosphatases (PTPs) act in the cytoplasm and nucleus.
Fig. 3.

Experiment and simulation of IFN-pretreated DC response to influenza PR8 virus infection. The experimental time course data points are marked by x and connected with dashed lines after normalization with respect to the corresponding maximum for each species in (A) nuclear protein, (B–E) mRNA, and (F) secreted protein. The horizontal axis is labeled with time of measurement (in hours). The simulation result is plotted with solid lines and normalized to the corresponding maximum. The temporal response of each species is divided into three stages according to the change in extracellular IFN level, separated by vertical lines. Pretreatment time extends from t = −3 to t = 0 h. Viral infection (PR8) takes place at t = 0 h. Reprinted with permission from Qiao et al. Biophys. J. 98:505–14, 2010
Our model of the typical cell consists of a set of ODEs for the temporal development of the measured species, whether levels of gene expression, measured through PCR, or protein abundance, measured through multiplex ELISA [15]. The corresponding network is shown in Fig. 2. It is based on the immunological literature and encompasses all the measured components. The methodology consists in limiting model components as much as possible to measured ones so as to reduce the number of unknowns and avoid the creation of a large parameter space that could code for many different behaviors. Here our model consists of eight species. There are 19 parameters, out of which only the five most sensitive ones are varied to fit the data, the others being fixed at values found in the literature. The model has three compartments, extracellular space, cytoplasm and nucleus, with IFNβ pretreatment activating the Jak/Stat pathway, with the positive IFN feedback loop after viral infection, and the negative feedback associated with SOCS. Data and simulation results are in Fig. 3. These figures tell a detailed story about the temporal development of the immune response after three hours of IFNβ pretreatment followed by infection. For example, IRF7 mRNA, which is induced in the Jak/Stat pathway, increases rapidly once pretreatment starts (−3 to −2 hours in the figure), then levels off. When pretreatment stops at time t=0, it degrades. It decays to about half its value during 2 hours which tells us that its half-life is about 2 hours. Thereafter it increases again strongly as the positive IFN feedback kicks in, as is confirmed by the bottom figures in Fig. 3, which show the increase of IFNα, both mRNA and protein, and IFNβ 2 hours after infection. We used our model to predict at what level of strength and duration pretreatment achieves 80% of its maximum antiviral effect, and also to mimic the biological in tissue situation where priming of cells through environmental cytokines such as IFNβ is not turned off when viral infection starts.
By including the immune response antagonistic actions of viral proteins in the model, as we did with Nipah protein NDV chimeras [16], the above model can be extended to investigate influenza A viral infections of dendritic cells, and predict the varied ways these impact immune response according to how viral protein interferes with the cell’s reaction to virus intrusion.
3) Transcription regulatory network for infection of human DCs with NDV (Figures 4 and 5)
Fig. 4.

Heatmap showing the over-representation of targets associated with each of the TRANSFAC matrices in the network (rows) over time (columns). The colors are row normalized -log(P values). Darker red indicates greater inferred activity of the transcription factor(s). The temporal activity window of each TF matrix (●--- *) was inferred from the union of the activity of all the individual TFs represented by that matrix.
Fig. 5.

Each node represents a transcription factor with inferred activity in the anti-NDV response. Edges connect regulators to targets so that arrow-tails indicate up-regulation of the regulator, while arrow-heads indicate activity of the regulator on the target. Regulatory relationships can be either feed-forward (green links), feed-back (red links) or reciprocal (black links). Time in the figure progresses vertically down, with nodes placed in the time-slice during which the gene is first differentially expressed. Node color reflects importance measured by number of outgoing links to all gene targets (i.e., total number of genes, not just TF), with darker color corresponding to more highly connected nodes. Rectangular nodes indicate TFs with no predicted regulators. Reprinted from Zaslavsky et al. J Immunol. 184: 2908–17, 2010 with permission.
We developed and validated by experiment a new approach (TIDAL) that integrates genome-wide expression kinetics and time-dependent promoter analysis [8]. Our method infers the TFs driving initial gene expression changes, determines the timing of their activity and identifies a causal chain of regulation. We have applied this approach to the anti-NDV response in human DCs to deduce the causality and coherence of the transcriptional events responsible for the complex gene regulation elicited by virus infection. To identify the regulatory cascade underlying this tightly controlled system, we first focused on the events occurring at distinct time-points in the course of the infection, identifying and analyzing sets of genes that were first up-regulated at each microarray sampling time point (i.e., 1, 2, 4, 6, 8, 10, 12, 14, 16, and 18 h post-infection, see Fig. 4). We next inferred the transcription factors (TFs) involved in regulating these sets of genes by testing for statistical enrichment among their putative regulatory targets. Identifying the different time points during which their targets were overrepresented, we generated a temporal enrichment profile for each transcription factor. As seen in Fig. 4, we observed multiple temporal phases in the response, each driven by distinct groups of TFs. In agreement with many previous studies of the innate antiviral response [17], IRF and STAT-based activation was evident in the initial wave of transcriptional up-regulation. The middle phase of the response was driven by a variety of TFs, many of which have not been previously implicated in antiviral responses. Furthermore, we experimentally validated sustained virus-inducible binding for one such novel transcription factor, ALX1.
Connecting the temporal TF profiles into a coherent higher-level cascade, we found a single convergent regulatory network that spans virtually the entire time period analyzed (Fig. 5). The network contains both feed-forward links, which propagate the transcriptional signal through time, as well as feedback links, where TFs may influence the activity of targets that have previously been up-regulated. Through the combination of computational and experimental validation we concluded that our network was effective in capturing the underlying biology and produced a pattern that is consistent with stepwise transcriptional signal propagation.
4) Inferring Functional Signaling Networks from Early Gene Expression Measurements (Figure 6)
Fig. 6.
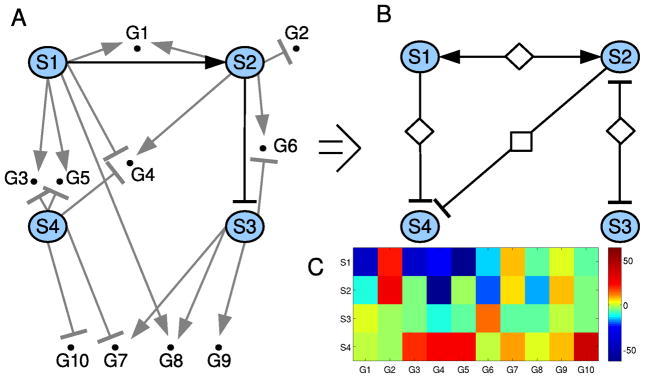
Interaction network. A. The biochemical interaction network for the synthetic network, including the four signaling components (S1–S4), and the 10 early genes they affect (G1–G10); B. The network of functional interactions between the four signaling components in the synthetic network, as inferred by PLACA. The inferred functional interactions convey the correct biochemical network; C. The heat map of the change in gene activity in all genes (X axis), as obtained from a set of simulations where each signaling component (Y axis) was perturbed. The heat map reveals which genes were involved in inferring each functional interaction. Reprinted from Shimoni et al. PLoS Comput Biol, 6:e1000828, 2010
We developed an algorithm (PLACA) that uses changes in the level of early gene induction in order to estimate the activity of unmeasured upstream signaling components, and then infer the functional interactions between the signaling components [18]. The algorithm is useful for translating recent advances in technology that utilize high throughput measurement of gene activity into novel insights of cellular network design and signal processing. The algorithm is made possible by two observations: (a) genes induced without de-novo protein synthesis (early genes) show a linear accumulation of product in the first hour after the change in the cell’s state; (b) The signaling components in the network largely function in the linear range of their stimulus-response curves. Therefore, expression profiles of early genes at an early time point provide direct biochemical assays that represent the activity levels of upstream signaling components.
PLACA’s methodology relies on availability of data from a series of perturbation experiments. These measure the mean activity and the standard deviation of the activity of all early genes predicted or known to be affected by the signaling components of interest both under normal conditions, and following perturbation of each signaling component. To reverse-engineer the network, a weight matrix describing the connections between genes and signaling components is calculated, and used to obtain an estimate of the change in activity of each signaling components following each perturbation. The estimated change in activity is used to infer the interactions between the signaling components by applying a reverse engineering method [19].
PLACA was used to reverse engineer a functional network in the context of an experimental system (see [18], the gonadotrope signaling network). Here we show an example network inferred from early gene expression and perturbation experiments generated by a simulation using an arbitrary network model (Fig. 6). Overall, the functional reverse-engineered network shows high similarity to the model that produced the early gene expression data, and is robust to experimental noise.
5) Misty Mountain clustering: application to fast unsupervised flow cytometry gating
To analyze multi-dimensional flow cytometry data we developed a new, unsupervised density contour clustering algorithm, called Misty Mountain [20], that is based on percolation theory and that efficiently analyzes large data sets. The approach can be envisioned as a progressive top-down removal of clouds covering a data histogram relief map to identify clusters by the appearance of statistically distinct peaks and ridges. This is a parallel clustering method that finds every cluster after analyzing the cross sections of the histogram only once. Comparison of the performance of this algorithm with other state of the art automated flow cytometry gating methods indicate that Misty Mountain provides substantial improvements in both run time and in the accuracy of cluster assignment.
When analyzing a flow cytometry dataset containing 9549 points representing the side scattering and forward scattering measurements obtained from U937 macrophage cells (Fig. 7a), we compared the performance of Misty Mountain to other state-of-the-art methods. An expert in flow cytometry would interpret the large oval group as representing intact cells and would form a gate to separate these cells for further analysis from cellular debris. Both K-median and spectral clustering algorithms gave similar erroneous results (Fig. 7b). The result of the cluster analysis by the Misty Mountain algorithm is shown in Fig. 7c. These clusters contain 95.7% of all the data points, which are assigned at high confidence. Overall, when applied to multiple multi-dimensional data sets, we find that Misty Mountain is fast, unbiased for cluster shape, identifies stable clusters and is robust to noise.
Fig. 7.

Side scattering and forward scattering of U937 cells. a) Experimental data. Side scattering is plotted against forward scattering. b) Result of cluster analysis by using the K-median clustering and spectral clustering with assuming 2 centers. c) Result of the cluster analysis by using the Misty Mountain method. The data points assigned to the two clusters are marked by red and blue symbols. Reprinted from Sugar and Sealfon. BMC Bioinformatics. 11:502, 2010
Conclusions
The examples described above represent uses of modeling and computational approaches to extend the value of experimental data. The next stage in the evolution of these approaches is to embed these computational approaches within software and web tools that are easily accessible to the general immunology research community. This process is well underway and should make the computational techniques available to researchers who do not have special training in these areas.
References
- 1.Honda K, Sakaguchi S, Nakajima C, Watanabe A, Yanai H, et al. Selective contribution of IFN-α/β signaling to the maturation of dendritic cells induced by double-stranded RNA or viral infection. Proceedings of the National Academy of Sciences of the United States of America. 2003;100:10872–10877. doi: 10.1073/pnas.1934678100. [DOI] [PMC free article] [PubMed] [Google Scholar]
- 2.Park M-S, Shaw ML, Munoz-Jordan J, Cros JF, Nakaya T, et al. Newcastle Disease Virus (NDV)-Based Assay Demonstrates Interferon-Antagonist Activity for the NDV V Protein and the Nipah Virus V, W, and C Proteins. J Virol. 2003;77:1501–1511. doi: 10.1128/JVI.77.2.1501-1511.2003. [DOI] [PMC free article] [PubMed] [Google Scholar]
- 3.García-Sastre A. Induction and evasion of type I interferon responses by influenza viruses. Virus Res. 2011;162:12–18. doi: 10.1016/j.virusres.2011.10.017. [DOI] [PMC free article] [PubMed] [Google Scholar]
- 4.Rao CV, Wolf DM, Arkin AP. Control, exploitation and tolerance of intracellular noise. Nature. 2002;420:231–237. doi: 10.1038/nature01258. [DOI] [PubMed] [Google Scholar]
- 5.Eldar A, Elowitz MB. Functional roles for noise in genetic circuits. Nature. 2010;467:167–173. doi: 10.1038/nature09326. [DOI] [PMC free article] [PubMed] [Google Scholar]
- 6.Ferrell JE, Machleder EM. The biochemical basis of an all-or-none cell fate switch in Xenopus oocytes. Science. 1998;280:895–898. doi: 10.1126/science.280.5365.895. [DOI] [PubMed] [Google Scholar]
- 7.Hayot F. Simulations of stochastic biological phenomena. Sci Signal. 2011;4:tr13. doi: 10.1126/scisignal.2001973. [DOI] [PMC free article] [PubMed] [Google Scholar]
- 8.Zaslavsky E, Hershberg U, Seto J, Pham A, Marquez S, et al. Antiviral response dictated by choreographed cascade of transcription factors. J Immunol. 2010;184:2908–2917. doi: 10.4049/jimmunol.0903453. [DOI] [PMC free article] [PubMed] [Google Scholar]
- 9.Gillespie DT. Exact stochastic simulation of coupled chemical-reactions. J Phys Chem. 1977:2340–2361. [Google Scholar]
- 10.Hu J, Sealfon SC, Hayot F, Jayaprakash C, Kumar M, et al. Chromosome-specific and noisy IFNB1 transcription in individual virus-infected human primary dendritic cells. Nucleic Acids Res. 2007;35:5232–5241. doi: 10.1093/nar/gkm557. [DOI] [PMC free article] [PubMed] [Google Scholar]
- 11.Hu J, Iyer-Biswas S, Sealfon SC, Wetmur J, Jayaprakash C, et al. Power-laws in interferon-B mRNA distribution in virus-infected dendritic cells. Biophys J. 2009;97:1984–1989. doi: 10.1016/j.bpj.2009.05.067. [DOI] [PMC free article] [PubMed] [Google Scholar]
- 12.Apostolou E, Thanos D. Virus Infection Induces NF-kappaB-dependent interchromosomal associations mediating monoallelic IFN-beta gene expression. Cell. 2008;134:85–96. doi: 10.1016/j.cell.2008.05.052. [DOI] [PubMed] [Google Scholar]
- 13.Thattai M, van Oudenaarden A. Intrinsic noise in gene regulatory networks. Proc Natl Acad Sci U S A. 2001;98:8614–8619. doi: 10.1073/pnas.151588598. [DOI] [PMC free article] [PubMed] [Google Scholar]
- 14.Hu J, Nudelman G, Shimoni Y, Kumar M, Ding Y, et al. Role of cell-to-cell variability in activating a positive feedback antiviral response in human dendritic cells. PLoS One. 2011;6:e16614. doi: 10.1371/journal.pone.0016614. [DOI] [PMC free article] [PubMed] [Google Scholar]
- 15.Qiao L, Phipps-Yonas H, Hartmann B, Moran TM, Sealfon SC, et al. Immune response modeling of interferon beta-pretreated influenza virus-infected human dendritic cells. Biophys J. 2010;98:505–514. doi: 10.1016/j.bpj.2009.10.049. [DOI] [PMC free article] [PubMed] [Google Scholar]
- 16.Seto J, Qiao L, Guenzel CA, Xiao S, Shaw ML, et al. Novel Nipah virus immune-antagonism strategy revealed by experimental and computational study. J Virol. 2010;84:10965–10973. doi: 10.1128/JVI.01335-10. [DOI] [PMC free article] [PubMed] [Google Scholar]
- 17.Haller O, Kochs G, Weber F. The interferon response circuit: Induction and suppression by pathogenic viruses. Virology. 2006;344:119–130. doi: 10.1016/j.virol.2005.09.024. [DOI] [PMC free article] [PubMed] [Google Scholar]
- 18.Shimoni Y, Fink MY, Choi SG, Sealfon SC. Plato’s cave algorithm: inferring functional signaling networks from early gene expression shadows. PLoS Comput Biol. 2010;6:e1000828. doi: 10.1371/journal.pcbi.1000828. [DOI] [PMC free article] [PubMed] [Google Scholar]
- 19.Bruggeman FJ, Westerhoff HV, Hoek JB, Kholodenko BN. Modular response analysis of cellular regulatory networks. J Theor Biol. 2002;218:507–520. [PubMed] [Google Scholar]
- 20.Sugár IP, Sealfon SC. Misty Mountain clustering: application to fast unsupervised flow cytometry gating. BMC Bioinformatics. 2010;11:502. doi: 10.1186/1471-2105-11-502. [DOI] [PMC free article] [PubMed] [Google Scholar]