

Abstract
Background
Despite the concern that sleep apnea (SA) is associated with increased risk for postoperative complications, a paucity of information is available regarding the effect of this disease on postoperative complications and resource utilization in the orthopedic population. With an increasing number of surgical patients suffering from SA, this information is of high importance to physicians, patients, policymakers and administrators alike.
Methods
We analyzed hospital discharge data of patients who underwent total hip or knee arthroplasty (THA, TKA) in approximately 400 United States hospitals between 2006 and 2010. Patient, procedure, and healthcare-system related demographics and outcomes such as mortality, complications, and resource utilization were compared amongst groups. Multivariable logistic regression models were fit to assess the association between SA and various outcomes.
Results
We identified 530,089 entries for patients undergoing THA and TKA. Of those, 8.4% had a diagnosis code for SA. In the multivariate analysis, the diagnosis of SA emerged as independent risk factor for major postoperative complications (OR 1.47 (95% CI 1.39;1.55)). Pulmonary complications were 1.86 (95% CI 1.65; 2.09) times more likely and cardiac complications 1.59 (95% CI 1.48; 1.71) times more likely to occur in patients with SA. In addition, SA patients were more likely to require ventilatory support, utilize more intensive care, step-down and telemetry services, consume more economic resources, and require increased lengths of hospitalization.
Conclusions
The presence of SA represents a major clinical and economic challenge in the postoperative period. More research is needed to identify SA patients at risk for complications and develop evidence-based practices in order to aid in the allocation of clinical and economic resources.
Introduction
The presence of sleep apnea (SA) represents a major challenge in the postoperative period. As many as one fourth of patients undergoing elective surgery may be affected 1. The prevalence among orthopedic patients undergoing joint arthroplasty may be especially high, given that obesity is a wide-spread comorbidity in this patient population 2. Despite the increasing amount of concern that SA is associated with increased risk for postoperative complications 2-7, there remains a paucity of population based information available in the literature regarding postoperative outcomes. Most available data represent results from relatively small samples and academic institutions, thus limiting external validity and applicability. Large-scale observational studies, using secondary administrative databases, are increasingly being performed, as they provide more robust information on the impact of specific diseases in a more representative care setting.
Given the combination of high prevalence of SA among orthopedic surgery patients 2 and the projection that by 2030 more than 4 million hip and knee arthroplasties will be performed in the United States alone 8, the joint replacement population represents an especially important group of patients in need of further investigation.
Despite some data suggesting increased risk for postoperative pulmonary complications associated with SA among orthopedic patients 2, more detailed analysis of other important outcomes such as utilization of economic resources remains largely unexplored. Such information is of high importance in order to assess and gain better insights into the clinical and economic impact of SA in patients undergoing surgery.
Therefore, we analyzed data on over 500,000 patients from approximately 400 institutions. We hypothesized that hip and knee arthroplasty patients with SA were at greater risk for experiencing postoperative complications and consumed greater hospital resources, as represented by increased risk for a longer length of hospital stay and greater use of economic resources.
Materials and Methods
Database and Study Design
For this study, data from Premier Perspective, Inc.’s (Charlotte, North Carolina) collected between 2006 and 2010 were used. This retrospective administrative database contains discharge information from approximately 400 hospitals 9,10 and is compliant with the Health Insurance Portability and Accountability Act. Because data are de-identified, the study was exempt from review by the Hospital for Special Surgery Institutional Review Board. Before distribution, rigorous quality assurance and data validation procedures are employed by the provider to assure the accuracy of entries. This database has previously been used for other studies by our group 11,12.
Study Population
The study population consisted of all patients in the Premier Perspective database undergoing primary hip and knee arthroplasty (THA, TKA), as identified by International Classification of Diseases-9th revision-Clinical Modification codes (ICD-9-CM) 81.51 and 81.54, respectively.
Study Variables
The presence of SA was determined by the presence of respective ICD-9 codes Appendix 1 lists specific diagnosis codes included and their individual prevalence.
Patient, procedure, and healthcare related characteristics analyzed were age, sex, race (White, Black, Hispanic, other), admission type (emergent, elective, other), hospital size (<300, 300-499, ≥ 500 beds), hospital location (urban, rural), hospital teaching status, anesthesia type (general, neuraxial, neuraxial-general, unknown), indication for surgery (osteoarthritis, rheumatoid arthritis, other), type of surgery (THA, TKA), year of surgery, and comorbidity prevalence (myocardial infarction (MI), cerebrovascular disease, peripheral vascular disease, renal disease, chronic obstructive pulmonary disease (COPD), uncomplicated and complicated diabetes mellitus, uncomplicated and complicated systemic hypertension, (“complicated” as defined by the absence or presence of disease related end organ complications), cancer, obesity, and pulmonary hypertension). Overall comorbidity burden was assessed with the Deyo adaptation of the Charlson comorbidity index method for use with administrative data for surgical outcomes 13. In brief, the Deyo Index is comprised of the presence of a number of comorbidities. Each comorbidity is assigned a severity weight and its presence contributes to an overall score. A higher score correlates with increased risk of adverse outcomes.
Individual major postoperative complications studied were pulmonary embolism, deep venous thrombosis, cerebrovascular event, pulmonary complications, sepsis, cardiac complications (excluding MI), MI, pneumonia (including ventilator-associated pneumonia and aspiration pneumonitis), infectious complications, acute renal failure, gastrointestinal complications, and mortality. In order to evaluate these major complications, a combined outcome variable (“combined complications”) was created to indicate having at least one of the complications listed above. A case with “pulmonary complications” had at least one indication of pulmonary compromise, pneumonia, or pulmonary embolism. For “cardiac complications,” cases had an indication of cardiac complications (except MI) or MI.
In addition, utilization of critical care, step down and telemetry services (each defined by specific billing records for these services representing distinctly different levels of care), blood transfusions, postoperative mechanical ventilation, and non-invasive ventilation were studied. Utilization of economic resources in US dollars and length of hospitalization were compared as continuous variables. Due to their skewed distributions, they were also dichotomized such that entries exceeding the 75th percentile were defined as increased length of hospitalization or increased use of economic resources, respectively. This approach was used by our group in various other publications 11,12. Further, using this cutoff was not influenced by the length of hospitalization or patient costs of SA patients. To account for potential bias in choosing a cutoff for dichotomization, sensitivity analyses using cutoffs ranging from 50% to 90% were performed in the univariable analysis, and similar results were found. ICD-9 CM codes and billing data provided by the Premier database were used to define the presence of comorbidities, complications, and other outcomes and are listed in Appendix 2.
Statistical analysis
The primary goal of our analysis was to compare different outcomes between patients with and without SA. All statistical analyses were performed using SAS version 9.3 (SAS Institute, Cary, NC).
Patient- and Healthcare Related Characteristics by Presence of SA
Groups with and without SA diagnosis were compared with regard to patient and healthcare related characteristics in the univariable analysis. Means (standard deviation (SD)) and percentages were described for continuous and categorical variables, respectively. Length of stay and economic resource utilization exhibited a skewed distribution and were presented using median and interquartile ranges (IQR). Due to the large sample size, a significant difference of p-values (<0.05) for differences between two groups using traditional t-tests, Wilcoxon Ranked Sum tests, or Chi-Square tests were very likely to be detected, but may not be clinically meaningful. Therefore, standardized difference (STD) was calculated to measure group balance 14. A standardized difference less than 0.1 for a continuous and 10% for a categorical variable indicated a negligible difference in the mean or proportion of a variable between groups 15. Due to the large sample size, the standard errors of STDs were very small; therefore, and to support clarity of presentation they were not shown. Percentage of missing data was reported for all study variables, stratified by presence of a SA diagnosis.
Logistic Regression Analyses
Univariable and multivariable logistic regression analyses were performed to evaluate the association between patients with and without SA. Separate models were fitted for the binary outcomes: combined complications, pulmonary complications, cardiac complications, mortality, mechanical ventilation, non-invasive ventilation, use of blood product transfusion, intensive care utilization, stepdown/telemetry service utilization, increased length of hospitalization and increased economic resource utilization. Covariates included for controlling purposes comprised age, gender, race, admission type, hospital size, hospital teaching status, hospital location, anesthesia type, indication for surgery, type of surgery, year of surgery, and individual comorbidities. The association between each covariate and outcome variable was performed by univariable analysis. Almost all associations had p-values < 0.05 and were entered into the multivariable model. Few covariates (e.g. gender and hospital characteristic) had p > 0.05 for the outcomes of mortality, and cardiac complication, but were included in the model due to the consensus that they were of clinical importance 16.
In addition to main effects described above, we evaluated the interaction terms of SA with age, gender, year, COPD, diabetes, obesity, hypertension and complicated hypertension for each of the outcomes. These interaction terms were selected based on (1) clinical relevance; (2) STD>10% between SA vs. non-SA status; and (3) sufficient frequency (>5% prevalence of comorbidities in SA) in order to achieve adequate power and obtain valid estimates. All interaction effects were included in each model, and a backward approach was used for testing the significance of interaction effects while keeping all main effects in the model. The significance of interaction effects was measured using a p-value of 0.004 (Bonferroni-corrected p-value=0.05/11 outcomes 17) to adjust for multiple outcomes. If an interaction effect had a p-value < 0.004, but the corresponding coefficient was very small (e.g. <0.001), we considered it quantitatively unimportant and removed it from the model. For models with significant interaction terms, the interpretation of SA effect would be conditioned on the terms interacted with.
Missing data was excluded from analyses, but since 27.6% of cases had “unknown” anesthesia, it was treated as a separate category and modeled as a sensitivity analysis.
Crude and adjusted odds ratios (OR), Bonferroni-corrected 95% confidence intervals (CI) and p-values were reported due to multiple comparisons. Two-sided p-value<0.05 (conventional threshold of significance) was used to determine significance of variables. 95% CIs of estimates were reported to enable readers to interpret the significance of the findings; this was done to alleviate the potentially undue effect a very large sample size might have on the p-values.
Diagnostic of Models
In order to evaluate independence of individual predictor variables, the Value Inflation Factor (VIF) was calculated for each predictor variable to determine whether multicolinearity was present. The final models were validated using the Hosmer-Lemeshow (H-L) test 18. It evaluated adequate calibration of a logistic regression model, so that the probability predictions from the model reflected the true occurrence of events in the data. The area under the receiver-operating characteristic curve 19 (c-statistic) was utilized to measure the level of model discrimination between observed data at different levels of the outcome. Discrimination was classified as perfect, excellent, very good, good, moderate, and poor if the AUCs, were 1.0, 0.9 to 0.99, 0.8 to 0.89, 0.7 to 0.79, 0.6 to 0.69, or <0.6, respectively 20. Statistical analyses were performed using SAS software version 9.3 (SAS Institute, Cary, NC).
Sensitivity Analysis Based on Propensity Score Matching
The odds ratio from a matched sample using the propensity score method was performed as a sensitivity of the results to different statistical approaches. All covariates used in the primary analysis above were included in the multivariable logistic regression with the outcome variable of SA versus non-SA to calculate propensity scores. One SA patient (case) was matched with three non-SA patients (controls) for statistical efficiency 21. The matched pairs were generated by comparing the predicted propensity scores between cases and controls using the SAS macro % one to many match with 8 to 1 digit match without replacement 22. Based on the matched sample, the effect of SA on outcomes was tested for significance using the Cochran-Mantel-Haenszel (CMH) test. To account for matching samples, common odds ratio (COR), an overall odds ratio across pairs of matching samples, and Bonferroni corrected 95% confidence intervals were estimated. For comparison purposes, multivariable models with main effects only were performed and reported.
Results
Characterization by Presence of SA
We identified 530,089 entries for patients undergoing THA and TKA between 2006 and 2010. Overall, 8.4% had a diagnosis code for SA. The prevalence of SA increased from 6.1% in 2006 to 10.3% in 2010 (Fig 1). Compared to non-SA patients, individuals with SA were on average younger (SA: 63.4±9.6 years vs. non-SA: 66.2±11.3 years, STD=26.7%), more frequently male (53.9% vs. 37.3%, STD=33.63%), carried a higher overall Deyo comorbidity burden (1.00±1.12 vs. 0.59±0.92, STD=40.1%) and had a higher prevalence of most individual comorbidities (Table 1, Table 2). Amongst SA patients, 42.3% carried a diagnosis of obesity and 29.3% that of diabetes (complicated and uncomplicated), compared to only 15.6% and 16.4%, respectively, in the group with no diagnosis of SA (STD=61.7% for obesity; STD=31.3% for diabetes). Missing data were limited to the categories of anesthesia type, race, admission type and payor type (28.7%, 19.4%, 0.3%, 2.8% respectively).
Figure 1.
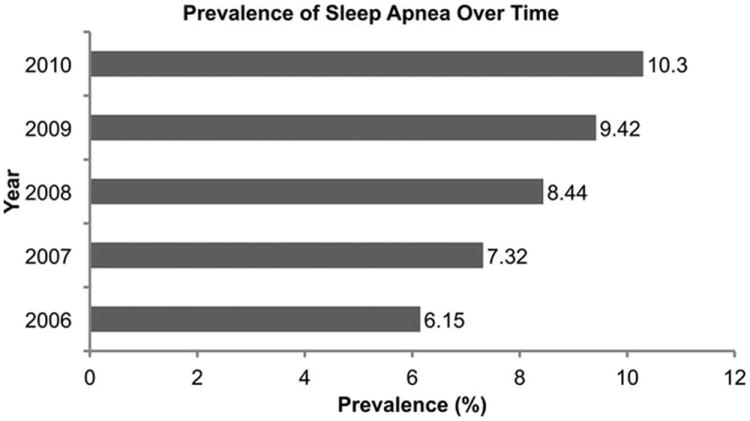
Figure 1 displays the prevalence of sleep apnea over time.
Table 1. Patient and Healthcare System Related Characteristics.
Patient and healthcare system related variables for patients without and with diagnosis of sleep apnea.
| No SA Diagnosis | SA Diagnosis | ||||
|---|---|---|---|---|---|
|
| |||||
| N | 485,843 | 44246 | |||
|
| |||||
| % | 91.6% | 8.4% | |||
|
| |||||
|
Year of Procedure
b
| |||||
| N | % | N | % | STD (%) | |
|
| |||||
| 2006 | 91,731 | 18.9 | 6,007 | 13.6 | 14.42 |
|
| |||||
| 2007 | 97,545 | 20.1 | 7,709 | 17.4 | 6.80 |
|
| |||||
| 2008 | 102,177 | 21.0 | 9,419 | 21.3 | 0.63 |
|
| |||||
| 2009 | 111,892 | 23.0 | 11,640 | 26.3 | 7.61 |
|
| |||||
| 2010 | 82,498 | 17.0 | 9,471 | 21.4 | 11.25 |
|
| |||||
|
Type of Procedure
b
| |||||
| THA | 162,011 | 33.3 | 10,939 | 24.7 | 19.08 |
|
| |||||
| TKA | 323,832 | 66.7 | 33,307 | 75.3 | |
|
| |||||
|
Type of Anesthesia
| |||||
| N | 36,702 | 7.6 | 3,332 | 7.5 | 0.09 |
|
| |||||
| G | 269,495 | 55.5 | 24,798 | 56.0 | 1.16 |
|
| |||||
| N+G | 44,762 | 9.2 | 4,659 | 10.5 | 4.41 |
|
| |||||
| Unknown | 134,884 | 27.8 | 11,457 | 25.9 | 4.22 |
|
| |||||
|
Deyo Index Category
a,b
| |||||
| 0 | 315,316 | 64.9 | 20,662 | 46.7 | 37.28 |
|
| |||||
| 1 | 80,419 | 16.6 | 8,894 | 20.1 | 9.18 |
|
| |||||
| 2 | 68,275 | 14.1 | 9,531 | 21.5 | 19.67 |
|
| |||||
| > 3 | 21,833 | 4.5 | 5,159 | 11.7 | 26.53 |
|
| |||||
| Average Deyo Index a,b (SD, range) | 0.59 (0.92, 0-10) | 1.00 (1.12, 0-8) | 40.11 | ||
|
| |||||
| Average Age (Year) b (SD) | 66.16 (11.32) | 63.36 (9.56) | 26.72 | ||
|
| |||||
|
Gender
b
| |||||
| Female | 304,459 | 62.7 | 20,419 | 46.1 | 33.63 |
|
| |||||
| Male | 181384 | 37.3 | 23,827 | 53.9 | |
|
| |||||
|
Race
| |||||
| White | 360840 | 74.3 | 34,231 | 77.4 | 7.23 |
|
| |||||
| Black | 32844 | 6.8 | 3,353 | 7.6 | 3.17 |
|
| |||||
| Hispanic | 11191 | 2.3 | 741 | 1.7 | 4.50 |
|
| |||||
| Other | 80968 | 16.7 | 5,921 | 13.4 | 9.20 |
|
| |||||
|
Admission Type
| |||||
| Emergent | 11,430 | 2.4 | 978 | 2.2 | 0.95 |
|
| |||||
| Urgent | 19,433 | 4.0 | 1,821 | 4.1 | 0.59 |
|
| |||||
| Elective | 453,700 | 93.4 | 41,373 | 93.5 | 0.50 |
|
| |||||
| Other | 1,280 | 0.3 | 74 | 0.2 | 2.08 |
|
| |||||
|
Hospital Size (No of Beds)
| |||||
| < 299 | 158,567 | 32.6 | 12,991 | 29.4 | 7.09 |
|
| |||||
| 300-499 | 189,123 | 38.9 | 19,102 | 43.2 | 8.64 |
|
| |||||
| > 500 | 138,153 | 28.4 | 12,153 | 27.5 | 2.16 |
|
| |||||
|
Hospital Location
| |||||
| Rural | 49,240 | 10.1 | 4,203 | 9.5 | 2.14 |
|
| |||||
| Urban | 436,603 | 89.9 | 40,043 | 90.5 | |
|
| |||||
|
Hospital Teaching Status
| |||||
| Non-Teaching | 286,759 | 59.0 | 24,537 | 55.5 | 7.21 |
|
| |||||
| Teaching | 199,084 | 41.0 | 19,709 | 44.5 | |
|
| |||||
|
Indication
| |||||
| RA | 15,980 | 3.3 | 1,217 | 2.8 | 3.15 |
|
| |||||
| OA | 451,184 | 92.9 | 41,984 | 94.9 | 8.44 |
|
| |||||
| Other | 18,679 | 3.8 | 1,045 | 2.4 | 8.56 |
(SA = sleep apnea; STD = Standardized Difference; SD = Standard Deviation; THA = total hip arthroplasty; TKA = total knee arthroplasty; OA = osteoarthritis; RA = rheumatoid arthritis).
The Deyo Index was validated for the outcomes of complications, mortality, blood transfusion, use of hospital resources, and other adverse events on a cohort of surgical patients 13. (Deyo Index = 1 *Myocardial Infarction + 1 *Cerebrovascular Disease + 1 *Peripheral Vascular Disease + 2 *Renal Disease + 1 *COPD + 1 *Diabetes + 2*Complicated Diabetes + 1 *Dementia + 1*Rheumatoid Disease +1 * Mild Liver Disease + 1*Severe Liver Disease + 6 *AIDS + 1 *Plegia + 1 *Cancer)
Variables met the standardized difference > 10% threshold
Table 2. Prevalence of Comorbidities.
Prevalence of pre-existing comorbidities for patients without and with diagnosis of sleep apnea
| No SA Diagnosis | SA Diagnosis | ||||
|---|---|---|---|---|---|
| Comorbidity | N | % | N | % | STD (%) |
| Myocardial Infarction | 17,069 | 3.5 | 2,433 | 5.5 | 9.58 |
| Cerebrovascular Disease | 1,136 | 0.2 | 98 | 0.2 | 0.26 |
| Peripheral Vascular Disease | 8,187 | 1.7 | 1,057 | 2.4 | 4.98 |
| Renal Disease | 243 | 0.1 | 23 | 0.1 | 0.09 |
| COPDa | 64,816 | 13.3 | 11,051 | 25.0 | 29.89 |
| Diabetesa | 79,444 | 16.4 | 12,980 | 29.3 | 31.30 |
| Complicated Diabetesa | 4,610 | 0.9 | 1,108 | 2.5 | 11.96 |
| Cancer | 8,556 | 1.8 | 782 | 1.8 | 0.05 |
| Obesitya | 75,644 | 15.6 | 18,708 | 42.3 | 61.65 |
| Hypertensiona | 293,277 | 60.4 | 30,862 | 69.8 | 19.78 |
| Complicated Hypertensiona | 17,576 | 3.6 | 2,764 | 6.2 | 12.16 |
| Pulmonary Hypertensiona | 2,476 | 0.5 | 765 | 1.7 | 11.61 |
(SA = sleep apnea; STD = Standardized Difference; COPD = chronic obstructive pulmonary disease).
Variables met the standardized difference > 10% threshold
SA patients exhibited a higher incidence of major postoperative complications including pulmonary, cardiac (non-MI), and renal outcomes. Analysis of the various subtypes of pneumonia yielded a higher incidence of post-procedural aspiration pneumonia and/or Mendelson’s syndrome (as defined by ICD9 code 997.39) in the SA group, compared to the no SA-group (0.9% vs. 0.6%, p<0.0001). Among patients in the SA group and accounting for overlap, 14.5% required advanced services (critical care (6.0%), telemetry (5.2%) or stepdown unit (5.5%) services) as compared to 8.1% (2.8%, 3.8%, and 2.7%, respectively) in non-SA patients. Table 3 lists complication rates and other outcomes. Postoperative mechanical ventilation and non-invasive ventilatory support was used more frequently among SA patients (4.9% vs. 0.3%, STD=29.0% and 3.8% vs. 0.1%, STD=27.1%). However, postoperative blood transfusions were less frequently used in SA patients (14.5% vs. 19.3%, STD=13.1%). Appendix 3 details the incidence of individual cardiac complications. The data suggests that the higher incidence of atrial fibrillation among SA patients was responsible for the increased rates in this complication category. Moreover, median length of hospitalization was similar among groups (3 [IQR: 3 to 4] days vs. 3 [IQR: 3 to 4] days), STD=5.5%). Economic resource utilization was also similar among SA patients $15,514 [IQR:12,760 to 19,336] vs. $15,005 [IQR:12,314 to 18,677], STD=6.5%).
Table 3. Incidence of Complications.
The incidence of selected outcomes for patients without and with diagnosis of sleep apnea
| No SA diagnosis | SA Diagnosis | |||||
|---|---|---|---|---|---|---|
| Event | N | % | N | % | STD(%) | p-value |
| Pulmonary Embolism | 1,908 | 0.4 | 267 | 0.6 | 2.99 | <0.0001 |
| Deep Venous Thrombosis | 2,665 | 0.5 | 266 | 0.6 | 0.70 | 0.15 |
| Cerebrovascular Accident | 560 | 0.1 | 46 | 0.1 | 0.34 | 0.50 |
| Pulmonary Complications | 2,672 | 0.6 | 839 | 1.9 | 12.27 | <0.0001 |
| Sepsis | 697 | 0.1 | 91 | 0.2 | 1.49 | 0.0011 |
| Cardiac Complications (Non MI) | 29,847 | 6.1 | 4,110 | 9.3 | 11.81 | <0.0001 |
| Pneumonia | 3,987 | 0.8 | 591 | 1.3 | 4.99 | <0.0001 |
| All Infectious Complications | 19,738 | 4.1 | 1,899 | 4.3 | 1.15 | 0.02 |
| Acute Renal Failure | 6,741 | 1.4 | 1,245 | 2.8 | 9.96 | <0.0001 |
| Gastrointestinal Complications | 3,571 | 0.7 | 507 | 1.1 | 4.26 | <0.0001 |
| Acute MI | 1,280 | 0.3 | 114 | 0.3 | 0.11 | 0.82 |
| 30 Day Mortality | 716 | 0.1 | 85 | 0.2 | 0.79 | <0.0001 |
| ICU Utilization | 14,647 | 3.0 | 2,713 | 6.1 | 14.96 | <0.0001 |
| Stepdown and Telemetry Use | 26,847 | 5.5 | 4,108 | 9.3 | 14.39 | <0.0001 |
| Mechanical Ventilation | 1,622 | 0.3 | 2,183 | 4.9 | 29.03 | <0.0001 |
| Non-invasive ventilation | 400 | 0.1 | 1,665 | 3.8 | 27.05 | <0.0001 |
| Transfusion | 93,958 | 19.3 | 6,394 | 14.5 | 13.07 | <0.0001 |
(SA = sleep apnea; STD = Standardized Difference; MI = myocardial infarction)
Logistic Regression Analyses
Tables 4 details the results of the univariable and multivariable logistic regression analysis. Table 5 details the effect of SA for the models with significant interaction modifications.
Table 4. Results from the logistic regression models – SA diagnosis vs. Non-SA diagnosis.
Multivariable regression for various outcomes. Present diagnosis of sleep apnea is the effect variable (CI = confidence interval).
| Outcome | Crude Odds Ratio (Corrected 95% CI) a,b,c | Adjusted Odds Ratio (Corrected 95% CI) a,c | Significant interaction term with SA (p-value d) | C-statistic |
|---|---|---|---|---|
| Combined Complications | 1.53 (1.47, 1.60) | 1.47 (1.39, 1.55) | None | 0.69 |
| Pulmonary Complications | 2.19 (2.00, 2.40) | 1.86 (1.65, 2.09) | None | 0.69 |
| Cardiac Complications | 1.56 (1.48, 1.65) | 1.59 (1.48, 1.71) | None | 0.74 |
| Mortality | 1.27 (0.82, 1.98) | 1.27 (0.74, 2.19) | None | 0.74 |
| Mechanical Ventilation | 11.94 (10.64, 13.40) | See table 5 | Complicated Hypertension (p<0.0001) COPD (p<0.0001) | 0.83 |
| Non-Invasive Ventilation | 37.13 (30.64, 45.00) | See table 5 | Complicated Hypertension (p<0.0001), COPD (p<0.0001) | 0.88 |
| Blood Product Transfusion | 0.71 (0.68, 0.74) | 0.88 (0.83, 0.93) | None | 0.67 |
| ICU Utilization | 2.06 (1.92, 2.21) | See table 5 | Gender (p=0.0002), Year (p=0.0007) | 0.73 |
| Telemetry / Stepdown Unit Utilization | 1.76 (1.66, 1.86) | See table 5 | Year (p=0.0008), Complicated Hypertension(p<0.0001), Obesity (p<0.0001) | 0.68 |
| Length of Stay > 75th percentile | 1.09 (1.05, 1.13) | See table 5 | Obesity (p=0.0006) | 0.65 |
| Utilization of economic resources > 75th percentile | 1.22 (1.18, 1.26) | 1.14 (1.09, 1.19) | None | 0.60 |
Reference = no sleep apnea diagnosis.
All 95% CIs and the associated p-values were both Bonferroni corrected for multiple comparisons
All corrected p-values were <.0001 except for mortality (p>0.99).
All corrected p-values were <.0001 except for mortality (p>0.99).
P-values were raw p-values from multivariate regressions, and compared with threshold 0.05/11=0.004 to determine the statistical significance.
Table 5. Effect of SA vs. Non-SA from Logistic Regression Models with Significant Interaction Terms of SA Diagnosis vs. Non-SA diagnosis.
Multivariable regression for outcomes with significant interactions. Present diagnosis of sleep apnea is the effect variable.
| Interaction Terms c | Adjusted OR (95% CI) a | Adjusted p-value a | c-statistic | ||
|---|---|---|---|---|---|
| Mechanical Ventilation | |||||
| Complicated Hypertension = No | COPD = No | 13.80 (11.53, 16.52) | <0.0001 | 0.83 | |
| COPD = Yes | 8.01 (6.19, 10.36) | <0.0001 | |||
| Complicated Hypertension = Yes | COPD = No | 5.30 (3.62, 7.74) | <0.0001 | ||
| COPD = Yes | 3.07 (2.04, 4.64) | <0.0001 | |||
| Non-Invasive Ventilation | |||||
| Complicated Hypertension = No | COPD = No | 46.12 (33.88, 62.77) | <0.0001 | 0.88 | |
| COPD = Yes | 16.20 (10.95, 23.97) | <0.0001 | |||
| Complicated Hypertension = Yes | COPD = No | 15.62 (8.53, 28.60) | <0.0001 | ||
| COPD = Yes | 5.49 (2.92, 10.30) | <0.0001 | |||
| ICU Utilization | |||||
| Male | 2006 | 1.86 (1.49, 2.30) | <0.0001 | 0.73 | |
| 2007 | 1.82 (1.49, 2.23) | <0.0001 | |||
| 2008 | 2.05 (1.70, 2.48) | <0.0001 | |||
| 2009 | 1.37 (1.13, 1.67) | <0.0001 | |||
| 2010 | 1.37 (1.09, 1.72) | 0.0005 | |||
| Female | 2006 | 2.28 (1.82, 2.84) | <0.0001 | ||
| 2007 | 2.23 (1.82, 2.73) | <0.0001 | |||
| 2008 | 2.52(2.09, 3.04) | <0.0001 | |||
| 2009 | 1.69 (1.38, 2.05) | <0.0001 | |||
| 2010 | 1.68 (1.34, 2.11) | <0.0001 | |||
| Telemetry/Stepdown Unit Utilization | |||||
| Complicated Hypertension = No | Obesity = No | 2006 | 1.81 (1.47, 2.23) | <0.0001 | 0.68 |
| 2007 | 1.49 (1.24, 1.78) | <0.0001 | |||
| 2008 | 1.40 (1.19, 1.65) | 0.0584 | |||
| 2009 | 1.73 (1.52, 1.96) | 0.0213 | |||
| 2010 | 1.54 (1.33, 1.78) | 0.0268 | |||
| Obesity = Yes | 2006 | 2.17 (1.73, 2.72) | <0.0001 | ||
| 2007 | 1.78 (1.47, 2.17) | <0.0001 | |||
| 2008 | 1.68 (1.41, 2.00) | 0.0689 | |||
| 2009 | 2.07 (1.79, 2.39) | 0.0262 | |||
| 2010 | 1.85 (1.58, 2.16) | 0.0309 | |||
| Complicated Hypertension = Yes | Obesity = No | 2006 | 1.25 (0.91, 1.73) | >0.99 | |
| 2007 | 1.03 (0.76, 1.39) | >0.99 | |||
| 2008 | 0.97 (0.73, 1.29) | 0.1853 | |||
| 2009 | 1.19 (0.91, 1.57) | 0.17 | |||
| 2010 | 1.07 (0.80, 1.41) | 0.1773 | |||
| Obesity = Yes | 2006 | 1.50 (1.08, 2.08) | 0.0047 | ||
| 2007 | 1.23 (0.91, 1.67) | 0.2089 | |||
| 2008 | 1.16 (0.87, 1.55) | 0.1901 | |||
| 2009 | 1.43 (1.08, 1.89) | 0.1731 | |||
| 2010 | 1.28 (0.96, 1.69) | 0.1801 | |||
| Increased Length of Hospitalization | |||||
| Obesity = No | 1.12 (1.06, 1.18) | <0.0001 | 0.65 | ||
| Obesity = Yes | 1.23 (1.15, 1.31) | <0.0001 | |||
(Reference = no sleep apnea diagnosis).
All 95% CIs and the associated p-values were both Bonferroni corrected for multiple comparisons
All unadjusted models had p-values < 0.001
All interaction terms had p-values < 0.001
Complication Outcomes
No significant interaction terms were found for the models analyzing outcomes of combined complications, pulmonary complications, cardiac complications, and mortality. A diagnosis of SA emerged as an independent risk factor for the outcome of combined complications, as well as pulmonary and cardiac complications separately, but not for mortality.
Utilization Outcomes
Significant interaction terms were detected for the models assessing outcome of mechanical ventilation (e.g. complicated hypertension, COPD), non-invasive ventilation (e.g. complicated hypertension, COPD), utilization of critical care (e.g. gender, year), stepdown/telemetry services (e.g. year, complicated hypertension, obesity) and prolonged length stay (e.g. obesity). None were found for the outcomes of the need for blood transfusion and increased economic resource. The details of odds ratios conditioned on the modifications are shown in Table 5, and the SA effect on outcomes will have to be interpreted in the context of these modifications. When taking interaction terms into account, SA was associated with increased odds for mechanical ventilation, non-invasive ventilatory support, utilization of ICU, stepdown and telemetry services as well as prolonged length of stay and increased economic resources.
In the sensitivity analysis including “unknown” anesthesia as a separate category, the results were similar.
Diagnostic of Model
The value inflation factors were all <10, indicating that no multicollinearity was present. The ranges of C-statistics were 0.7 to 0.9 except for the model evaluating increasing economic resource utilization (c=0.6), indicating good to very good discrimination for most outcomes.
Sensitivity Analysis Based on Propensity Score Matching
Out of 32,789 SA patients in the sample, 28,177 were successfully matched to non-SA patients. The propensity score matched samples were well balanced (STD <10%) between groups in terms of demographic variables and comorbidities (Appendices 4, 5). The common odds ratios were similar to the odds ratios found in the analysis with main effects only.
Discussion
In this study, we were able to show that SA was associated with higher rates and odds of postoperative complications, utilization of resources and length of stay.
We observed that SA was associated with a 47% increased risk for the combined outcome of postoperative major morbidity. An increased risk for adverse outcomes among SA patients has previously been described 2-7, but information on a wide range of outcomes beyond pulmonary complications in the setting of orthopedic surgery remains rare. While the exact mechanisms by which SA confers increased risk for complications remains unknown, a number of abnormalities have been described among SA patients that may lower the clinically relevant injury threshold for various organ systems to exhibit signs of dysfunction. For example, SA is associated with higher baseline levels of systemic and pulmonary inflammation 23, decreased pharyngeal sphincter function 24, and increased sensitivity to the respiratory depressant effects of opioids 25. These and other pathologic states may contribute to the increased susceptibility of SA patients to perioperative insults, such as transfusion and ventilator related lung injury, and aspiration. However, it must be noted that not all our findings corroborate with available literature. For example, we did not find differences in the rates of cerebrovascular disease and complications between the two groups. Previous research has suggested that the presence of SA may indeed increase the risk for stroke 26, without allowing for inferences to be made in the postoperative setting. A factor to be considered when interpreting our findings is the fact that only patients with a known diagnosis of SA are included in our cohort and that use of positive airway pressure therapy, which may reverse some of the pathophysiology predisposing to long term adverse outcomes, may be more likely utilized in this population.
In addition, we identified lower rates of blood transfusions among SA patients in our study. Feasible explanations for this finding are not obvious, but warrant further inquiry. One possibility includes higher starting hematocrit levels frequently found in SA patients 27.
Recent literature has further suggested a lack of evidence for increased mortality among SA patients 28. While speculative, an increase in vigilance among clinicians may indeed lead to better detection of complication in this patient group perceived to be at risk, thus allowing for interventions to avoid this extreme outcome despite higher complication rates.
In addition to the increased risk for adverse medical outcomes, we were able to show an effect of the presence of SA on increased resource utilization. The argument can be made that at least some of the increased utilization of services is not an indication of higher morbidity but reflects planned use of monitored settings and perioperative positive airway pressure equipment in an attempt to reduce complications. However, despite the recommendation by the American Society of Anesthesiologists task force on perioperative care of patients with obstructive sleep apnea that patient with SA be observed in a monitored setting postoperatively and treated with positive pressure ventilation in certain cases 29, little data is available on the use of resources such as telemetry, step-down and intensive care units. If the utilization of these resources would have to be interpreted in this context, the conclusion to be drawn would point towards a surprisingly low use of perioperative monitoring and use of ventilatory assistance. Indeed, there remains a paucity of data regarding the adoption of guidelines for the perioperative care in current practice. Interestingly, a single published inquiry into the existence of perioperative policies amongst anesthesia departments in Canada concluded that only 28% had such provisions 30. While lack of proof that these interventions lead to improved outcomes among SA patients may be one reason, the additional use of economic resources associated with implementation of these practices on a wider level certainly represents a contributing factor. It is therefore not surprising that in our study SA was associated with higher odds for this outcome.
Our study is subject to a number of limitations. As a consequence of retrospective database analysis, clinically important covariates are not obtainable. However, a very large sample size provides access to outcomes as seen in actual practice. A further limitation is the reliance on ICD-9 coding for the diagnosis of SA. Thus it is not possible to correlate the diagnosis with the severity of SA. This also applies to the severity of various other comorbidities. It is also almost certain that the true incidence of SA is higher than that reported here, as only patients with a pre-operative diagnosis code for SA would have been entered. This potential misclassification may have lead to an underestimation of the effects of SA on outcomes. As mentioned previously, we were unable to determine if the utilization of higher levels of care as well as that of non-invasive ventilation was the result of a complication and thus represented treatment or if it was used in a prophylactic manner. The inability to determine causal relationships makes it impossible to study if these interventions are capable of modifying outcomes in our sample. Thus, the value of this data lies in the estimation of the magnitude of utilization of these resources. Further, because cause and effect or mechanisms of adverse events cannot be established from this data we are unable to conclusively explain some of the findings. Finally, all comorbidities and complications are based on the ICD-9-CM coding system or billing codes (see Appendix 1). Although rigorous quality checks are being performed by the vendor before release, coding errors or inconsistencies remain a possibility. However, there is no indication that this potential bias would affect one of the groups more than the other.
In conclusion, SA is associated with higher rates and odds ratios of postoperative complications, utilization of resources and length of stay among hip and knee arthroplasty recipients. Interestingly, despite a higher rate of advanced monitoring among SA patients, the overall use of these modalities was still less than 17%, at least partially putting into question the adoption of guidelines and perioperative protocols for the treatment of SA. The subject of outcomes among SA patients requires further study in order to identify patients at risk and determine ways to prevent complications using evidence-based and accountable approaches.
Acknowledgments
Funding: This study was performed with funds from the Hospital for Special Surgery, Department of Anesthesiology, New York, NY, USA, and the Anna-Maria and Stephen Kellen Physician-Scientist Career Development Award, New York, NY, USA (SGM). Contribution of RR, YLC, XS and MM on this project was supported in part by funds from the Clinical Translational Science Center (CTSC), National Center for Advancing Translational Sciences (NCATS) grant # UL1-RR024996 and Center for Education, Research, and Therapeutics (CERTs), Agency for Healthcare Research and Quality (AHRQ) grant # U18 HSO16-75. The content is solely the responsibility of the authors and does not necessarily represent the official views of the funding sources NCATS and AHRQ based in Rockville, MD.
Appendix
Appendix 1.
Diagnosis codes, prevalence, and percent of total for sleep apnea cohort
| Sleep apnea diagnosis codes | ||
|---|---|---|
| Diagnosis code | Description | % of SA diagnoses a |
| 327.23 | Obstructive sleep apnea (adult) (pediatric) | 59.43 |
| 780.57 | Unspecified sleep apnea | 39.00 |
| 786.03 | Apnea | 0.60 |
| 780.51 | Insomnia with sleep apnea, unspecified | 0.35 |
| 780.53 | Hypersomnia with sleep apnea, unspecified | 0.24 |
| 327.24 | Idiopathic sleep related nonobstructive alveolar hypoventilation | 0.17 |
| 327.26 | Sleep related hypoventilation/hypoxemia in conditions classifiable elsewhere | 0.11 |
| 327.27 | Central sleep apnea in conditions classified elsewhere | 0.07 |
| 327.20 | Organic sleep apnea, unspecified | 0.02 |
| 327.21 | Primary central sleep apnea | 0.02 |
Please note that percentages add up to more than 100% as a small fraction of patients carried more than one sleep apnea diagnosis
Appendix 2.
International Classification of Diseases-9th revision-Clinical Modification (ICD-9-CM) diagnosis codes for major complications and comorbidities.
| Complications
| |
|---|---|
| Event | ICD-9-CM diagnosis codes |
|
| |
| Pulmonary Embolism | 415.1 |
|
| |
| Deep Vein Thrombosis | 451.1, 451.2, 451.8, 451.9, 453.2, 453.4, 453.8, 453.9 |
|
| |
| Cerebrovascular Event | 433.01, 433.11, 433.21, 433.31, 433.81, 433.91, 434.01, 434.11, 434.91, 997.02 |
|
| |
| Pulmonary Compromise | 514, 518.4, 518.5, 518.81, 518.82 |
|
| |
| Sepsis | 038, 038.0, 038.1x, 038.2, 038.3, 038.40, 038.41, 038.42, 038.43, 038.44, 038.49, 038.8, 038.9, 790. |
|
| |
| Cardiac (Non-myocardial Infarction) | 426.0, 427.41, 427.42, 429.4, 997.1, 427.4, 427.3, 427.31, 427.32 |
|
| |
| Acute Myocardial Infarction | 410.XX |
|
| |
| Pneumonia | 481, 482.00- 482.99, 483, 485, 486, 507.0, 997.31, 997.39 |
|
| |
| All Infections | 590.1, 590.10, 590.11, 590.8, 590.81, 590.2, 590.9, 595.0, 595.9, 599.0, 567.0 |
| 480, 480.0, 480.1, 480.2, 480.8, 480.9, 481, 482.0, 482.1, 482.2, 482.3, 482.30, 482.31, 482.32, 482.39, 482.4, 482.40, 482.41, 482.42, 482.49, 482.5, 482.8, 482.81, 482.82, 482.83, 482.84, 482.89, 482.9, 483, 483.0, 483.1, 483.8, 485, 486, 487, 997.31, | |
| 038, 038.0, 038.1, 038.10, 038.11, 038.12, 038.19, 038.2, 038.3, 038.4, 038.40, 038.41, 038.42, 038.43, 038.44, 038.49, 038.8, 038.9, 790.7, | |
| 998.0, 958.4, 998.5, 998.59, 998.89, 785, 785.50, 785.52, 785.59, 999.39, 999.31, 999.3 | |
|
| |
| Acute Renal Failure | 584, 584.5, 584.9 |
|
| |
| Gastrointestinal Complication | 997.4, 560.1, 560.81, 560.9, 536.2, 537.3 |
|
| |
| Mechanical Ventilation | 93.90, 96.7, 96.70, 96.71, 96.72, |
| (CPT Code) 94002, 94656, 94003, 94657 | |
|
| |
| Blood Transfusion | 99.0, 99.01, 99.02, 99.03, 99.04, 99.05, 99.06, 99.07, 99.08, 99.09, |
| (HCPCS codes) P9010, P9011, P9012, P9016, P9017, P9019, P9020, P9021, P9022, P9023, P9031, P9032, P9033, P9034, P9035, P9036, P9037, P9038, P9039, P9040 | |
|
| |
| Non-invasive ventilation | 93.90, 93.91 |
|
| |
|
Comorbidities
| |
| Event | ICD-9-CM diagnosis codes |
|
| |
| Myocardial Infarction | 412.XX |
|
| |
| Peripheral Vascular Disease | 441.X, 785.4, V43.4, 38.48 |
|
| |
| Cerebrovascular disease | 430.X-438.X |
|
| |
| Dementia | 290.XX |
|
| |
| COPD | 490, 491.X, 492.X, 493.X, 495.X, 500-505, 506.4 |
|
| |
| Rheumatic Disease | 710.0, 710.1, 710.4, 714.0, 714.1, 714.2, 714.81, 725 |
|
| |
| Peptic ulcer disease | 531-534 |
|
| |
| Mild Liver Disease | 571.2, 571.4X, not 571.42, 571.5, 571.6 |
|
| |
| Diabetes | 250.0, 250.1, 250.2, 250.3, 250.7 |
|
| |
| Diabetes with Complications | 250.4, 250.6 |
|
| |
| Hemiplegia or Paraplegia | 344.1, 342.X |
|
| |
| Renal Disease | 582.X, 583.X, 585, 586, 588 |
|
| |
| Malignancy | 140-239.99 |
|
| |
| Moderate or Severe Liver Disease | 456.0-456.29, 572.2 - 572.8 |
|
| |
| AIDS | 042 |
|
| |
| Hypertension | 401.1, 401.9, 642.0X |
|
| |
| Complicated Hypertension | 401.0, 402.X-405.X, 642.1, 642.2, 642.7, 642.9 |
|
| |
| Pulmonary Hypertension | 416.X |
|
| |
| Obesity | 278.0, 278.00, 278.01, 649.1, V85.3, V85.4, V85.54, 792.91 |
|
| |
| Sleep Apnea | 786.03, 780.51, 780.53, 780.57, 327.20-327.27, 327.29 |
Appendix 3.
The incidence of individual cardiac outcomes for patients without and with diagnosis of sleep apnea
| Incidence of Selected Cardiac Complications/Outcomes | |||||
|---|---|---|---|---|---|
| No SA diagnosis | SA Diagnosis | ||||
| Event | N | % | N | % | STD(%) |
| Conduction disorders | 10,433 | 2.15 | 1,155 | 2.61 | 3.04 |
| Atrial fibrillation and flutter | 27,357 | 5.63 | 3,854 | 8.71 | 11.94 |
| Ventricular fibrillation and flutter | 80 | 0.02 | 10 | 0.02 | 0.50 |
| Cardiac arrest | 269 | 0.06 | 57 | 0.13 | 2.44 |
| Functional disturbances following cardiac surgery | 5 | 0.001 | 0 | 0 | 0.45 |
| Cardiogenic shock | 96 | 0.02 | 13 | 0.03 | 0.58 |
| Cardiac complications not elsewhere classified | 3,849 | 0.79 | 419 | 0.95 | 1.67 |
(STD = standardized difference)
Appendix 4.
Patient and Healthcare System Related Characteristics Based on the Propensity Scoring Matched Samples
| Patient and Healthcare System Related Demographics (based on propensity matching) | |||||
|---|---|---|---|---|---|
| No SA diagnosis | SA Diagnosis | ||||
| N | % | N | % | STD (%) | |
| Total | 84,531 | 75 | 28,177 | 25 | |
| Average Age (Year) (SD) | 63.63 (10.56) | 63.70 (9.56) | 0.63 | ||
| Gender | |||||
| Female | 13,203 | 15.6 | 4,071 | 14.5 | 2.16 |
| Male | 71,328 | 84.4 | 24,106 | 85.6 | |
| Race | |||||
| White | 68,623 | 81.2 | 22,331 | 79.3 | 4.84 |
| Black | 5,834 | 6.9 | 2,250 | 8.00 | 4.13 |
| Hispanic | 1,321 | 1.6 | 498 | 1.8 | 1.60 |
| Other | 8,753 | 10.4 | 3,098 | 11.00 | 2.07 |
| Average Deyo Index a (SD) | 0.82 (1.04) | 0.87 (1.05) | 4.36 | ||
| Deyo Index Category | |||||
| 0 | 45,444 | 53.8 | 14,452 | 51.3 | 4.95 |
| 1 | 16,042 | 19.00 | 5,659 | 20.1 | 2.79 |
| 2 | 16,588 | 19.6 | 5,708 | 20.3 | 1.59 |
| ≥ 3 | 6,457 | 7.6 | 2,358 | 8.4 | 2.69 |
| Type of Procedure | |||||
| THA | 71,328 | 84.4 | 24,106 | 85.6 | 2.46 |
| TKA | 13,203 | 15.6 | 4,071 | 14.5 | |
| Type of Anesthesia | |||||
| N | 8,342 | 9.9 | 2,874 | 10.2 | 1.10 |
| G | 64,747 | 76.6 | 21,397 | 75.9 | 1.55 |
| N+G | 11,442 | 13.5 | 3,906 | 13.9 | 0.95 |
| Year of Procedure | |||||
| 2006 | 11,886 | 14.1 | 4,064 | 14.4 | 1.04 |
| 2007 | 15,122 | 17.9 | 5,103 | 18.1 | 0.58 |
| 2008 | 17,690 | 20.9 | 5,913 | 21.00 | 0.14 |
| 2009 | 22,472 | 26.6 | 7,341 | 26.1 | 1.21 |
| 2010 | 17,361 | 20.5 | 5,756 | 20.4 | 0.27 |
| Admission Type | |||||
| Emergent | 1,867 | 2.2 | 694 | 2.5 | 1.68 |
| Urgent | 3,095 | 3.7 | 1,175 | 4.2 | 2.62 |
| Elective | 79,321 | 93.8 | 26,253 | 93.2 | 2.70 |
| Other | 248 | 0.3 | 55 | 0.2 | 1.99 |
| Indication | |||||
| RA | 2,151 | 2.5 | 829 | 2.9 | 2.43 |
| OA | 80,487 | 95.2 | 26,588 | 94.4 | 3.85 |
| Other | 1,893 | 2.2 | 760 | 2.7 | 2.95 |
| Hospital Size (Beds) | |||||
| < 299 | 25,619 | 30.3 | 8,610 | 30.6 | 0.54 |
| 300-499 | 34,874 | 41.3 | 11,602 | 41.2 | 0.16 |
| ≥ 500 | 24,038 | 28.4 | 7,965 | 28.3 | 0.38 |
| Hospital Location | |||||
| Rural | 71,328 | 84.4 | 24,106 | 85.6 | 2.48 |
| Urban | 13,203 | 15.7 | 4,071 | 14.5 | |
| Hospital Teaching Status | |||||
| Non-Teaching | 71,328 | 84.4 | 24,106 | 85.6 | 1.25 |
| Teaching | 13,203 | 15.6 | 4,071 | 14.5 | |
The Deyo Index was validated for the outcomes of complications, mortality, blood transfusion, use of hospital resources, and other adverse events on a cohort of surgical patients 13.
Appendix 5.
Comorbidity Incidence Based Propensity Scoring Matched Samples
| Incidence of Comorbid Disease (based on propensity matching) | |||||
|---|---|---|---|---|---|
| No SA diagnosis | SA Diagnosis | ||||
| Comorbidity | N | % | N | % | STD(%) |
| MI | 3,611 | 4.3 | 1,386 | 4.9 | 3.09 |
| Cerebrovascular Disease | 186 | 0.2 | 68 | 0.2 | 0.44 |
| Peripherovascular Disease | 1,580 | 1.9 | 595 | 2.1 | 1.74 |
| Dememtia | 57 | 0.1 | 21 | 0.1 | 0.27 |
| Renal Disease | 35 | <0.1 | 15 | 0.1 | 0.54 |
| COPD | 17,087 | 20.2 | 5,983 | 21.2 | 2.52 |
| Diabetes | 20,608 | 24.4 | 7,140 | 25.3 | 2.22 |
| Complicated Diabetes | 1,366 | 1.6 | 490 | 1.7 | 0.96 |
| Cancer | 1,354 | 1.6 | 500 | 1.8 | 1.34 |
| Hypertension | 58,936 | 69.7 | 19,330 | 68.6 | 2.42 |
| Complicated Hypertension | 4,181 | 5.0 | 1,498 | 5.3 | 1.68 |
| Pulmonary Hypertension | 695 | 0.8 | 243 | 0.9 | 0.44 |
| Obesity | 27,886 | 33.0 | 9,561 | 33.9 | 2.00 |
(SA = sleep apnea; STD = standardized difference; COPD = chronic obstructive pulmonary disease)
Appendix 6.
Results comparisons between the propensity score method-based sensitivity analysis and multivariable logistic regressions with main effects only Based on the matched sample, the effect of SA on outcomes was tested for significance using the Cochran-Mantel-Haenszel test. Common odds ratio (COR) Bonferroni corrected 95% confidence intervals and p-values are reported.
| Propensity Score Matched Samples | Multivariable logistic regression with main effects only | |
|---|---|---|
| Outcome | Common Odds Ratio (Corrected 95% CI) a,b | Adjusted Odds Ratio (Corrected 95% CI) a,b |
| Combined Complications | 1.45 (1.37, 1.53) | 1.47 (1.40, 1.54) |
| Pulmonary Complications | 1.90 (1.68, 2.15) | 1.86 (1.68, 2.06) |
| Cardiac Complications | 1.54 (1.43, 1.66) | 1.59 (1.49, 1.69) |
| Mortality | 1.20 (0.69, 2.07) | 1.27 (0.80, 2.04) |
| Mechanical Ventilation | 10.84 (8.97, 13.09) | 10.26 (9.01, 11.69) |
| Non-Invasive Ventilation | 27.78 (20.02, 38.56) | 29.04 (23.55, 35.80) |
| Blood Product Transfusion | 0.91 (0.86, 0.96) | 0.88 (0.83, 0.92) |
| ICU Utilization | 1.85 (1.69, 2.03) | 1.85 (1.71, 2.00) |
| Telemetry / Stepdown Unit Utilization | 1.69 (1.57, 1.82) | 1.64 (1.55, 1.75) |
| Length of Stay > 75th percentile | 1.18 (1.13, 1.23) | 1.16 (1.12, 1.20) |
| Utilization of economic resources > 75th percentile | 1.13 (1.11, 1.22) | 1.13 (1.09, 1.18) |
All 95% CIs and the associated p-values were both Bonferroni corrected for multiple comparisons
All corrected p-values were <0.0001 except for mortality (p>0.99).
All corrected p-values were <0.0001 except for mortality (p=0.43).
Contributor Information
Stavros G Memtsoudis, Email: memtsoudiss@hss.edu, (a) Department of Anesthesiology, Hospital for Special Surgery, Weill Medical College of Cornell University, 535 East 70th Street, New York, NY 10021, USA; (b) Division of Biostatistics and Epidemiology, Department of Public Health, Weill Medical College of Cornell University, 402 East 67th Street, New York, NY 10065, USA.
Ottokar Stundner, Email: otto.stundner@gmail.com, Department of Anesthesiology, Hospital for Special Surgery, Weill Medical College of Cornell University, 535 East 70th Street, New York, NY 10021, USA.
Rehana Rasul, Email: rer2017@med.cornell.edu, Division of Biostatistics and Epidemiology, Department of Public Health, Weill Medical College of Cornell University, 402 East 67th Street, New York, NY 10065, USA.
Ya-Lin Chiu, Email: yac2003@med.cornell.edu, Division of Biostatistics and Epidemiology, Department of Public Health, Weill Medical College of Cornell University, 402 East 67th Street, New York, NY 10065, USA.
Xuming Sun, Email: xus2003@med.cornell.edu, Division of Biostatistics and Epidemiology, Department of Public Health, Weill Medical College of Cornell University, 402 East 67th Street, New York, NY 10065, USA.
Satya-Krishna Ramachandran, Email: rsatyak@med.umich.edu, Department of Anesthesiology, University of Michigan Health System, 1500 East Medical Center Drive, Ann Arbor, MI 48109, USA.
Roop Kaw, Email: kawr@ccf.org, Department of Hospital Medicine, Cleveland Clinic, 9500 Euclid Avenue, Cleveland, OH 44195, USA.
Peter Fleischut, Email: pmf9003@med.cornell.edu, Department of Anesthesiology, NewYork-Presbyterian Hospital, Weill Medical College of Cornell University, 525 East 68th Street, New York, NY 10065, USA.
Madhu Mazumdar, Email: mam2073@med.cornell.edu, Division of Biostatistics and Epidemiology, Department of Public Health, Weill Medical College of Cornell University, 402 East 67th Street, New York, NY 10065, USA.
References
- 1.Finkel KJ, Searleman AC, Tymkew H, Tanaka CY, Saager L, Safer-Zadeh E, Bottros M, Selvidge JA, Jacobsohn E, Pulley D, Duntley S, Becker C, Avidan MS. Prevalence of undiagnosed obstructive sleep apnea among adult surgical patients in an academic medical center. Sleep Med. 2009;10:753–8. doi: 10.1016/j.sleep.2008.08.007. [DOI] [PubMed] [Google Scholar]
- 2.Memtsoudis S, Liu SS, Ma Y, Chiu YL, Walz JM, Gaber-Baylis LK, Mazumdar M. Perioperative pulmonary outcomes in patients with sleep apnea after noncardiac surgery. Anesth Analg. 2011;112:113–21. doi: 10.1213/ANE.0b013e3182009abf. [DOI] [PubMed] [Google Scholar]
- 3.Gupta RM, Parvizi J, Hanssen AD, Gay PC. Postoperative complications in patients with obstructive sleep apnea syndrome undergoing hip or knee replacement: a case-control study. Mayo Clinic proceedings. 2001;76:897–905. doi: 10.4065/76.9.897. [DOI] [PubMed] [Google Scholar]
- 4.Liao P, Yegneswaran B, Vairavanathan S, Zilberman P, Chung F. Postoperative complications in patients with obstructive sleep apnea: a retrospective matched cohort study. Canadian journal of anaesthesia = Journal canadien d’anesthésie. 2009;56:819–28. doi: 10.1007/s12630-009-9190-y. [DOI] [PubMed] [Google Scholar]
- 5.Chung F, Yegneswaran B, Liao P, Chung SA, Vairavanathan S, Islam S, Khajehdehi A, Shapiro CM. Validation of the Berlin questionnaire and American Society of Anesthesiologists checklist as screening tools for obstructive sleep apnea in surgical patients. Anesthesiology. 2008;108:822–30. doi: 10.1097/ALN.0b013e31816d91b5. [DOI] [PubMed] [Google Scholar]
- 6.Gali B, Whalen FX, Schroeder DR, Gay PC, Plevak DJ. Identification of patients at risk for postoperative respiratory complications using a preoperative obstructive sleep apnea screening tool and postanesthesia care assessment. Anesthesiology. 2009;110:869–77. doi: 10.1097/ALN.0b013e31819b5d70. [DOI] [PubMed] [Google Scholar]
- 7.Kaw R, Pasupuleti V, Walker E, Ramaswamy A, Foldvary-Schafer N. Postoperative complications in patients with obstructive sleep apnea. Chest. 2012;141:436–41. doi: 10.1378/chest.11-0283. [DOI] [PubMed] [Google Scholar]
- 8.Kurtz S, Ong K, Lau E, Mowat F, Halpern M. Projections of primary and revision hip and knee arthroplasty in the United States from 2005 to 2030. J Bone Joint Surg Am. 2007;89:780–5. doi: 10.2106/JBJS.F.00222. [DOI] [PubMed] [Google Scholar]
- 9.Premier I. [May 1, 2013];Premier Perspective Database. www.premierinc.com/quality-safety/tools-services/prs/data/perspective.jsp.
- 10.US Department of Health and Human Services. Office for Civil Rights HCA, ed. Washington, DC: Office for Civil Rights, HIPAA Compliance Assistance; 2003. OCR Privacy Brief: Summary of the HIPAA Privacy Rule. [Google Scholar]
- 11.Stundner O, Chiu YL, Sun X, Mazumdar M, Fleischut P, Poultsides L, Gerner P, Fritsch G, Memtsoudis SG. Comparative perioperative outcomes associated with neuraxial versus general anesthesia for simultaneous bilateral total knee arthroplasty. Reg Anesth Pain Med. 2012;37:638–44. doi: 10.1097/AAP.0b013e31826e1494. [DOI] [PMC free article] [PubMed] [Google Scholar]
- 12.Memtsoudis SG, Sun X, Chiu YL, Nurok M, Stundner O, Pastores SM, Mazumdar M. Utilization of Critical Care Services among Patients Undergoing Total Hip and Knee Arthroplasty: Epidemiology and Risk Factors. Anesthesiology. 2012;117:107–16. doi: 10.1097/ALN.0b013e31825afd36. [DOI] [PMC free article] [PubMed] [Google Scholar]
- 13.Deyo RA, Cherkin DC, Ciol MA. Adapting a clinical comorbidity index for use with ICD-9-CM administrative databases. J Clin Epidemiol. 1992;45:613–9. doi: 10.1016/0895-4356(92)90133-8. [DOI] [PubMed] [Google Scholar]
- 14.Austin PC. Balance diagnostics for comparing the distribution of baseline covariates between treatment groups in propensity-score matched samples. Stat Med. 2009;28:3083–107. doi: 10.1002/sim.3697. [DOI] [PMC free article] [PubMed] [Google Scholar]
- 15.Normand ST, Landrum MB, Guadagnoli E, Ayanian JZ, Ryan TJ, Cleary PD, McNeil BJ. Validating recommendations for coronary angiography following acute myocardial infarction in the elderly: a matched analysis using propensity scores. J Clin Epidemiol. 2001;54:387–98. doi: 10.1016/s0895-4356(00)00321-8. [DOI] [PubMed] [Google Scholar]
- 16.Mickey RM, Greenland S. The impact of confounder selection criteria on effect estimation. Am J Epidemiol. 1989;129:125–37. doi: 10.1093/oxfordjournals.aje.a115101. [DOI] [PubMed] [Google Scholar]
- 17.Bland JM, Altman DG. Multiple significance tests: the Bonferroni method. BMJ. 1995;310:170. doi: 10.1136/bmj.310.6973.170. [DOI] [PMC free article] [PubMed] [Google Scholar]
- 18.Hosmer DW, Lemeshow SA. Goodness-of-fit test for the multiple logistic regression model. Commun Stat. 1980;A10:1043–69. [Google Scholar]
- 19.Pepe MS. The statistical evaluation of medical tests for classification and precision. Oxford, UK: Oxford University Press; 2003. pp. 66–94. [Google Scholar]
- 20.Merkow RP, Hall BL, Cohen ME, Dimick JB, Wang E, Chow WB, Ko CY, Bilimoria KY. Relevance of the c-statistic when evaluating risk-adjustment models in surgery. J Am Coll Surg. 2012;214:822–30. doi: 10.1016/j.jamcollsurg.2011.12.041. [DOI] [PubMed] [Google Scholar]
- 21.Ury HK. Efficiency of case-control studies with multiple controls per case: continuous or dichotomous data. Biometrics. 1975;31:643–9. [PubMed] [Google Scholar]
- 22.Lori S. Performing a 1:N Case-Control Match on Propensity Score. SAS Proceedings. 2010 [Google Scholar]
- 23.Carpagnano GE, Lacedonia D, Foschino-Barbaro MP. Non-invasive study of airways inflammation in sleep apnea patients. Sleep Med Rev. 2011;15:317–26. doi: 10.1016/j.smrv.2010.12.005. [DOI] [PubMed] [Google Scholar]
- 24.Sabaté JM, Jouët P, Merrouche M, Pouzoulet J, Maillard D, Harnois F, Msika S, Coffin B. Gastroesophageal reflux in patients with morbid obesity: a role of obstructive sleep apnea syndrome? Obes Surg. 2008;18:1479–84. doi: 10.1007/s11695-008-9508-9. [DOI] [PubMed] [Google Scholar]
- 25.Blake DW, Chia PH, Donnan G, Williams DL. Preoperative assessment for obstructive sleep apnoea and the prediction of postoperative respiratory obstruction and hypoxaemia. Anaesth Intensive Care. 2008;36:379–84. doi: 10.1177/0310057X0803600309. [DOI] [PubMed] [Google Scholar]
- 26.Yaggi HK, Concato J, Kernan WN, Lichtman JH, Brass LM, Mohsenin V. Obstructive sleep apnea as a risk factor for stroke and death. N Engl J Med. 2005;353:2034–41. doi: 10.1056/NEJMoa043104. [DOI] [PubMed] [Google Scholar]
- 27.Choi JB, Loredo JS, Norman D, Mills PJ, Ancoli-Israel S, Ziegler MG, Dimsdale JE. Does obstructive sleep apnea increase hematocrit? Sleep Breath. 2006;10:155–60. doi: 10.1007/s11325-006-0064-z. [DOI] [PubMed] [Google Scholar]
- 28.Devereaux PJ, Chan MTV, Alonso-Coello P, Walsh M, Berwanger O, Villar JC, Wang CY, Garutti RI, Jacka MJ, Sigamani A, Srinathan S, Biccard BM, Chow CK, Abraham V, Tiboni M, Pettit S, Szczeklik W, Lurati Buse G, Botto F, Guyatt G, Heels-Ansdell D, Sessler DI, Thorlund K, Garg AX, Mrkobrada M, Thomas S, Rodseth RN, Pearse RM, Thabane L, McQueen MJ, et al. Association between postoperative troponin levels and 30-day mortality among patients undergoing noncardiac surgery. JAMA. 2012;307:2295–304. doi: 10.1001/jama.2012.5502. [DOI] [PubMed] [Google Scholar]
- 29.Gross JB, Bachenberg KL, Benumof JL, Caplan RA, Connis RT, Coté CJ, Nickinovich DG, Prachand V, Ward DS, Weaver EM, Ydens L, Yu S. Practice guidelines for the perioperative management of patients with obstructive sleep apnea: a report by the American Society of Anesthesiologists Task Force on Perioperative Management of patients with obstructive sleep apnea. Anesthesiology. 2006;104:1081–93. doi: 10.1097/00000542-200605000-00026. [DOI] [PubMed] [Google Scholar]
- 30.Turner K, VanDenkerkhof E, Lam M, Mackillop W. Perioperative care of patients with obstructive sleep apnea - a survey of Canadian anesthesiologists. Canadian journal of anaesthesia = Journal canadien d’anesthésie. 2006;53:299–304. doi: 10.1007/BF03022219. [DOI] [PubMed] [Google Scholar]