
Fig. 5.
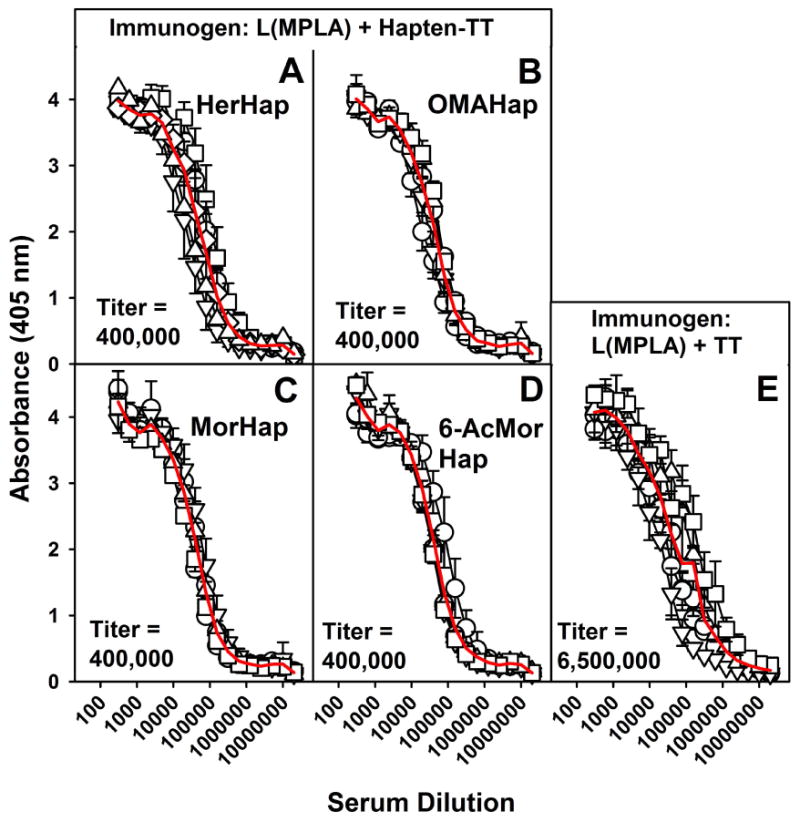
Serum IgG responses to TT 9 weeks after primary immunization. Mice were immunized with L(MPLA + HerHap-TT) (A) or L(MPLA + OMAHap) (B), L(MPLA + MorHap) (C), L(MPLA +6-AcMorHap) (D), or L(MPLA) + TT (E) at 0 and 6 weeks. Each curve represents an individual mouse (5 mice/liposome formulation). Values represent the mean ± standard deviation of triplicate determinations. The red line is an average of the 5 mice. Pre-immune sera were not elevated above assay background levels.