

Abstract
Transcranial direct current stimulation (tDCS) is being investigated as an ad-junctive technique to behavioral rehabilitation treatment after stroke. The conventional “dosage”, consisting of a large (25cm2) anode over the target with the cathode over the contralateral hemisphere, has been previously shown to yield broadly distributed electric fields whose intensities at the target region are less than maximal. Here, we report the results of a systematic targeting procedure with small “high-definition” electrodes that was used in preparation for a pilot study on 8 stroke patients with chronic aphasia. We employ functional and anatomical magnetic resonance imagery (fMRI/MRI) to define a target and optimize (with respect to the electric field magnitude at the target) the electrode configuration, respectively, and demonstrate that electric field strengths in targeted cortex can be substantially increased (63%) over the conventional approach. The optimal montage exhibits significant variation across subjects as well as when perturbing the target location within a subject. However, for each displacement of the target co-ordinates, the algorithm is able to determine a montage which delivers a consistent amount of current to that location. These results demonstrate that MRI-based models of current flow yield maximal stimulation of target structures, and as such, may aid in reliably assessing the efficacy of tDCS in neurorehabilitation.
Keywords: brain stimulation, transcranial direct current stimulation, neuromodulation, stroke rehabilitation
1. Introduction
Rehabilitation after stroke is among a growing number of potential therapeutic applications of transcranial direct current stimulation (tDCS), which delivers weak electric currents to the brain via scalp electrodes (Nitsche and Paulus, 2000). There is evidence that non-invasive electrical brain stimulation may accelerate and augment the benefits of concurrent behavioral therapy, presumably through promotion of cortical plasticity or restoration of interhemispheric balance following stroke (Hummel et al., 2005; Fregni et al., 2005; Hummel and Cohen, 2006; Schlaug et al., 2008; Schlaug and Renga, 2008; Monti et al., 2008; Baker et al., 2010; Fridriksson et al., 2011).
Electrode placement is a critical issue in tDCS design. The conventional strategy is to place the anode over a presumed “target”, with the cathode located at a distant location, typically over the contralateral supraorbital region. Examples of stimulation targets are the primary motor cortex in motor rehabilitation (Schlaug et al., 2008) and the dorsolateral prefrontal cortex in depression (Nitsche et al., 2009). The conventional electrode montage is suboptimal for delivering the maximum amount of current to these targets, and as stated in Neuling et al. (2012), viewing the applied current as flowing directly from anode to cathode is inaccurate. For example, with two adjacent electrodes, maximal stimulation in the brain volume does not necessarily occur under the stimulation sites, but rather between the two cephalic electrodes (Dmochowski et al., 2011). (On the superficial layers of the scalp and skull, the point of maximal stimulation is in fact underneath the electrode contact; see Holdefer et al. (2006) and Miranda et al. (2006), for example.) Moreover, conventional approaches employ large sponge electrodes which lead to diffuse stimulation (Datta et al., 2009). As the presumed mechanism underlying therapeutic benefits is the polarization of neuronal membranes, which varies linearly with the amount of current impinging on the cell (Bikson et al., 2004), it is possible that results of ongoing investigations into tDCS efficacy may be confounded by stimulation paradigms which fail to deliver sufficient current flow to target structures.
We have previously proposed targeted stimulation using multiple small electrodes (Datta et al., 2009). The tuning of such “high-definition” tDCS was recently formulated in the “beamforming” framework (Dmochowski et al., 2011) – given a specified target, a computer algorithm computes the electrode positions and current strengths which maximize either electric field intensity or focality at that target. Pragmatically, it is important to evaluate the benefits of tDCS optimization in the context of a specific application. In an effort to understand the importance of targeted versus diffuse cortical tDCS on aphasia treatment outcome, Richardson et al. (submitted) enrolled eight patients with chronic stroke to the left hemisphere. In the current report, we present the modeling efforts that were undertaken as part of this pilot study in order to generate the stimulation parameters for the study participants. The systematic approach described below relies on anatomical and functional magnetic resonance imaging (MRI/fMRI) to construct a volume conduction model and define a stimulation target, respectively.
Our previous efforts at optimizing the electrode montage have focused on the electric field along a specified direction. However, it is not entirely clear which field orientation is most effective at bringing about the desired neuromodulation. Consequently, here we derive an optimization algorithm which maximizes electric field magnitude irrespective of current flow direction at the target.
Due to the inherent difficulties in precisely localizing targets (for example, due to physical limits on MRI resolution), we also perform an analysis which examines the sensitivity of the optimization result to changes in target location. While the optimal montages vary greatly across study participants, it is shown that within each subject, the strength of the optimized electric field is robust to small perturbations of the target. As a result, the optimized electrode montages determined here were employed during the pilot study, with behavioral results presented in Richardson et al. (submitted).
2. Methods
2.1. Volume conduction model
The current flow induced in the head during transcranial electrical stimulation obeys Laplace's equation (Griffiths, 1999), to which a numerical solution may be obtained by modeling the head as a heterogeneous volume conductor with a known conductivity distribution. Thus, given the location and intensity of the applied currents, the resulting electric field distribution may be computed prior to stimulation (Datta et al., 2009). Moreover, these so-called forward models have recently formed the basis for an optimization problem which computes the electrode montage maximizing some property of the electric field at the target (Dmochowski et al., 2011). It should be noted that while this paper focuses on direct current stimulation, all modeling and targeting approaches discussed here apply equally well to oscillating or pulsed stimulation in the low-frequency range (< 1kHz).
We obtained anatomical MRI scans from 8 stroke patients with chronic aphasia enrolled in a pilot study to evaluate the relative efficacy of targeted over conventional tDCS to enhance language rehabilitation treatment. The MR images were first segmented automatically and then manually into one of 7 tissue categories: air, bone, skin, cerebrospinal fluid (CSF), grey matter, white matter, and lesion. We then employed MATLAB (Mathworks, Natick, MA) routines developed by our group to fit the segmented models with M = 74 “high-definition” virtual electrodes (radius of 6mm) placed on the scalp according to the international 10/10 system (Klem et al., 1999). These locations form the candidate electrode set from which a much smaller number of physical electrodes will be selected. Additionally, conductive gel was inserted into the model directly below each electrode to simulate actual stimulation practice. The resulting 9 tissue types were assigned an average (isotropic) conductivity value following Table 1, and the model was converted into a finite element (FE) mesh using the ScanIP software (Simpleware, Exeter, UK). An adaptive meshing algorithm which yields finer sampling near tissue boundaries was employed. We designated electrode Iz as the reference, and “energized” each remaining electrode in succession, solving Laplace's equation for the induced electric field at all nodes in the head for all M − 1 bipolar configurations using the Abaqus software (Simulia, Providence, RI). These solutions form a linearly independent basis for the beamforming problem in tDCS, where a multi-electrode montage is specified by an M − 1 length vector whose elements represent current strengths (Dmochowski et al., 2011). The net electric field follows as a linear combination of the columns of the “mixing matrix” A which has 3N rows (N is the number of FE nodes in the brain, N ≈ 8 · 105) and M − 1 columns. Moreover, the element at row n, column m, of A represents the x-component of the electric field induced at node n by stimulating electrode m with unit current density. Similarly, An+N,m and An+2N,m denote the y- and z-components, respectively, of the electric field.
Table 1.
Conductivity values assigned to tissues comprising the volume conduction model.
| Tissue | Conductivity (S/m) |
|---|---|
| air | 2.5 · 10−14 |
| bone | 0.01 |
| CSF | 1.65 |
| electrode | 5.9 · 107 |
| gel | 0.3 |
| grey matter | 0.276 |
| lesion | 1.65 |
| skin | 0.465 |
| white matter | 0.126 |
2.2. Optimizing the electric field in a specified direction
The optimization problem in tDCS attempts to find the montage which maximizes some property of the induced electric field; one possible criterion is the field focality, or the concentration of the field around the target region (Dmochowski et al., 2011). For the purpose of this pilot study, however, we focus on maximizing the field intensity at the target regardless of how the field behaves outside the region of interest. To ensure safety and comfort of stimulation, this maximization must be constrained by limits on the applied current intensities. The applied current at each electrode was thus limited to 1 mA, corresponding to a current density of 8.8 A/m2. This value falls well below empirically determined thresholds at which no pathological brain tissue alterations are observed in the rat (Liebetanz et al., 2009). Moreover, the total current delivered was restricted to 2 mA following the conventional tDCS safety limit (Liebetanz et al., 2009; Ambrus et al., 2011).
Assume that the preferred orientation of the current flow at the target is given by unit vector u; to maximize the current flow at the target in this direction, one is required to solve the following optimization problem:
| (1) |
where ŝ (u) denotes the montage maximizing current flow in direction u, At is a 3K-by-M sub-matrix of A corresponding to the target area, K is the number of nodes in the target region, Itotal is the total current delivered (i.e., 2 mA), while Imax is the maximum current at each electrode (i.e., 1 mA). The optimization problem of (1) was solved in MATLAB and relied on the disciplined convex programming package “CVX” (CVX Research, 2012; Grant and Boyd, 2008) to implement the constraints.
2.3. Optimizing the electric field magnitude
The role of electric field orientation relative to the location and morphology of the target region in tDCS is still unclear. Moreover, for certain target regions, defining the preferred orientation is not straightforward, particularly in the case of subcortical targets. In such cases, it may be preferable to employ the montage which maximizes current flow at the target regardless of orientation. To that end, we sought to determine the electrode configuration which maximized the magnitude of current flow at the target. As the maximization of a quadratic form is a non-convex optimization problem (Boyd and Vandenberghe, 2004), standard convex optimization tools cannot be used for this purpose. To circumvent this problem, we instead employed an “outer” optimization problem which seeks to determine the orientation u for which the optimized electric field magnitude of (1) is maximal. This may be written as:
| (2) |
with the final montage given by s(^(u(^).
To derive a solution to (2), we wrapped a gradient ascent procedure around the inner optimization routine of (1) via the MATLAB function fminunc. The “outer” procedure effectively scans the orientation space to determine the direction of electric field for which the optimized magnitude is maximal at the target region. While (2) is non-convex, note that the dimensionality is only 2 (a unit vector may be parametrized by two angles). Moreover, we chose the starting point of the direction search as the direction which yielded the maximum electric field magnitude from the following (5) pre-defined directions: radial to the skull, left, left-posterior, posterior, right-posterior.
It should be noted that since we are seeking to maximize the magnitude of current flow at the target, the polarity of the optimized montage may be reversed (i.e., anodes become cathodes and vice versa) without affecting the result. In other words, there is a sign ambiguity in the optimization problem. To that end, we carefully examined the polarity of the optimization output and its relation to the target location. We selected the polarity such that a flow of positive charge enters the grey matter from the cerebrospinal fluid (CSF). This corresponds to the convention of anodal stimulation and should predominantly depolarize pyramidal cell somata in the grey matter.
2.4. Target selection
For each participant, the target was determined from fMRI data acquired during an overt picture-naming recall task. The peri-lesional cortical areas with the highest BOLD activation during the task are deemed the target for treatment; additional details of the procedure are found in (Baker et al., 2010). The rows of the submatrix At in (2) correspond to all FE nodes within 3 mm of the fMRI-defined target; in other words, the optimization algorithm attempts to maximize the mean electric field magnitude in a 3 mm region around the target.
3. Results
3.1. Optimal montages
We first present the results of the montage optimization. As per equation (2), the optimized montage maximizes the amount of current flowing through the target region, regardless of the direction of this current flow. The optimal solution always consists of 4 active electrodes each with unit current, with 2 electrodes acting as anodes and 2 as cathodes. In other words, both the injected and return currents are split evenly into two electrodes, with the position of these electrodes determining the achieved field magnitude and direction.
The selected targets and corresponding optimized montages for all subjects are shown in Figure 1. To display the montages, we have used the topographic plots commonly employed in electroencephalography to depict scalp potentials (Delorme and Makeig, 2004). Instead of electric potentials, however, these scalp maps indicate the location of the applied scalp currents. The selected anodes (cathodes) are depicted in red (black). Each anode acts as a source of a 1 mA current, while each cathode acts as a sink of equivalent strength. Thus, the total current delivered in all cases is 2 mA. We denote the projection of the target on the scalp with an “x” – this projection was constructed by computing the 5 nearest electrodes to the target, and then computing the centroid of the 5 electrode centers.
Figure 1.
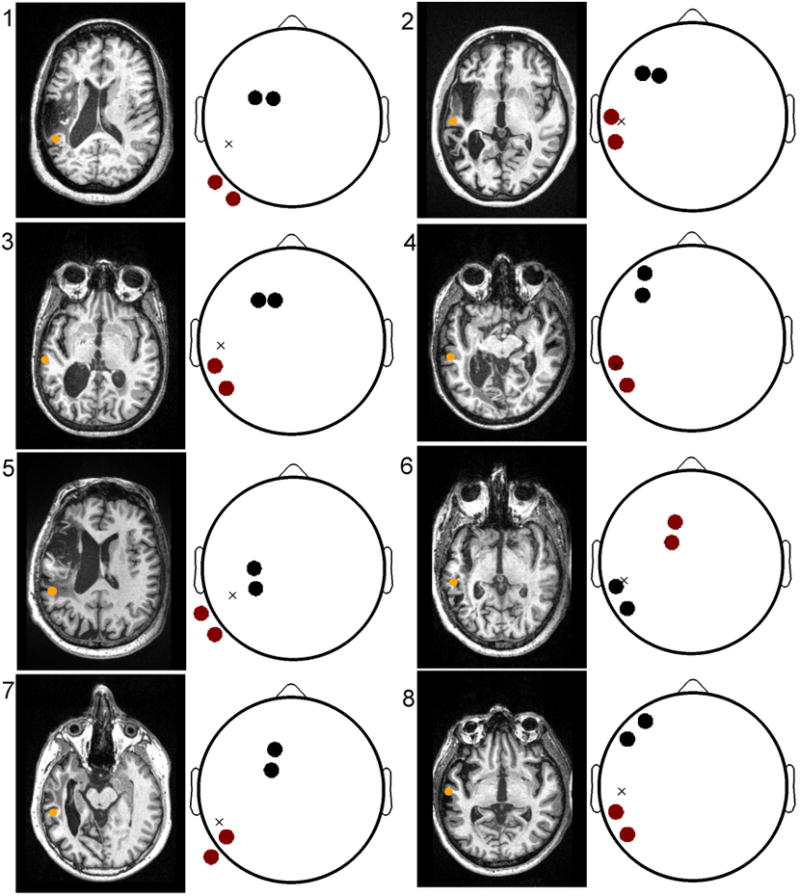
The optimized electrode montages for all subjects. Left: Anatomical MRI depicting lesion anatomy and the location of the peri-lesional target (orange circle). Right: optimal montages with anodes (cathodes) marked in red (black). The approximate location of the target, projected onto the scalp, is indicated with an ‘x’ and resides in the left temporal lobe for all aphasic subjects. The locations of both the anodes and cathodes are non-trivial, subject-dependent, and thus cannot be intuitively predicted from target location alone.
From the figure, it is readily apparent that the optimal montage is both target- and subject-dependent. For example, observe that the locations of the targets of Subjects 1 and 5 are very similar. However, the montage of S1 consists of anodes at PO9 and P9, while the montage of S5 is comprised of anodes at TP9 and P9. Note also the discrepancy in the location of the return electrodes: FC1 and FC3 for S1, and C3 and CP3 for S5. It would be difficult to construct an a priori rule, which given the target, yields the outcome of the optimization. This appears to suggest that individual differences in neuroanatomy play a key role in shaping the optimal (i.e., maximally intense at the target) montage.
In some subjects, the target is more-or-less equidistant to the anode and cathode pairs (example, S1 and S5), while in others, the target lies directly below a selected anode (or cathode; for example, S2, S4 and S6). Note, however, that even in the subjects for which the anode is roughly positioned over the target, the return electrodes are not over the contralateral supraorbital region – placing the return electrode over the contralateral supraorbital region is the convention for motor DC stimulation. Instead, these findings suggest that placing the cathodes over the ipsilateral hemisphere results in greater current flow at the target.
The origins of the observed inter-subject variability are the tremendously variable lesion anatomy and importantly, significant variability in the site of maximal fMRI activation during the naming task used to identify the target. For example, the montage for Subject 6 consists of what appears to be an inverted polarity as compared to the other subjects. In this case, the location of the target is on the posterior wall of a sulcus, and thus anodal stimulation corresponds to a front-to-back current flow.
3.2. Comparison with conventional design
Figure 2 depicts the electric fields achieved by the optimal (right) and conventional montages (left) for all subjects. The target is marked with an open black circle, and the cones denote the direction of the electric field. The magnitude of the field is represented by the background color as well as the relative size of the overlaid cones. Optimized fields correspond to the intensity-maximizing montages of Figure 1. Meanwhile, conventional fields are attained by simulating a large anode pad placed radially over the target region (modeled here by a cluster of the 5 high-definition electrodes nearest to the target) and a corresponding cathode consisting of a cluster of 5 electrodes in the right supraorbital region (electrodes FP2, F4, AF4, F6, AF8). To equalize the total current delivered in the conventional case to 2mA, each electrode comprising a simulated pad is energized with 0.4 mA.
Figure 2.
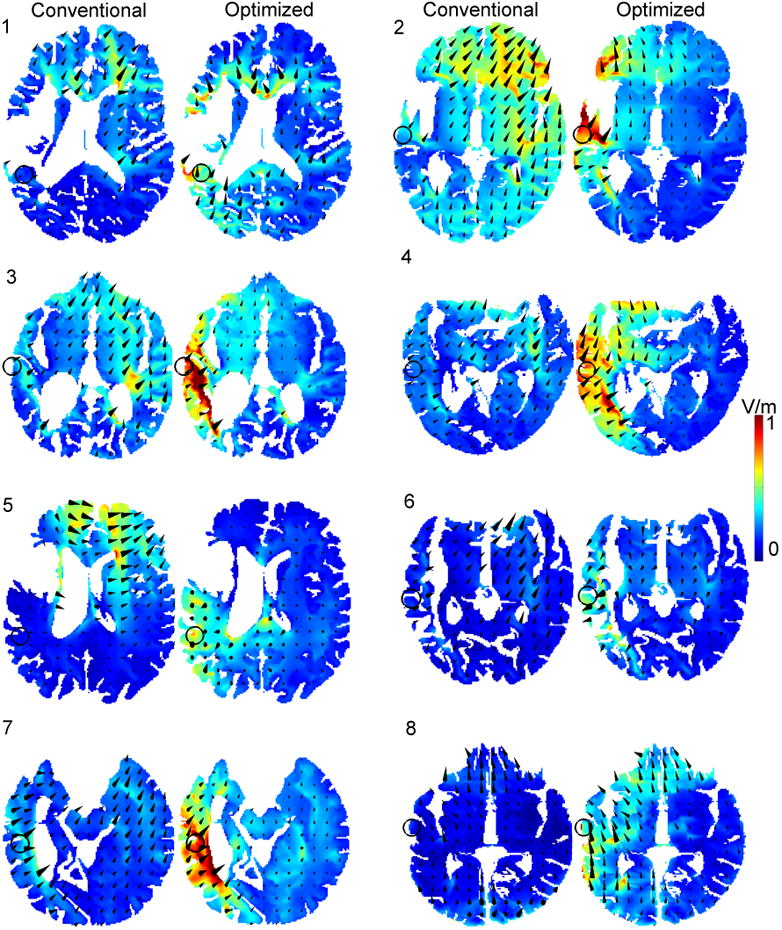
Conventional (1st and 3rd columns) and optimized (2nd and 4th columns) electric fields for all subjects. The direction (size) of the overlaid arrows depict the direction (magnitude) of the attained electric field. With the conventional design, the large electrode area and idiosyncratic head anatomy lead to moderate electric field intensities at the target (open circle). Meanwhile, the optimized design steers the applied current to the target, resulting in a marked increase in the electric field strength at the target.
The precise field intensities attained by the conventional and optimized designs are summarized in Table 2, which also lists the location of the targets and the electrodes comprising the optimal montage for each subject. The conventional montages produce a mean (standard deviation) field intensity of 0.42 (0.22 V/m) at the target, with maxima and minima of 0.55 and 0.26 V/m, respectively (see Table 2). On the other hand, the optimized design yields systematically larger target field intensities with a mean of 0.65 and standard deviation of 0.12 V/m. Moreover, the maximum optimized field intensity is 0.78 V/m (Subject 3), with a minimum of 0.44 V/m (Subject 6).
Table 2.
Summary of modeling in preparation for pilot study: target location in the standardized Montreal Neurological Institute (MNI) space (Evans et al., 1993), final electrode montages, and predicted field intensities of conventional and optimized stimulation.
| S1 | S2 | S3 | S4 | S5 | S6 | S7 | S8 | mean | |
|---|---|---|---|---|---|---|---|---|---|
|
| |||||||||
| target location | −50 | −60 | −64 | −62 | −52 | −58 | −48 | −64 | - |
| −52 | −26 | −28 | −12 | −42 | −36 | −42 | −32 | - | |
| 18 | −2 | 6 | −4 | 12 | 6 | −8 | −4 | - | |
|
| |||||||||
| anodes | PO9 | TP7 | TP7 | TP7 | TP9 | FC1 | P7 | TP7 | - |
| P9 | T7 | P7 | P7 | P9 | F1 | P9 | P7 | - | |
|
| |||||||||
| cathodes | FC1 | F3 | F1 | AF7 | C3 | TP7 | FC1 | AF7 | - |
| FC3 | F5 | F3 | F5 | CP3 | P7 | F1 | F7 | - | |
|
| |||||||||
| optimized field intensity (V/m) | 0.49 | 0.72 | 0.78 | 0.70 | 0.67 | 0.44 | 0.72 | 0.72 | 0.65 |
|
| |||||||||
| conventional field intensity (V/m) | 0.33 | 0.48 | 0.51 | 0.53 | 0.39 | 0.30 | 0.55 | 0.26 | 0.42 |
|
| |||||||||
| improvement (%) | 48 | 50 | 53 | 32 | 72 | 47 | 31 | 177 | 64 |
Two main factors contribute to the gains in field intensity achieved by the optimized montages. The applied current is concentrated over a smaller area (two electrodes of 6mm radius), thus increasing the current density. It has been shown (empirically in Nitsche et al. (2007); analytically in Dmochowski et al. (2012)) that it is the density of the applied current, and not the total amount delivered, that determines the strength of the induced electric field which presumably underlies the neuromodulatory action of tDCS. Moreover, the optimization algorithm effectively scans the space of all possible configurations to determine the montage which “steers” the injected current to the target region. Without such optimal steering, it is possible that due to the idiosyncratic anatomy of the head volumes, the applied currents in the conventional case “miss” the target region.
Note that the region of maximum field intensity does not generally coincide with the target, but rather lies in adjacent areas – this is due to the location of highly-conductive ventricles or lesions; moreover, the field intensity generally drops off with increasing depth into the brain. The effects of the (optimized) stimulation are confined to the left hemisphere for all subjects: this is in contrast to the conventional bilateral design which induces a current flow across the hemispheres. The large gain exhibited by Subject 8 may be attributed to the highly unilateral nature of the optimal montage (refer to Figure 1), which steers the flow of current via the highly-conductive CSF adjacent to the target, which resides on the edge of the grey matter at the temporal lobe. Perhaps most interesting is the current flow of Subject 5: the conventional design results in a markedly weak current flow at the target (0.39 V/m). Careful examination of the figure reveals that the applied current is in fact being “drawn” by the highly conductive lesion, which effectively shunts the applied current through to the cathode. This is evidenced by the fact that a strong current flow is exhibited in the left orbital region despite the fact that the anode is over the temporal-parietal area. By incorporating the idiosyncratic lesion anatomy into the volume conduction model, the optimization procedure selects an electrode montage which directs current into the peri-lesional target (electric field intensity of 0.67 V/m).
In addition to comparing the conventional design to the optimized case, it is also interesting to examine the result of applying the optimized montage of one subject to that of another – as previously mentioned, the targets of S1 and S5 are highly congruent. However, if we apply the optimal montage of S1 to S5, the resulting electric field magnitude of S5 falls from 0.67V/m to 0.49V/m.
3.3. Sensitivity analysis
Before settling on the montage to be employed during the study, we set out to determine whether the montage optimization procedure is robust to small changes in target location. For example, if the target region is moved by one voxel in the MRI image, how does this perturbation propagate through the optimization algorithm and modify the optimal montage? Correspondingly, how do these changes in the optimal montage manifest themselves in terms of current flow to the target? Noise in the MR image, segmentation errors, as well as mismatch between the model and actual heads (for example, in electrode placement) will all introduce small errors into the computational procedure. In practice, it is thus key to employ algorithms which exhibit robustness to such small perturbations.
For each subject, we determined a set of “target nodes”: discrete FE mesh points which fall within 3 mm of the physiological target. For each target node, we performed the optimization of (2) to compute the electrode montage which maximizes the magnitude of current flow to the individual node (the submatrix At has just 3 rows). We then examined the optimal montages across all target nodes, as well as the magnitude of the electric field achieved in each case. The results are illustrated in Figure 3.
Figure 3.

Evaluating the sensitivity of montage optimization. The depicted montages are the optimal solutions averaged across all nodes in a 3 mm vicinity of the physiological target. The values listed above each averaged montage refers to the corresponding electric field intensities (mean ± standard deviation) achieved in the 3 mm neighborhood of probed targets. Electrodes whose applied currents are close to ± 1mA are reliably selected regardless of the precise target location. Values close to zero indicate that this location is seldom selected. Small variations of the target node have a marked effect on the location of the optimally selected electrodes. However, the resulting electric field magnitude at the target node is robust to these movements of the optimal montage.
The scalp maps represent the optimal montage for each subject, averaged over the set of target nodes: if denotes the montage maximizing current flow to node k, then the plot depicts , where K is the number of target nodes (K = 69 averaged across subjects). Thus, these are not physical montages in the sense that the sum of currents does not necessarily equal zero. Rather, these topographical plots depict the amount of variation exhibited by the optimal montage in response to small variations in the target location. Above each plot, we quantify the mean electric field magnitude achieved by the optimal montage at the target node, as well as the corresponding magnitude spread via the standard deviation.
From the figure, it is evident that perturbing the target location has a marked effect on the the optimal montage, in that the clusters of optimally selected electrodes encompass several adjacent candidate locations in the 10/10 space. However, these “movements” of the optimal montage do not significantly alter the amount of current flow impinging on the target, as the standard deviation of the target field strength is upper bounded by less than 20% of the mean, and is far smaller for most subjects. This means that while the corresponding cost functions exhibit disparate maxima when moving the target node, the values of these maxima are in fact reliable. For every movement of the target within the 3 mm neighborhood, the optimization algorithm is able to identify a montage which delivers a reliable amount of current to that precise target.
We proceeded to employ the final montages shown in Fig. 1 in the pilot study. Thus, rather than selecting a single target node (as was done to evaluate sensitivity), we instead opted to optimize the intensity in a 3 mm vicinity. The tradeoff here is a reduction in the field intensity at the node closest to the target, but an overall increase in field intensity in the vicinity of the target – this represents a “safe” design which presumably mitigates errors in the precise target location.
3.4. Summary
Figure 4 provides a summary of the modeling work undertaken as part of the pilot study, while also briefly presenting the behavioral results. The predicted electric field intensities for each subject are shown in Panel A: the mean improvement achieved by targeted stimulation over the conventional design is 64% ± 47% (p < 0.0001, paired t-test), with Subjects 7 and 8 exhibiting the smallest and largest improvements of 32% and 177%, respectively. Full results of the experimental study on anomia treatment for which these montages were developed will appear in (Richardson et al., submitted). Below, we briefly summarize the results.
Figure 4.

Conventional versus optimized tDCS: (A) Electric field magnitudes achieved at the target during conventional and optimized stimulation: the optimized design delivers 64% more current (averaged across subjects). (B) Accuracy (relative to baseline) on a word-naming task after conventional and optimized tDCS. Subjects improve by 8 % after the conventional and by 11 % after the optimized treatment. Due to the large intersubject variability in the responses to optimized tDCS, this behavioral improvement was not found to be statistically significant.
The pilot study consisted of behavioral treatment administered in conjunction with the two variants of tDCS. During the stimulation, subjects receive a self-administered computerized treatment in which an audio stimulus is paired with a picture. The task is to indicate with a button press whether the two stimuli are a match. Relative to baseline, accuracy improved by 8.1 ± 4.4 words after the conventional treatment, and by 11.2 ± 7.9 after the optimized treatment (Fig. 4, Panel B). 5 (2) of the 8 subjects obtained a higher (lower) accuracy improvement following the optimized treatment, with 1 subject scoring identically after each. The difference between accuracy improvements following the optimized and conventional treatments was not found to be statistically significant using a paired t-test (p = 0.27).
4. Discussion
This work examined the application of individualized, MRI-based modeling of transcranial current flow to a clinical pilot study examining the use of tDCS to augment rehabilitation after stroke. For each study participant, a volume conduction model was developed and employed to derive the electrode montage which maximized the electric field magnitude at a functionally derived target (Figure 1). The magnitude of the electric fields achieved by these optimal montages was found to be 64% higher than that attained by the conventional designs (Figure 2). A sensitivity analysis revealed that while the optimal placement of electrodes depends strongly on the precise location of the target, the resulting electric field magnitude at the target is robust to such perturbations of the target co-ordinates (Figure 3).
The cellular mechanism long assumed to underlie the therapeutic benefits of tDCS is the polarization of neuronal membranes (Creutzfeldt et al., 1962; Bindman et al., 1964), which varies linearly with the local electric field (Bikson et al., 2004). For CA1 neurons in rat hippocampus, the mean polarization was found to be 0.12 mV per unit of electric field (Bikson et al., 2004; Radman et al., 2007). Similar values (0.18 mV per V/m) have been reported in CA3 neurons (Deans et al., 2007). Pyramidal cells may polarize more, as Radman et al. (2007) found a polarization of 0.27 mV per V/m of applied field in the rat motor cortex. Here, we predicted that optimizing the electrode montage will result in a 64% increase in the electric field magnitude at the target.
Subjects participating in the pilot study scored 38% higher on the behavioral task following the optimized treatment (i.e., 11% versus 8%). Due to the large across-subject variability in the responses of the subjects to the optimized treatment, however, this difference was not found to be statistically significant. The question is then whether the behavioral responses to optimized tDCS are indeed stronger than those to the conventional treatment but failed to be resolved here due to the small sample size, or whether we simply measured “noise” (i.e., there is no behavioral advantage of increasing the field strength at the target). The small pilot study here represents the first known attempt at investigating the clinical effects of optimized tDCS, and only further studies can provide an answer to this question.
It is logical to assume that since neuronal polarization is behind the therapeutic benefits of tDCS, that stronger polarization would increase the probability of observing desired behavioral effects (i.e., improved accuracy). This is even more plausible given that tDCS operates in the sub-threshold range, with the achieved deflections in membrane potential representing less than 2% of that required for action potential generation. However, the emergence of cognitive improvements reflects a complex interaction between a multitude of factors: endogenous network activity, the specificity of the behavioral paradigm, and potentially even genetic factors, which may play a role by modulating the level of tDCS-induced plasticity (Fritsch et al., 2010). These factors were not controlled for in the present study. There is also the question of whether our choice of a target is in fact “optimal” in its own right: the approach described here assumes a single, focal target region (a 3 mm neighborhood). Another strategy would be to rather direct current flow across a broader region, thus “hedging one's bets” and affecting larger neural networks. If data-driven target selection, as performed in this study via fMRI is not available, such broader stimulation may be a reasonable choice.
Robustness is an important aspect of modeling tDCS current flow. The finding obtained here is nuanced: strictly speaking, the optimal montage is not robust to perturbations of the target co-ordinates. However, the optimized electric field magnitude at the target is robust to such perturbations. Thus, while the paths taken by optimal currents differ, the amount of current impinging on the target region is in fact consistent within a small vicinity (i.e., 3 mm). This seems to suggest that modeling individualized anatomy and determining the target vicinity is more important than precisely localizing the target.
The unanticipated current flow produced by the conventional montage of Subject 5 illustrates the problem with the conventional electrode placement in tDCS: without taking into account the idiosyncratic nature of the lesion, the current injected into the head largely avoids passing through the target region. Moreover, it is difficult to intuitively predict the result of the optimization, which uses highly-conductive lesions and ventricles to guide the current to the target region.
Ultimately, only when the physiological mechanisms of non-invasive electric stimulation are elucidated will we have strict guidelines for the type of stimulation (magnitude and direction of induced electric fields) required for effective neuromodulation. If maximal stimulation of the targeted structures is desired, it appears that MRI-guided optimization techniques will be required to identify the optimal montages on an individualized basis. In this regard, future progress should no longer be impeded by a lack of technical sophistication.
References
- Ambrus GG, Antal A, Paulus W. Comparing cutaneous perception induced by electrical stimulation using rectangular and round shaped electrodes. Clinical neurophysiology: official journal of the International Federation of Clinical Neurophysiology. 2011;122:803–807. doi: 10.1016/j.clinph.2010.08.023. [DOI] [PubMed] [Google Scholar]
- Baker JM, Rorden C, Fridriksson J. Using transcranial Direct-Current stimulation to treat stroke patients with aphasia. Stroke. 2010;41:1229–1236. doi: 10.1161/STROKEAHA.109.576785. [DOI] [PMC free article] [PubMed] [Google Scholar]
- Bikson M, Inoue M, Akiyama H, Deans JK, Fox JE, Miyakawa H, Jefferys JGR. Effects of uniform extracellular DC electric fields on excitability in rat hippocampal slices in vitro. The Journal of Physiology. 2004;557:175–190. doi: 10.1113/jphysiol.2003.055772. [DOI] [PMC free article] [PubMed] [Google Scholar]
- Bindman LJ, Lippold OCJ, Redfearn JWT. The action of brief polarizing currents on the cerebral cortex of the rat (1) during current flow and (2) in the production of long-lasting after-effects. The Journal of Physiology. 1964;172:369–382. doi: 10.1113/jphysiol.1964.sp007425. [DOI] [PMC free article] [PubMed] [Google Scholar]
- Boyd S, Vandenberghe L. Convex Optimization. Cambridge University Press; 2004. [Google Scholar]
- Creutzfeldt OD, Fromm GH, Kapp H. Influence of transcortical d-c currents on cortical neuronal activity. Experimental neurology. 1962;5:436–452. doi: 10.1016/0014-4886(62)90056-0. [DOI] [PubMed] [Google Scholar]
- CVX Research I. CVX: Matlab software for disciplined convex programming, version 2.0 beta. 2012 http://cvxr.com/cvx.
- Datta A, Bansal V, Diaz J, Patel J, Reato D, Bikson M. Gyri-precise head model of transcranial direct current stimulation: improved spatial focality using a ring electrode versus conventional rectangular pad. Brain stimulation. 2009;2:201–207. 207.e1. doi: 10.1016/j.brs.2009.03.005. [DOI] [PMC free article] [PubMed] [Google Scholar]
- Deans JK, Powell AD, Jefferys JGR. Sensitivity of coherent oscillations in rat hippocampus to AC electric fields. The Journal of physiology. 2007;583:555–565. doi: 10.1113/jphysiol.2007.137711. [DOI] [PMC free article] [PubMed] [Google Scholar]
- Delorme A, Makeig S. EEGLAB: an open source toolbox for analysis of single-trial EEG dynamics including independent component analysis. Journal of Neuroscience Methods. 2004;134:9–21. doi: 10.1016/j.jneumeth.2003.10.009. [DOI] [PubMed] [Google Scholar]
- Dmochowski JP, Bikson M, Parra LC. The point spread function of the human head and its implications for transcranial current stimulation. Physics in Medicine and Biology. 2012;57:6459–6477. doi: 10.1088/0031-9155/57/20/6459. [DOI] [PMC free article] [PubMed] [Google Scholar]
- Dmochowski JP, Datta A, Bikson M, Su Y, Parra LC. Optimized multi-electrode stimulation increases focality and intensity at target. Journal of Neural Engineering. 2011;8:046011. doi: 10.1088/1741-2560/8/4/046011. [DOI] [PubMed] [Google Scholar]
- Evans A, Collins D, Mills S, Brown E, Kelly R, Peters T. 3D statistical neuroanatomical models from 305 MRI volumes. Nuclear Science Symposium and Medical Imaging Conference, 1993, 1993 IEEE Conference Record. 1993;3:1813–1817. [Google Scholar]
- Fregni F, Boggio PS, Mansur CG, Wagner T, Ferreira MJL, Lima MC, Rigonatti SP, Marcolin MA, Freedman SD, Nitsche MA, Pascual-Leone A. Transcranial direct current stimulation of the unaffected hemisphere in stroke patients. Neuroreport. 2005;16:1551–1555. doi: 10.1097/01.wnr.0000177010.44602.5e. [DOI] [PubMed] [Google Scholar]
- Fridriksson J, Richardson JD, Baker JM, Rorden C. Transcranial direct current stimulation improves naming reaction time in fluent aphasia: a double-blind, sham-controlled study. Stroke; a journal of cerebral circulation. 2011;42:819–821. doi: 10.1161/STROKEAHA.110.600288. [DOI] [PMC free article] [PubMed] [Google Scholar]
- Fritsch B, Reis J, Martinowich K, Schambra HM, Ji Y, Cohen LG, Lu B. Direct current stimulation promotes BDNF-Dependent synaptic plasticity: Potential implications for motor learning. Neuron. 2010;66:198–204. doi: 10.1016/j.neuron.2010.03.035. [DOI] [PMC free article] [PubMed] [Google Scholar]
- Grant M, Boyd S. Graph implementations for nonsmooth convex programs. In: Blondel V, Boyd S, Kimura H, editors. Recent Advances in Learning and Control. Springer-Verlag Limited; 2008. pp. 95–110. Lecture Notes in Control and Information Sciences. [Google Scholar]
- Griffiths DJ. Introduction to Electrodynamics. 3rd. Addison Wesley; 1999. [Google Scholar]
- Holdefer RN, Sadleir R, Russell MJ. Predicted current densities in the brain during transcranial electrical stimulation. Clinical neurophysiology. 2006;117:1388–1397. doi: 10.1016/j.clinph.2006.02.020. [DOI] [PMC free article] [PubMed] [Google Scholar]
- Hummel F, Celnik P, Giraux P, Floel A, Wu W, Gerloff C, Cohen LG. Effects of non-invasive cortical stimulation on skilled motor function in chronic stroke. Brain. 2005;128:490–499. doi: 10.1093/brain/awh369. [DOI] [PubMed] [Google Scholar]
- Hummel FC, Cohen LG. Non-invasive brain stimulation: a new strategy to improve neurorehabilitation after stroke? The Lancet Neurology. 2006;5:708–712. doi: 10.1016/S1474-4422(06)70525-7. [DOI] [PubMed] [Google Scholar]
- Klem GH, Lders HO, Jasper HH, Elger C. The ten-twenty electrode system of the international federation. the international federation of clinical neurophysiology. Electroencephalography and clinical neurophysiology Supplement. 1999;52:3–6. [PubMed] [Google Scholar]
- Liebetanz D, Koch R, Mayenfels S, Knig F, Paulus W, Nitsche MA. Safety limits of cathodal transcranial direct current stimulation in rats. Clinical Neurophysiology. 2009;120:1161–1167. doi: 10.1016/j.clinph.2009.01.022. [DOI] [PubMed] [Google Scholar]
- Miranda PC, Lomarev M, Hallett M. Modeling the current distribution during transcranial direct current stimulation. Clinical neurophysiology. 2006;117:1623–1629. doi: 10.1016/j.clinph.2006.04.009. [DOI] [PubMed] [Google Scholar]
- Monti A, Cogiamanian F, Marceglia S, Ferrucci R, Mameli F, Mrakic-Sposta S, Vergari M, Zago S, Priori A. Improved naming after transcranial direct current stimulation in aphasia. Journal of Neurology, Neurosurgery & Psychiatry. 2008;79:451–453. doi: 10.1136/jnnp.2007.135277. [DOI] [PubMed] [Google Scholar]
- Neuling T, Wagner S, Wolters CH, Zaehle T, Herrmann CS. Finite element model predicts current density distribution for clinical applications of tdcs and tacs. Frontiers in Psychiatry. 2012;3 doi: 10.3389/fpsyt.2012.00083. [DOI] [PMC free article] [PubMed] [Google Scholar]
- Nitsche MA, Boggio PS, Fregni F, Pascual-Leone A. Treatment of depression with transcranial direct current stimulation (tDCS): a review. Experimental Neurology. 2009;219:14–19. doi: 10.1016/j.expneurol.2009.03.038. [DOI] [PubMed] [Google Scholar]
- Nitsche MA, Doemkes S, Karakse T, Antal A, Liebetanz D, Lang N, Tergau F, Paulus W. Shaping the effects of transcranial direct current stimulation of the human motor cortex. Journal of Neurophysiology. 2007;97:3109–3117. doi: 10.1152/jn.01312.2006. [DOI] [PubMed] [Google Scholar]
- Nitsche MA, Paulus W. Excitability changes induced in the human motor cortex by weak transcranial direct current stimulation. The Journal of physiology. 2000;527(Pt 3):633–639. doi: 10.1111/j.1469-7793.2000.t01-1-00633.x. [DOI] [PMC free article] [PubMed] [Google Scholar]
- Radman T, Su Y, An JH, Parra LC, Bikson M. Spike timing amplifies the effect of electric fields on neurons: implications for endogenous field effects. The Journal of neuroscience: the official journal of the Society for Neuroscience. 2007;27:3030–3036. doi: 10.1523/JNEUROSCI.0095-07.2007. [DOI] [PMC free article] [PubMed] [Google Scholar]
- Richardson J, Fridriksson J, Datta A, Dmochowski J, Parra L. High-definition transcranial direct current stimulation (hd-tdcs) to enhance computerized treatment outcomes in persons with aphasia: A feasibility study. Brain ?:??–??. doi: 10.3233/NRE-141199. submitted. [DOI] [PMC free article] [PubMed] [Google Scholar]
- Schlaug G, Renga V. Transcranial direct current stimulation: a noninvasive tool to facilitate stroke recovery. Expert review of medical devices. 2008;5:759–768. doi: 10.1586/17434440.5.6.759. [DOI] [PMC free article] [PubMed] [Google Scholar]
- Schlaug G, Renga V, Nair D. Transcranial direct current stimulation in stroke recovery. Archives of Neurology. 2008;65:1571–1576. doi: 10.1001/archneur.65.12.1571. [DOI] [PMC free article] [PubMed] [Google Scholar]