

Abstract
Objective
Tea has been suggested to decrease blood glucose levels and protect pancreatic β cells in diabetic mice. However, human epidemiological studies showed inconsistent results for the association between tea consumption and type 2 diabetes mellitus (T2DM) risk. The aim of this study was to conduct a meta-analysis to further explore the association between tea consumption and incidence of T2DM.
Design
Systematic review and meta-analysis.
Methods
We performed a systematic literature search up to 30 August 2013 in PubMed, EMBASE, Chinese Wanfang Database and CNKI database. Pooling relative risks (RRs) were estimated by random-effect models. Two kinds of subgroup analyses (according to sex and regions) were performed. Sensitive analyses were performed according to types of tea.
Results
Overall, no statistically significant relationship between tea consumption and risk of T2DM was found based on 12 eligible studies (pooling RR 0.99, 95% CI 0.95 to 1.03). Compared with the lowest/non-tea group, daily tea consumption (≥3 cups/day) was associated with a lower T2DM risk (RR 0.84, 95% CI 0.73 to 0.97). Subgroup analyses showed a difference between men and women. Overall, the RRs (95% CI) were 0.92 (0.84 to 1.00) for men, and 1.00 (0.96 to 1.05) for women, respectively. Tea consumption of ≥3 cups/day was associated with decreased T2DM risk in women (RR 0.84, 95% CI 0.71 to 1.00). Overall, the RRs (95% CIs) were 0.84 (0.71 to 1.00) for Asians, and 1.00 (0.97 to 1.04) for Americans and Europeans, respectively. No obvious change was found in sensitivity analyses.
Conclusions
The results suggest that daily tea consumption (≥3 cups/day) is associated with a lower T2DM risk. However, further studies are needed to enrich related evidence, especially with regard to types of tea or sex.
Keywords: Epidemiology
Strengths and limitations of this study.
This updated meta-analysis shows that daily tea consumption (≥3 cups/day) is associated with a lower type 2 diabetes mellitus (T2DM) risk.
The subgroup analysis is the first report to show the differences between different regions (Asia, America and Europe). Subgroup analysis also showed a difference between men and women with regards to tea consumption and T2DM risk.
The major limitation of this study is that the research included in our meta-analysis had different categories for tea consumption and we were not able to conduct stratified analysis on the association of consumption of different tea types with T2DM risk.
Introduction
Tea is the most widely consumed beverage in the world, next to water.1 Depending on the basic manufactured process, tea can be classified as green, black and oolong tea.2 About 76–78% of the tea consumed worldwide is black tea, which is the main tea beverage consumed in the USA and European countries. Green tea is usually consumed in Asian countries including China, Korea, Japan and others (20–22% of tea consumption). The remaining 2% is oolong tea, which is popular in south-eastern China.3 The three non-herbal teas have different qualitative and quantitative chemicals. Green tea contains more of chemically simpler antioxidants (including epigallocatechin gallate, EGCG), while black tea and oolong tea contain more complex antioxidants, including theaflavins and thearubigins.4
According to the latest report from the WHO, about 347 million people worldwide have diabetes mellitus (DM), from which total deaths are projected to rise by more than 50% in the next 10 years. Type 2 DM (T2DM) accounts for approximately 90% of all diabetes worldwide. Nearly 26 million people aged ≥20 years in the USA have been diagnosed with DM, among which the vast majority (90–95%) had T2DM.5 T2DM is often associated with high morbidities and mortalities due to different types of cardiovascular diseases, resulting in heavy financial burden on patients with T2DM, that is, about US$174 billion cost for DM in the USA in 2007.6 7
It is well known that dietary factors play important roles in the control and prevention of T2DM.8 Some previous studies have suggested that tea may have protective effect against DM. Green tea extract decreases the levels of hyperglycaemia and hyperinsulinaemia in an animal model of insulin resistance.9 Black tea extract helps in the regeneration of damaged pancreas and protects pancreatic β cells in the streptozotocin-induced mice with diabetes.10 As the major polyphenolic constituent in green tea, EGCG can delay the onset of T1DM in spontaneous non-obese mice with diabetes, reduce blood glucose levels and ameliorate the decrease of pancreatic islet mass in the streptozotocin-induced mice with diabetes, and attenuate high glucose-induced harmful effects in other animal and cell models.11–15
Over the last decade, several epidemiological studies were carried out to investigate the association between tea consumption and T2DM risk. However, the results were not always consistent. Some studies found that tea consumption might reduce T2DM risk,16–21 while the others did not find similar associations.22 23 An earlier meta-analysis suggested that the highest level of tea consumption is associated with a lower T2DM risk.4 However, that study neither analysed the potential difference of such influence from tea consumption in different regions nor explored the potential influence of the types of tea on T2DM risk. Meanwhile, some new studies on the association between tea consumption and T2DM risk are available21–28 and some studies even showed contrary results.23 24 26 The association between tea consumption and T2DM risk is still worthy of further clarification. Therefore, we conducted this meta-analysis to pool the current evidence from all eligible cohort studies so as to explore the association between tea consumption and T2DM risk.
Methods
Literature search strategy
To search for the cohort studies on the relationship between tea consumption and the risk of T2DM incident, we searched PubMed (http://www.ncbi.nlm.nih.gov/pubmed) and EMBASE (http://www.embase.com) in English, and Chinese Wanfang Database (http://www.wanfangdata.com.cn/), and China National Knowledge infrastructure (CNKI) in Chinese (30 August 2013). There were no criteria for the time period, age or country restrictions included in the papers. Medical subject-heading terms identifying articles were used as follows: ‘tea’, ‘black tea’, ‘green tea’, ‘oolong tea’, ‘EGCG’, ‘thearubigin’, ‘theaflavin’, ‘camelia sinensis’, ‘flavonoid’, or ‘catechin’ combined with ‘diabetes’, ‘diabetes mellitus’, and ‘DM’ in the full-text option. The titles and abstracts were screened first to exclude those, which were clearly irrelevant. Full contents of the remaining articles were then selected according to the pre-established criteria. Furthermore, references of the received articles were also searched.
Selection criteria
Studies included in this meta-analysis were selected based on the following criteria: (1) these were cohort studies; (2) these involved the consumption of natural tea products and not tea extract or supplements; (3) the exposure of interest should be tea consumption and the outcome of interest should be the incidence of T2DM, which was diagnosed by self-reports and/or medical records; (4) the relative risk (RR) with the corresponding 95% CI (or sufficient data to calculate it) for different frequencies of tea intake were reported; (5) the frequency of tea intake was classified according to the number of cups of tea consumed per day. If a study provided separate RR estimates for men and women, we treated them as two different studies. If a study provided multiple models, the multivariate-adjusted model, which included all the potential confounding variables in the study, was selected. Reports focusing on T1DM or animal studies were excluded. If publications were duplicated or shared in more than one study, either the former or the one without multivariate-adjusted estimates was excluded. Study quality was assessed by using the NOS for cohort studies.29
Data extraction and statistical analysis
Two reviewers (JY and Q-XM) independently searched and screened all the potential related studies. Any disagreement was resolved by discussion with the other reviewers. For each eligible study included in this meta-analysis, the following information was extracted: the first author's name, the year of publication, country where the study was performed, study population, sex, follow-up time, sample size, definition of cases, number of cases, type of tea, the information of tea consumption, RR and the corresponding 95% CI, and variables adjusted for in the statistical analysis. Study-specific RR (95% CI) for highest versus non/lowest tea consumption levels were also extracted from the publications.
In most of the included studies, tea consumption is assessed regarding the number of cups of tea consumed daily except for the study of Odegaard et al, in which the tea consumption was described as ‘weekly’ or ‘daily’. In this study, participants were asked to choose the intake frequency of tea from nine predefined categories (never or hardly ever, 1–3 times/month, once a week, 2–3 times/week, 4–6 times/week, once a day, 2–3 times/day, 4–5 times/day and ≥6 times/day). The standard serving size was assigned on the questionnaire as one cup. We, therefore, assessed the ‘weekly’ tea consumption (including once a week, 2–3 times/week, 4–6 times/week) as <1 cup/day and ‘daily’ tea consumption (including once a day, 2–3 times/day, 4–5 times/day and ≥6 times/day) as ≥1 cup/day.20 The studies regarded non-tea consumption per day as the baseline (RR 1.0) of tea consumption except for two studies, in which ‘<1 cup/week’ or ‘Never or monthly tea consumption’ was used as baseline.19 20 So in our study, we considered the frequency of ‘<1 cup/week’ or ‘Never or monthly tea consumption’ as equivalent to non-tea consumption per day.
We used the z-test to test if RR=1. The random-effect models were used in the meta-analysis. Participants’ frequencies of tea consumption were classified as non/lowest, 0–1, 1–3 and ≥4 cups/day. The non/lowest tea consumption group was regarded as the reference in all the models. Statistical heterogeneity among studies was assessed with the Q and I2 statistics.
Stratified analysis was performed by the frequency of tea consumption. In the first model, pooling RR was estimated according to all the eligible individual studies (0–1, 1–3 and ≥4 cups/day tea consumption groups vs the reference). In order to further explore the relationship between the higher tea consumption and T2DM, the second model was performed, in which, the ≥3 cups/day of tea consumption group was compared with the reference, allowing more studies to be included.
In the subgroup analysis according to sex, we first conducted the comparison among 0–1, 1–3 and ≥4 cups/day of tea consumption groups and the reference group, then between ≥3 cups/day of tea consumption group and the reference. Another subgroup analysis was performed according to regions (Asian, American and European groups). Since just two study populations with ≥3 cups/day of tea consumption were included in the Asian group, we only did the comparison among 0–1, 1–3 and ≥4 cups/day of tea consumption groups and the reference in both regions.
Potential publication bias was assessed by the funnel plots of each trial's effect size against the inverse SE. Funnel plot asymmetry was evaluated by the Egger linear regression test. Sensitivity analysis was performed to explore the potential different influence from the types of tea on T2DM risk. All statistical analyses were performed by the STATA statistical software (V.8.0; STATA Corporation, College Station, Texas, USA). The tests were two-sided, and statistical significance was set at p<0.05.
Results
Results of literature search
The flow diagram of the procedure used to identify the relevant studies is shown in figure 1. A total of 519 potentially relevant papers were retrieved with the systematic search. Based on the predefined selection criteria, 499 articles were excluded for different reasons such as laboratory studies and reviews. Twenty potentially relevant studies were initially selected.16–28 30–36 After the evaluation of the full texts, eight studies were excluded. One of them categorised tea consumption based on the frequency ‘time/day’ of drinking and did not assign the standard serving size as one cup,23 whereas another defined it in the volume (mL/day) of drinking24; two articles were excluded because the baseline of RR was <1 cup/day21 31; three articles lacked sufficient details for inclusion in meta-analysis22 30 33; one was also excluded because it was based on the nested case–control study.27 Thus, 12 studies were selected for the further analysis in this study.16–20 25 26 28 32 34–36
Figure 1.

Flow diagram describing search results of the systematic review (identification, screening eligibility, inclusion).
Characteristics of included studies
All of the 12 papers that were included in this meta-analysis involved cohort studies (properties are summarised in table 1). Six of them were conducted in USA,16–18 25 32 34 three in Asia19 20 26 and three in Europe.28 35 36 A total of 761 949 participants were included in these studies, with 29 981 incident cases of new-onset T2DM. Mean age of the participants at baseline ranged from 17 to 88 years, and the median duration of follow-up times from these studies ranged from 3.4 to 18 years. Study quality assessment is shown in table 2.
Table 1.
Overview of eligible cohort studies on tea consumption in association with (T2DM) risk
| Study | Country | Design | Follow-up (years) | Sex | Age range (years) | T2DM definition/assessment | Sample size | Case | Tea | Tea consumption (cup/day) | RR/OR (95% CI) | Adjustment factor |
|---|---|---|---|---|---|---|---|---|---|---|---|---|
| Salazar-Martinez et al32 (Health Professionals Follow-up Study and Nurses’ Health Study) | USA | Cohort | 12 | M | 40–75 | NDDG diagnostic criteria, self-report, confirmed by medical records | 41 934 | 1333 | Tea | 0 <1 1–3 ≥4 |
1.00 0.92 (0.81 to 1.04) 0.97 (0.82 to 1.14) 1.02 (0.59 to 1.78) |
Age, total caloric intake, family history of diabetes, alcohol, smoking, menopausal status and postmenopausal hormone use, intakes of glycaemic load, trans-fat, polyunsaturated fatty acid, cereal fibre, magnesium, BMI, physical activity |
| 18 | F | 84 276 | 4085 | 0 <1 1–3 ≥4 |
1.00 1.05 (0.97 to 1.15) 1.01 (0.92 to 1.11) 0.91 (0.72 to 1.16) |
|||||||
| Greenberg et al16 (First National Health and Nutrition Examination Survey Epidemiologic Follow-Up Study) | USA | Cohort | 8.4 | M and F | 32–88 | Self-report of doctor's diagnosis | 7006 | 309 | Tea | 0 ≤1 1–2 >2 |
1.00 0.76 (0.54 to 1.09) 0.67 (0.36 to 1.28) 0.34 (0.15 to 0.76) |
Per-capita income, educational level, race, gender, physical activity, smoking, alcohol, BMI, age, type of diet |
| Song et al 17 (The Women's Health Study) | USA | Cohort | 8.8 | F | ≥45 | ADA criteria, self-report, confirmed by supplemental diabetes questionnaire and contact with their primary care physician | 38 018 | 1614 | Tea | 0 <1 1–3 ≥4 |
1.00 1.07 (0.95 to 1.21) 1.05 (0.91 to 1.21) 0.72 (0.52 to 1.01) |
Age, BMI, total energy intake, smoking, exercise, alcohol, history of hypertension, history of high cholesterol, family history of diabetes, fibre intake, glycaemic load, magnesium, and total fat intake |
| van Dam et al34 (Nurses’ Health Study II) | USA | Cohort | 10 | F | 26–46 | NDDG criteria, ADA criteria, self-report, confirmed by medical record review | 88 259 | 1263 | Tea | 0 <1 1 2–3 ≥4 |
1.00 0.97 (0.83 to 1.12) 1.17 (0.97 to 1.40) 0.98 (0.79 to 1.20) 0.88 (0.64 to 1.23) |
Age, smoking, BMI, physical activity, alcohol, use of hormone replacement therapy, oral contraceptive, family history of T2DM, history of hypertension, history of hypercholesterolaemia, sugar-sweetened soft drinks, punch, quintiles of processed meat consumption, polyunsaturated-to-saturated fat intake ratio, total energy intake, glycaemic index, cereal fibre intake |
| Hu et al35 | Finland | Cohort | 13.4 13.4 |
M F |
35–74 35–74 |
WHO criteria, incident cases were ascertained from the NHDR and the NSIIDR | 10 188 11 197 |
517 447 |
Tea | 0 1–2 ≥3 0 1–2 ≥3 |
1.00 0.89 (0.71 to 1.11) 0.83 (0.59 to 1.17) 1.00 0.92 (0.74 to 1.15) 0.85 (0.57 to 1.27) |
Age, study year, education, systolic blood pressure, bread, vegetable, fruit, sausage, coffee, tea, alcohol, smoking, physical activity, BMI |
| Pereira et al18 (Iowa Women's Health Study) | USA | Cohort | 11 | F | 55–69 | 4 follow-up mailed surveys, self-report | 28 812 | 1418 | Tea | 0 >1 1–3 ≥4 |
1.00 1.01 (0.86 to 1.19) 1.02 (0.91 to 1.15) 0.64 (0.4 to 1.03) |
Age, education, hypertension, alcohol, smoking, cigarette pack-years, BMI, waist-to-hip ratio, physical activity, energy intake, total fat, Keys score, cereal fibre, soda consumption, magnesium and phytate intake |
| Iso et al19 (Japan Collaborative Cohort Study for Evaluation of Cancer Risk) | Japan | Cohort | 5 | M | 40–65 | FPG ≥7.8 mmol/L, or randomly measured concentration of ≥11.1 mmol/L, or treatment with oral hypoglycaemic agents or insulin to indicate new cases of DM, self-report | 6727 | 231 | Green tea green tea |
<1 1–2 3–5 ≥6 <1 1–2 3–5 ≥6 |
1.00 0.82 (0.47 to 1.41) 1.12 (0.71 to 1.76) 0.91 (0.55 to 1.52) |
Age, BMI, family history of DM, smoking, alcohol, magnesium intake, hours of walking, hours of exercise, consumption of other beverages |
| 5 | F | 40–65 | 10 686 | 213 |
|
1.00 0.66 (040 to 1.08) 0.61 (0.41 to 0.91) 0.49 (0.30 to 0.79) |
||||||
| Hamer et al36 (Whitehall II study) | UK | Cohort | 11.7 | M and F | 35–55 | OGTT, diabetic medication, self-report of doctor's diagnosis | 5823 | 387 | Tea | 0 ≤1 2–3 >3 |
1.00 1.08 (0.75 to 1.56) 0.81 (0.56 to 1.17) 0.77 (0.52 to 1.14) |
Age, gender, ethnicity, employment grade, BMI, waist-to-hip ratio, smoking, gender-specific alcohol intake, physical activity, family history diabetes, hypertension, cholesterol, total energy intake, diet pattern, mutual adjustment for all beverage type |
| Odegaard et al20 (Singapore Chinese Health Study) | Singapore | Cohort | 5.7 | M and F | 45–74 | DRICD codes, self-report, ascertained by hospital records or telephone interview | 36 908 | 1889 | Green tea | 0 Weekly Daily |
1.00 1.03 (0.91, 1.16) 1.06 (0.90, 1.25) |
Age, year of interview, sex, dialect, education, hypertension, smoking, alcohol, BMI, physical activity, dietary variables, magnesium and caffeine |
| Boggs et al25 (Black Women's Health Study) | USA | Cohort | 12 | F | 30–69 | Self-report, confirmed by medical records | 46 906 | 3671 | tea | 0 <1 1 2–3 ≥4 |
1.00 1.04 (0.96 to 1.13) 0.99 (0.87 to 1.12) 1.12 (0.97 to 1.30) 1.14 (0.92 to 1.42) |
Age, questionnaire cycle, energy intake, education, family history of diabetes, vigorous activity, smoking, glycaemic index, cereal fibre, sugar-sweetened soft drinks, BMI, history of hypertension, history of high cholesterol |
| Hayashino et al26 (High-risk and Population Strategy for Occupational Health Promotion Study) | Japan | Cohort | 3.4 | M | 17–71 | ADA criteria, WHO criteria, blood test and self-administered questionnaire | 4975 | 201 | Oolong tea | 0 1 ≥2 |
1.00 0.81 (0.55 to 1.20) 1.46 (1.01 to 2.10) |
Age, BMI, physical activity, alcohol, family history of diabetes, hypertension, smoking, vegetable intake, sweetened beverage, fat-intake, health promotion intervention |
| The InterAct28 Consortium (EPIC-InterAct project) | Spain Italy Sweden FranceDenmark Germany Netherlands UK | Case-Cohort | 6.9 | M and F | 20–79 | Self-report, hospital admissions, linkage to care registers or drug registers | 340 234 | 12 403 | Tea | 0 <1 1–<4 ≥4 |
1.00 1.03 (0.91 to 1.16) 0.93 (0.81 to 1.05) 0.84 (0.71 to 1.00) |
Sex, smoking status, physical activity level, education level, intake of energy, protein, carbohydrates, saturated fatty acids, mono-unsaturated fatty acids, poly-unsaturated fatty acids, alcohol and fibre, intake of coffee, juices, soft-drinks and milk, body mass index |
ADA, American Diabetes Association; BMI, body mass index; DM, diabetes mellitus; DRICD, diabetes-related International Classification of Diseases; FPG, fasting plasma glucose level; NHDR, National Hospital Discharge Register; NDDG, National Diabetes Data Group; NSIIDR, National Social Insurance Institution's Drug Register; OGTT, oral glucose tolerance test; RR, relative risk; T2DM, Type 2 Diabetes Mellitus.
Table 2.
Quality assessment for the eligible studies according to the NOS
| ID | First author | Selection* | Comparability* | Outcome* |
|---|---|---|---|---|
| 1 | Salazar-Martinez | 4 | 2 | 2 |
| 2 | Greenberg | 4 | 2 | 1 |
| 3 | Song | 4 | 2 | 2 |
| 4 | van Dam | 4 | 2 | 2 |
| 5 | Hu | 4 | 2 | 3 |
| 6 | Pereira | 4 | 2 | 2 |
| 7 | Iso | 4 | 2 | 2 |
| 8 | Hamer | 4 | 2 | 2 |
| 9 | Odegaard | 4 | 2 | 2 |
| 10 | Boggs | 4 | 2 | 2 |
| 11 | Hayashino | 4 | 2 | 2 |
| 12 | InterAct Consortium | 4 | 2 | 2 |
A study was awarded a maximum of one star for each numbered item within the selection and outcome categories. Therefore, a maximum of four stars were given for selection, three stars for outcome. A maximum of two stars were given for comparability. More stars mean higher quality of the eligible studies.
*Means the number of stars.
Effect of tea consumption on risk of T2DM
Random-effect model was used (Pheterogeneity=0.071, I2=27.0%). Overall, no statistically significant relationship between tea consumption and risk of T2DM was found according to 12 eligible studies (pooling RR 0.99, 95% CI 0.95 to 1.03, p=0.549). No statistically significant relationship was found in any stratified group, except for the comparison between the highest tea consumption (≥4 cups/day) group and the non-consumption/lowest consumption group (the reference). The corresponding RRs (95% CIs) and p values were 1.01 (0.96 to 1.06), 0.729 for <1 cup/day group versus the reference, 1.01 (0.97 to 1.05), 0.700 for 1–3 cup/day group versus the reference, and 0.84 (0.71 to 0.99), 0.036 for ≥4 cups/day group versus the reference, respectively (figure 2A).
Figure 2.

Forest plots of RR (relative risk) with 95% CI of T2DM associated with the tea consumption stratified (A) by the frequency of tea consumptiona in random model and (B) by random-effect model (≥3 cups/day of tea consumption vs the reference). aThe frequency of tea consumption was classified as non/lowest, 0–1, 1–3 and ≥4 cups/day. Non/lowest of tea consumption group was regarded as the reference. Black square means value of RR, and the size of the square means inversely proportional to its variance. Horizontal line means 95% CI of RR. Black diamond means pooled results. The studies were ordered by published year.
In the second model, RR (95% CI) was estimated according to nine eligible studies by random-effect method (Pheterogeneity=0.059, I2=42.5%). The results showed that daily tea consumption (≥3 cups/day) was associated with a lower T2DM risk, compared with the reference (RR 0.84, 95% CI 0.73 to 0.97, p=0.014) (figure 2B).
In subgroup analysis according to sex, a difference was found between men and women (RR 0.92, 95% CI 0.84 to 1.00, p=0.048 for men, and RR 1.00, 95% CI 0.96 to 1.05, p=0.889 for women) with regard to tea consumption and T2DM risk according to the random-effect models (Pheterogeneity=0.981, I2=0.0% for men; Pheterogeneity=0.029, I2=40.5% for women). No statistically significant relationship was found in any stratified group. In men, the corresponding RRs (95% CIs) and p values were 0.91 (0.81 to 1.03), 0.138 for <1 cup/day group versus the reference, 0.92 (0.81 to 1.04), 0.187 for 1–3 cup/day group versus the reference, and 0.96 (0.66 to 1.39), 0.826 for ≥4 cups/day group versus the reference (figure 3A). In women, the corresponding RRs (95% CIs) and p values were 1.03 (0.98 to 1.09), 0.250 for <1 cup/day group versus the reference, 1.03 (0.98 to 1.08), 0.321 for 1–3 cup/day group versus the reference, and 0.81 (0.65 to 1.01), 0.067 for ≥4 cups/day group versus the reference (figure 3B). Compared with the reference, the association between ≥3 cups/day of tea consumption and decreased T2DM risk was only in women. The corresponding RRs (95% CIs) were 0.94 (0.74 to 1.20), p=0.640 for men (Pheterogeneity=0.559, I2=0.0%), and 0.84 (0.71 to 1.00), p=0.049 for women (Pheterogeneity=0.063, I2=49.8%), respectively (figure 4A, B). Another subgroup analysis was performed according to different regions (Asia, America and Europe). Overall, the pooling RRs (95% CIs) and p values were 0.84 (0.71 to 1.00), 0.046 for Asian group (Pheterogeneity=0.024, I2=54.7%), and 1.00 (0.97 to 1.04), 0.813 for American and European group (Pheterogeneity=0.300, I2=11.1%) (figure 5A, B).
Figure 3.

Forest plots of RR (relative risk) with 95% CI of T2DM associated with the tea consumption stratified by the frequency of tea consumptiona (A) among men in random-effect model and (B) among women in random-effect model. aThe frequency of tea consumption was classified as non/lowest, 0–1, 1–3 and ≥4 cups/day. Non/lowest of tea consumption group was regarded as the reference. Black square means value of RR, and the size of the square means inversely proportional to its variance. Horizontal line means 95% CI of RR. Black diamond means pooled results. The studies were ordered by published year
Figure 4.
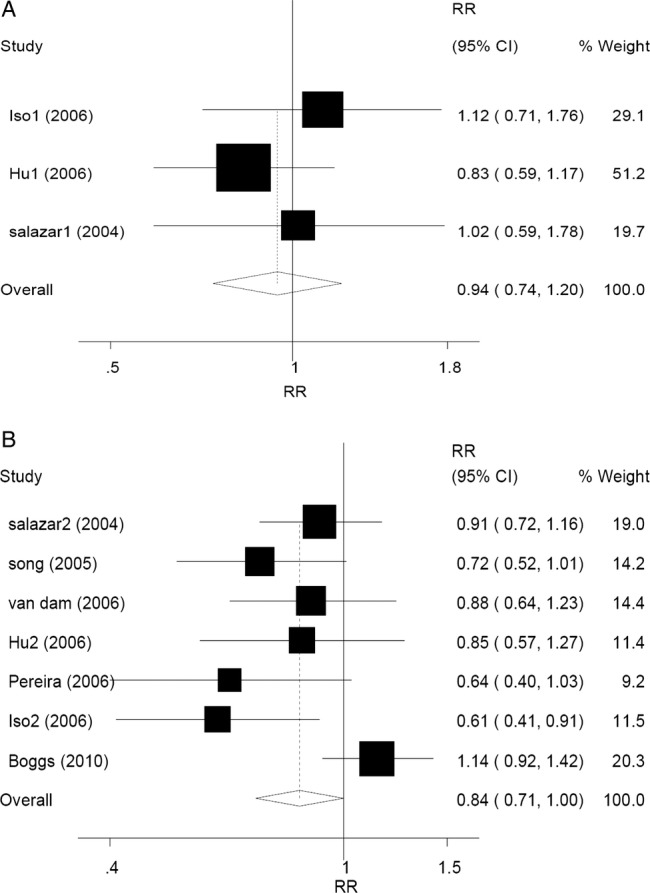
Forest plots of RR (relative risk) with 95% CI; of T2DM associated with the tea consumption (A) among men by random-effect model (≥3 cups/day of tea consumption vs the reference) and (B) among women by random-effect model (≥3 cups/day of tea consumption vs the reference). Black square means value of RR, and the size of the square means inversely proportional to its variance. Horizontal line means 95% CI of RR. Black diamond means pooled results. The studies were ordered by published year.
Figure 5.

Forest plots of RR (relative risk) with 95% CI of T2DM associated with the tea consumption stratified by the frequency of tea consumptiona among (A) Asian studies in random-effect model and (B) American and European studies in random-effect model. aThe frequency of tea consumption was classified as non/lowest, 0–1, 1–3 and ≥4 cups/day. Non/lowest of tea consumption group was regarded as the reference. Black square means value of RR, and the size of the square means inversely proportional to its variance. Horizontal line means 95% CI of RR. Black diamond means pooled results. The studies were ordered by published year.
Potential publication bias was estimated by Funnel plot (Begg’s test) and Egger's linear regression (p<0.001, figure 6). Sensitivity analyses were performed to explore the potential heterogeneity. After omitting those studies that mentioned clearly either green tea or oolong tea, no significant heterogeneity between the remaining studies was found (Pheterogeneity=0.058, I2=26.3%). At the same time, potential publication bias also decreased slightly (p=0.002). The pooling RRs (95% CIs) were not modified obviously (RR 0.99, 95% CI 0.96 to 1.02, p=0.495).
Figure 6.
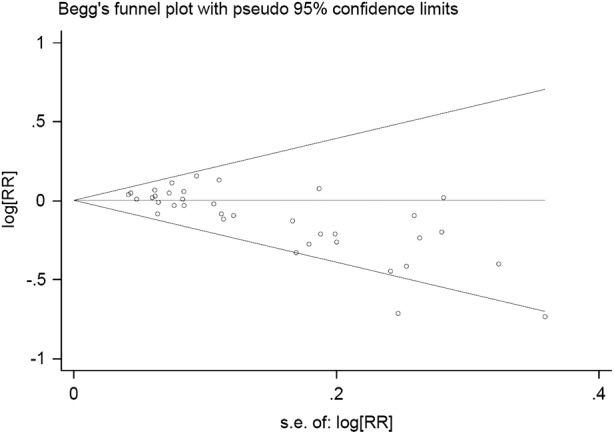
Begg's funnel plot of publication bias test. Log RR means the nature logarithm of RR (relative risk). Horizontal line means the summary estimate, while the sloping lines mean the expected 95% CI.
Discussion
Drinking tea has recently attracted scientific attention as a potential nutritional strategy to prevent a broad range of disorders. Over the last decade, many studies were conducted to investigate the association between tea consumption and DM risk.16–26 30–36 The studies included in our meta-analysis showed inconsistent results on the association between tea consumption and T2DM risk. Some papers showed moderately inverse associations,16–20 while others did not find statistically significant associations.25 32 34–36 Another paper even found a moderately positive association.26 Similar positive association has also been shown in two other studies which have not been included here.23 24 One possible reason could be that the participants who were at risk for diabetes or diagnosed with T2DM might have preferred to drink more green tea or oolong tea; these teas are commonly regarded as healthy beverages. The other possible reason may be the pesticide residue in tea. It is reported that 1,1,1-trichloro-2,2-bis(p-chlorophenyl)ethane (p,p′- DDT) was detected in tea.26 Higher blood DDT level has been confirmed to be associated with high prevalence of diabetes in the 1999–2002 National Health and Nutrition Examination Survey.37 Thus, pesticide residue in tea may be a possible mechanism.
Our meta-analysis did not find significant relationship between tea consumption and the risk of T2DM when we pooled the eligible data, including all different frequency groups of tea consumption. However, compared with the reference, ≥4 cups of tea consumption per day was associated with reduced T2DM risk by approximately 16%. To include more other studies to verify the effect and explore how much tea consumption would have a statistical effect on modifying the risk of T2DM, we performed a comparison between ≥3 cups/day and the reference and found that such frequency of tea consumption was associated with a decreased T2DM risk. Our results were slightly different from the previous studies, for example, Jing et al4 showed that ≥4 cups/day of tea consumption was associated with reduced T2DM risk, while Huxley et al38 showed that daily tea consumption (≥3–4 cups/day) was associated with a lower T2DM risk by approximately 15%.
Subgroup analyses according to sex showed a difference between men and women with regards to tea consumption and T2DM risk. One possible reason is that fewer studies focused on males in the articles selected for this study. Moreover, a possible biological explanation for the sex difference is that, in males, there is a higher prevalence of lower testosterone level in patients with T2DM than those without such disease.39 Tea intake increases total testosterone levels in male rats.40 It is possible that tea consumption may increase androgen levels and in turn decrease T2DM risk. In females, studies focusing on oestrogen use and T2DM risk show uncertain results.41 42 Moreover, the association between tea intake and oestrogen level is also controversial.43 44
Teas have various biological effects in different diseases. For example, green tea is more effective than black tea in improving the lipid profile, and exerts greater and faster antihyperlipidaemic effect than oolong tea. Green tea may have an inhibitory effect on the activity of the angiotensin converting enzyme in healthy volunteers, whereas black tea has no such effect.45 However, in our meta-analysis, only three reports had the information on the type of tea consumed and the risk of T2DM,19 20 26 Thus, no comparison between the types of tea and T2DM risk was performed. However, we performed a subgroup analysis according to regions and found a significant association between tea consumption and decreased T2DM risk in Asian population (RR 0.84, 95% CI 0.71 to 1.00), but not in the American and European populations (RR 1.00, 95% CI 0.97 to 1.04). This may be explained by the different types of teas consumed in different regions. Black tea is mainly consumed in the USA and European countries, while green tea is preferred in Asian countries. A difference in the physiques between Asians and Americans/Europeans which may lead the unequal cumulative effects from the tea consumption may be another reason for the discrepancy.
The exact mechanism for the beneficial effect by which tea may protect against the development of T2DM is still ambiguous. The first mechanism is the improved effect of tea on the amelioration of insulin resistance. The second mechanism is through an impact of tea consumption on hepatic gluconeogenesis, which is shown not only for green tea but also for oolong tea.14 46 The third mechanism is the protective action of tea on the pancreatic tissues. Both green tea and black tea preserve the insulin secretory machinery and protects pancreatic β cells.10
Several potential limitations should be considered in interpreting our results. First, the research included in our meta-analysis had different categories for tea consumption. In most studies, tea consumption is assessed based on the number of cups of tea consumed daily. However, cup size and volume may vary considerably. Second, our search was limited to published English and Chinese language studies because of language barrier. Third, except for other chemical constituents, there is caffeine naturally present in tea. Some human studies showed that caffeine intake is associated with a statistically significantly lower T2DM risk.19 47 In our current meta-analysis, most of the studies have a lack of adjustment for caffeine, which might have confounded the results. Fourth, due to the limited information in the included cohort studies, we were not able to conduct stratified analysis on the association of different tea types with T2DM risk. Five, other lifestyle parameters could have affected T2DM risk, including the consumption of fruits, whole-grain, and meat, and prolonged TV viewing.48–51 Comprehensive lifestyle interventions are associated with decreased T2DM risk.52 Thus, tea consumption is likely to be related to all sorts of other lifestyle behaviours that could affect T2DM risk.
The potential publication bias in this meta-analysis includes: (1) non-inclusion of other studies that were published in languages other than English and Chinese and (2) lack of information of the types of teas used in the studies. However, most of the related researches have been included in this meta-analysis. Furthermore, in the sensitivity analysis of our meta-analysis, no significant heterogeneity was found after omitting the papers that mentioned green or oolong tea. However, further studies should be carried out to enrich related evidence.
In summary, our results indicate that daily tea consumption (≥3 cups/day) is associated with a lower T2DM risk. This implies that the daily consumption level might be an important factor in determining the protective effect of tea against T2DM. More strictly designed cohort studies should be carried out to explore the potential differences between men and women, or to explore the different effect from types of tea.
Supplementary Material
Acknowledgments
The authors thank Dr Van Anthony M Villar with Division of Nephrology, Department of Medicine, University of Maryland School of Medicine, Baltimore, MD, USA, for proofreading the manuscript.
Footnotes
Contributors: JY and Q-XM were responsible for the study design, data acquisition, statistical analysis and the interpretation of the results. H-XX was responsible for providing information and advice on the treatment on the statistical aspects of the research. XM and C-YZ contributed to the concept and design of the study, provided guidance during study selection, data analysis, draft development and final submission.
Funding: This work was supported by grants from the National Natural Science Foundation of China (30925018, 81100500, 81102142) and the National Research Institute for Family Planning (2010GJSSJKA10).
Competing interests: None.
Provenance and peer review: Not commissioned; externally peer reviewed.
Data sharing statement: No additional data are available.
References
- 1.Graham HN. Green tea composition, consumption, and polyphenol chemistry. Prev Med 1992;21:334–50 [DOI] [PubMed] [Google Scholar]
- 2.Cabrera C, Giménez R, López MC. Determination of tea components with antioxidant activity. J Agric Food Chem 2003;51:4427–35 [DOI] [PubMed] [Google Scholar]
- 3.Sun CL, Yuan JM, Koh WP, et al. Green tea and black tea consumption in relation to colorectal cancer risk: the Singapore Chinese Health Study. Carcinogenesis 2007;28:2143–8 [DOI] [PubMed] [Google Scholar]
- 4.Jing Y, Han G, Hu Y, et al. Tea consumption and risk of type 2 diabetes: a meta-analysis of cohort studies. J Gen Intern Med 2009;24:557–62 [DOI] [PMC free article] [PubMed] [Google Scholar]
- 5.Centers for Disease Control and Prevention. National diabetes fact sheet: national estimates and general information on diabetes and prediabetes in the United States. http://www.cdc.gov/diabetes/pubs/factsheet11.htm (accessed 17 Oct 2013).
- 6.Saydah SH, Eberhardt MS, Loria CM, et al. Age and the burden of death attributable to diabetes in the United States. Am J Epidemiol 2002;156:714–19 [DOI] [PubMed] [Google Scholar]
- 7.American Diabetes Association. Economic costs of diabetes in the U.S. In 2007. Diabetes Care 2008;31:596–615 [DOI] [PubMed] [Google Scholar]
- 8.Romaguera D, Guevara M, Norat T, et al. ; InterAct Consortium. Mediterranean diet and type 2 diabetes risk in the European Prospective Investigation into Cancer and Nutrition (EPIC) study: the InterAct project. Diabetes Care 2011;34:1913–18 [DOI] [PMC free article] [PubMed] [Google Scholar]
- 9.Hininger-Favier I, Benaraba R, Coves S, et al. Green tea extract decreases oxidative stress and improves insulin sensitivity in an animal model of insulin resistance, the fructose-fed rat. J Am Coll Nutr 2009;28:355–61 [DOI] [PubMed] [Google Scholar]
- 10.Manikandan R, Sundaram R, Thiagarajan R, et al. Effect of black tea on histological and immunohistochemical changes in pancreatic tissues of normal and streptozotocin-induced diabetic mice (Mus musculus). Microsc Res Tech 2009;72:723–6 [DOI] [PubMed] [Google Scholar]
- 11.Fu Z, Zhen W, Yuskavage J, et al. Epigallocatechin gallate delays the onset of type 1 diabetes in spontaneous non-obese diabetic mice. Br J Nutr 2011;105:1218–25 [DOI] [PMC free article] [PubMed] [Google Scholar]
- 12.Song EK, Hur H, Han MK. Epigallocatechin gallate prevents autoimmune diabetes induced by multiple low doses of streptozotocin in mice. Arch Pharm Res 2003;26:559–63 [DOI] [PubMed] [Google Scholar]
- 13.Yang J, Han Y, Sun H, et al. (-)-Epigallocatechin gallate suppresses proliferation of vascular smooth muscle cells induced by high glucose by inhibition of PKC and ERK1/2 signalings. J Agric Food Chem 2011;59:11483–90 [DOI] [PubMed] [Google Scholar]
- 14.Lin CL, Lin JK. Epigallocatechin gallate (EGCG) attenuates high glucose-induced insulin signaling blockade in human hepG2 hepatoma cells. Mol Nutr Food Res 2008;52:930–9 [DOI] [PubMed] [Google Scholar]
- 15.Yang P, Li H. Epigallocatechin-3-gallate ameliorates hyperglycemia-induced embryonic vasculopathy and malformation by inhibition of Foxo3a activation. Am J Obstet Gynecol 2010;203:75.e1–6 [DOI] [PMC free article] [PubMed] [Google Scholar]
- 16.Greenberg JA, Axen KV, Schnoll R, et al. Coffee, tea and diabetes: the role of weight loss and caffeine. Int J Obes (Lond) 2005;29:1121–39 [DOI] [PubMed] [Google Scholar]
- 17.Song Y, Manson JE, Buring JE, et al. Associations of dietary flavonoids with risk of type 2 diabetes, and markers of insulin resistance and systemic inflammation in women: a prospective study and cross-sectional analysis. J Am Coll Nutr 2005;24:376–84 [DOI] [PubMed] [Google Scholar]
- 18.Pereira MA, Parker ED, Folsom AR. Coffee consumption and risk of type 2 diabetes mellitus: an 11-year prospective study of 28 812 postmenopausal women. Arch Intern Med 2006;166:1311–16 [DOI] [PubMed] [Google Scholar]
- 19.Iso H, Date C, Wakai K, et al. The relationship between green tea and total caffeine intake and risk for self-reported type 2 diabetes among Japanese adults. Ann Intern Med 2006;144:554–62 [DOI] [PubMed] [Google Scholar]
- 20.Odegaard AO, Pereira MA, Koh WP, et al. Coffee, tea, and incident type 2 diabetes: the Singapore Chinese Health Study. Am J Clin Nutr 2008;88:979–85 [DOI] [PMC free article] [PubMed] [Google Scholar]
- 21.van Dieren S, Uiterwaal CS, van der Schouw YT, et al. Coffee and tea consumption and risk of type 2 diabetes. Diabetologia 2009;52:2561–9 [DOI] [PubMed] [Google Scholar]
- 22.Panagiotakos DB, Lionis C, Zeimbekis A, et al. Long-term tea intake is associated with reduced prevalence of (type 2) diabetes mellitus among elderly people from Mediterranean islands: MEDIS epidemiological study. Yonsei Med J 2009;50:31–8 [DOI] [PMC free article] [PubMed] [Google Scholar]
- 23.Oba S, Nagata C, Nakamura K, et al. Consumption of coffee, green tea, oolong tea, black tea, chocolate snacks and the caffeine content in relation to risk of diabetes in Japanese men and women. Br J Nutr 2010;103:453–9 [DOI] [PubMed] [Google Scholar]
- 24.Golozar A, Khademi H, Kamangar F, et al. Diabetes mellitus and its correlates in an Iranian adult population. PLoS ONE 2011;6:e26725. [DOI] [PMC free article] [PubMed] [Google Scholar]
- 25.Boggs DA, Rosenberg L, Ruiz-Narvaez EA, et al. Coffee, tea, and alcohol intake in relation to risk of type 2 diabetes in African American women. Am J Clin Nutr 2010;92:960–6 [DOI] [PMC free article] [PubMed] [Google Scholar]
- 26.Hayashino Y, Fukuhara S, Okamura T, et al. High oolong tea consumption predicts future risk of diabetes among Japanese male workers: a prospective cohort study. Diabet Med 2011;28:805–10 [DOI] [PubMed] [Google Scholar]
- 27.Goto A, Song Y, Chen BH, et al. Coffee and caffeine consumption in relation to sex hormone-binding globulin and risk of type 2 diabetes in postmenopausal women. Diabetes 2011;60:269–75 [DOI] [PMC free article] [PubMed] [Google Scholar]
- 28.InterAct Consortium. Tea consumption and incidence of type 2 diabetes in Europe: the EPIC-InterAct case-cohort study. PLoS ONE 2012;7:e36910. [DOI] [PMC free article] [PubMed] [Google Scholar]
- 29.Wells GA, Shea B, O'Connell D, et al. The Newcastle- Ottawa Scale (NOS) for assessing the quality of nonrandomised studies in meta-analyses. http://www.Ohri.ca/programs/clinical_epidemiology/oxford.asp (accessed 26 Nov 2011).
- 30.Saremi A, Tulloch-Reid M, Knowler WC. Coffee consumption and the incidence of type 2 diabetes. Diabetes Care 2003;26:2211–12 [DOI] [PubMed] [Google Scholar]
- 31.Yamaji T, Mizoue T, Tabata S, et al. Coffee consumption and glucose tolerance status in middle-aged Japanese men. Diabetologia 2004;47:2145–51 [DOI] [PubMed] [Google Scholar]
- 32.Salazar-Martinez E, Willett WC, Ascherio A, et al. Coffee consumption and risk for type 2 diabetes mellitus. Ann Intern Med 2004;140:1–8 [DOI] [PubMed] [Google Scholar]
- 33.Nettleton JA, Harnack LJ, Scrafford CG, et al. Dietary flavonoids and flavonoid-rich foods are not associated with risk of type 2 diabetes in postmenopausal women. J Nutr 2006;136:3039–45 [DOI] [PMC free article] [PubMed] [Google Scholar]
- 34.van Dam RM, Willett WC, Manson JE, et al. Coffee, caffeine, and risk of type 2 diabetes: a prospective cohort study in younger and middle-aged U.S. women. Diabetes Care 2006;29:398–403 [DOI] [PubMed] [Google Scholar]
- 35.Hu G, Jousilahti P, Peltonen M, et al. Joint association of coffee consumption and other factors to the risk of type 2 diabetes: a prospective study in Finland. Int J Obes (Lond) 2006;30:1742–9 [DOI] [PubMed] [Google Scholar]
- 36.Hamer M, Witte DR, Mosdøl A, et al. Prospective study of coffee and tea consumption in relation to risk of type 2 diabetes mellitus among men and women: the Whitehall II study. Br J Nutr 2008;100:1046–53 [DOI] [PubMed] [Google Scholar]
- 37.Everett CJ, Frithsen IL, Diaz VA, et al. Association of a polychlorinated dibenzo-p-dioxin, a polychlorinated biphenyl, and DDT with diabetes in the 1999–2002 National Health and Nutrition Examination Survey. Environ Res 2007;103:413–18 [DOI] [PubMed] [Google Scholar]
- 38.Huxley R, Lee CM, Barzi F, et al. Coffee, decaffeinated coffee, and tea consumption in relation to incident type 2 diabetes mellitus: a systematic review with meta-analysis. Arch Intern Med 2009;169:2053–63 [DOI] [PubMed] [Google Scholar]
- 39.Grossmann M. Low testosterone in men with type 2 diabetes: significance and treatment. J Clin Endocrinol Metab 2011;96:2341–53 [DOI] [PubMed] [Google Scholar]
- 40.Satoh K, Sakamoto Y, Ogata A, et al. Inhibition of aromatase activity by green tea extract catechins and their endocrinological effects of oral administration in rats. Food Chem Toxicol 2002; 40:925–33 [DOI] [PubMed] [Google Scholar]
- 41.Kanaya AM, Herrington D, Vittinghoff E, et al. Glycemic effects of postmenopausal hormone therapy: the Heart and Estrogen/progestin Replacement Study. A randomized, double-blind, placebo-controlled trial. Ann Intern Med 2003;138:1–9 [DOI] [PubMed] [Google Scholar]
- 42.Manson JE, Rimm EB, Colditz GA, et al. A prospective study of postmenopausal estrogen therapy and subsequent incidence of non-insulin-dependent diabetes mellitus. Ann Epidemiol 1992;2:665–73 [DOI] [PubMed] [Google Scholar]
- 43.Nagata C, Kabuto M, Shimizu H. Association of coffee, green tea, and caffeine intakes with serum concentrations of estradiol and sex hormone-binding globulin in premenopausal Japanese women. Nutr Cancer 1998;30:21–4 [DOI] [PubMed] [Google Scholar]
- 44.Wu AH, Arakawa K, Stanczyk FZ, et al. Tea and circulating estrogen levels in postmenopausal Chinese women in Singapore. Carcinogenesis 2005;26:976–80 [DOI] [PubMed] [Google Scholar]
- 45.Persson IA, Persson K, Hägg S, et al. Effects of green tea, black tea and Rooibos tea on angiotensin-converting enzyme and nitric oxide in healthy volunteers. Public Health Nutr 2010;13:730–7 [DOI] [PubMed] [Google Scholar]
- 46.Yasui K, Miyoshi N, Tababe H, et al. Effects of oolong tea on gene expression of gluconeogenic enzymes in the mouse liver and in rat hepatoma H4IIE cells. J Med Food 2011;14:930–8 [DOI] [PubMed] [Google Scholar]
- 47.Sartorelli DS, Fagherazzi G, Balkau B, et al. Differential effects of coffee on the risk of type 2 diabetes according to meal consumption in a French cohort of women: the E3N/EPIC cohort study. Am J Clin Nutr 2010;91:1002–12 [DOI] [PubMed] [Google Scholar]
- 48.Muraki I, Imamura F, Manson JE, et al. Fruit consumption and risk of type 2 diabetes: results from three prospective longitudinal cohort studies. BMJ 2013;347:f5001. [DOI] [PMC free article] [PubMed] [Google Scholar]
- 49.Montonen J, Knekt P, Järvinen R, et al. Whole-grain and fiber intake and the incidence of type 2 diabetes. Am J Clin Nutr 2003;77:622–9 [DOI] [PubMed] [Google Scholar]
- 50.Steinbrecher A, Erber E, Grandinetti A, et al. Meat consumption and risk of type 2 diabetes: the Multiethnic Cohort. Public Health Nutr 2011;14:568–74 [DOI] [PMC free article] [PubMed] [Google Scholar]
- 51.Grøntved A, Hu FB. Television viewing and risk of type 2 diabetes, cardiovascular disease, and all-cause mortality: a meta-analysis. JAMA 2011;305:2448–55 [DOI] [PMC free article] [PubMed] [Google Scholar]
- 52.Schellenberg ES, Dryden DM, Vandermeer B, et al. Lifestyle interventions for patients with and at risk for type 2 diabetes: a systematic review and meta-analysis. Ann Intern Med 2013;159:543–51 [DOI] [PubMed] [Google Scholar]
Associated Data
This section collects any data citations, data availability statements, or supplementary materials included in this article.