Abstract
The analysis of self-assembled protein microarrays, using matrix-assisted laser desorption/ionization (MALDI) mass spectrometry, combines two high-throughput platforms for investigation of the proteome. In this report, we describe the fabrication in situ of protein arrays optimized for MALDI characterization. Using the Green Fluorescent Protein (GFP) both as an epitope for immobilization and as a gauge for relative protein expression, we were able to generate amounts of protein on the array slides sufficient for MALDI identification. In addition, expression of N-terminal protein constructs fused to GFP also demonstrated mass shifts consistent with that of the full-length protein. We envision this technology to be important for the functional screening of protein interactions.
Keywords: protein microarray, MALDI, GFP
Introduction
Protein microarrays are emerging as tools for the high-throughput analysis of global protein interaction networks. While a number of protein microarray platforms have been described [1; 2; 3; 4], the major bottleneck impeding their widespread implementation has been the expression and purification of proteins to spot onto the arrays. Current forward-phase protein microarray fabrication involves the recombinant production of proteins separately, following which the proteins are spotted and immobilized as arrays [5].
The self-assembled protein microarray approach neatly sidesteps the labor-intensive production of individual recombinant proteins, as it replaces the printing of protein elements with the printing of their corresponding cDNA [6]. In this method, the arrayed cDNAs encode different protein elements fused to a common epitope tag, and are transcribed and translated in situ by addition of commercial cell-free extract. The newly synthesized protein is captured on the slide surface by previously-immobilized capture antibodies that bind the epitope tag. A variant of this method [7] incorporates synthesis of the E. coli Tus protein, a DNA binding protein, in the fusion proteins, and inclusion of Ter, its cognate DNA binding sequence, as part of the arrayed DNA elements, allows capture without the need for spotting of additional antibody molecules.
The multiple-spotting technique of reagent delivery allows for spatial separation of the microarray elements during the protein synthesis and immobilization, which prevents protein diffusion, or “cross-talk” between proteins expressed on adjacent elements [8]. Rehydration of the cell-free extract forms nanoliter-scale protein synthesis reactions, and the volume of the reaction can be tuned by varying the salt concentration in the chamber reservoir which ultimately changes the relative humidity in the chamber.
Arrays generated in this fashion have largely been developed for downstream detection using immunoassays. While it is the most common platform, antibody-based methods for the high-throughput analysis of protein microarrays suffer from problems with antibody crossreactivity [9], low multiplexing ability [10], epitopes where an antibody is unavailable [2], inability to detect sites of post-translational modifications, and detection of unknown or multiple binding partners.
MALDI, however, offers several advantages over secondary detection methods to analyze bait protein interactions, such as the ability to rapidly sequence and identify unknown binding partners, detect post-translational modifications [11], and characterize protein isoforms [12]. For protein arrays generated in situ, MALDI also serves as a quality control for expression of full-length bait protein at each array element. A fundamental requirement in using MALDI for the analysis of self-assembled protein microarrays is that sufficient protein should be expressed on the array surface in quantities above limit of detection of the instrument. As it was necessary to maximize protein expression to generate enough protein for MALDI, we employed GFP and GFP-tagged constructs in assay development. This allowed rapid quantitative monitoring of the relative amounts of expressed and surface-immobilized protein throughout the assay process using a microarray scanner. This design also allows selection of the full-length protein product via the C-terminal GFP epitope. In this article, we describe the construction of self-assembled protein microarrays suitable for downstream MALDI analysis.
Methods
DNA Constructs
The sGFP coding sequence was amplified with the polymerase chain reaction (PCR) using primers 5′-ACTGCCATGGTGAGCAAGGGCG-3′ (NcoI, forward) and 5′-ACTGCCCGGGGAGGATCCCCTTGTACAGC -3′ (XmaI, reverse). After double digestion, the product was ligated into pIVEX2.7d vector (Roche), previously linearized with the same enzymes. This construct produces sGFP with a C-terminal AviTag (a 15-amino acid sequence that can be easily biotinylated with biotin ligase BirA). The sGFP-AviTag sequence was amplified with primers 5′-CTGACTTCCGGAATGGTGAGCAAGGGCGAGG -3′ (BspE I, forward) and 5′-ACTGAAGATCTTTATTCGTGCCATTCGATTTTC -3′ (Bgl II, reverse), the product linearized with BspEI and BglII, and ligated into the XmaI/BamHI sites of the pIVEX2.3d vector (Roche). This approach maintains the pIVEX2.3d multiple cloning site in an almost intact state, which enhances its suitability for production of in-frame C-terminus GFP-tagged proteins. The coding sequences of CusF and SLY2 were amplified with the following primers: CusF, 5′-AAGCTCCATGGCTAACGAACATCATCATGAAAC-3′ (Nco I, forward) and 5′-AAGCTCTCGAGCTGGCTGACTTTAATATCCTG-3′ (Xho I, reverse); SLY2, 5′-ACTAGCCATGGATGAGGAGCAAGTTTCATTTGAC-3′ (Nco I, forward) and 5′-ACTGCTCGAGGTCTGAAACGAACAATGGCAG-3′ (Xho I, reverse). pIVEX2.3d-GFP was linearized with the same pair of enzymes before ligation. All final constructs were confirmed by sequencing.
Multiple spotting technique
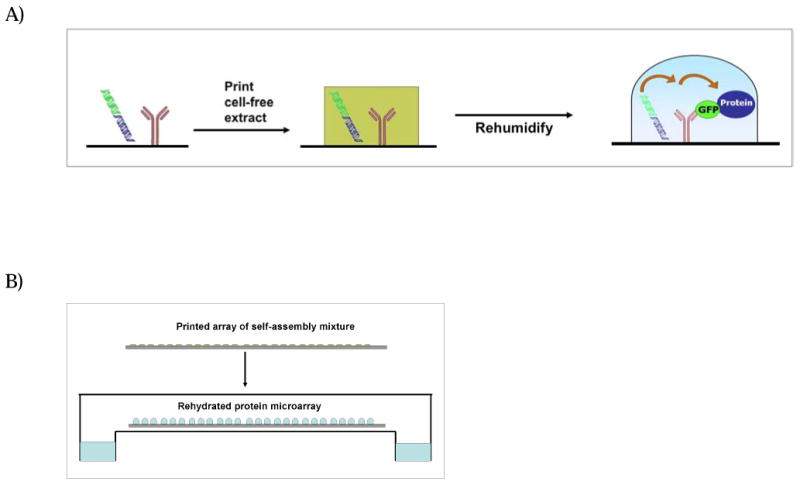
The slides were generated using a multiple spotting technique [8; 13; 14] optimized to generate sufficient protein for downstream MALDI analysis (Figure 1). An Omnigrid-100 microarrayer (Genomic Solutions/Gene Machines) with split channel 100 μm diameter SMP3 pins (Telechem) was used to print the antibody, DNA, and cell-free extract. The delivery volume of the pins is ∼0.7 nL, and we printed each of the solutions three times to maximize reagent delivery to each array element. The subarrays contained array elements in a 7 × 7 grid and the center-to-center spacing of the array elements was 600 μm. A solution of 1 mg/mL polyclonal goat anti-GFP (Rockland) was added to a 384 well plate and spotted onto Indium Tin Oxide (ITO) microscope slides (Sigma-Aldrich) coated with the Codelink (SurModics) TRIDA NHS-ester surface. The printed slides were immediately rehydrated following printing.
Figure 1.

(A) Self-assembled protein microarray scheme using a multiple spotting technique. First, Anti-GFP is printed on a conductive glass slide coated with an amine-reactive surface and the slide is incubated in a humid chamber to allow for immobilization of the antibody. DNA constructs with a T7 promoter and C-terminal GFP tag are printed at each microarray element on top of the immobilized antibody. Cell-free extract is printed on top of the DNA/antibody spots and rehydration of the spots commences transcription, translation, and capture of the full-length bait protein. (B) Rehydration of the microarray in a sealed chamber forms separate protein synthesis reactions at each array element.
Rehydration and protein synthesis
To rehydrate the spots for covalent antibody attachment to the surface, the slides were sealed in a microarray hybridization chamber (Telechem) containing 120 μL of 90 mM sodium citrate, 300 mM sodium chloride, pH= 7.0 (3X SSC) in the reservoirs and incubated overnight at 30°C. Slides were blocked in 10 mL StabilGuard Immunoassay Stabilizer BSA-free (SurModics, product code SG01) for 1 hour on a rotator and rinsed with water. The slides were realigned with the microarrayer surface plate and 1 μg/μL C-terminal GFP plasmid in water was printed directly over the spots at which the capture antibody was immobilized. The bacterial cell-free transcription and translation (IVTT) mixture (RTS-100, Roche) was subsequently printed on the same positions as the antibody/DNA, and the slides were immediately rehydrated. The slides were sealed again in a hybridization chamber containing 120 μL of 3X SSC in the reservoirs, and incubated overnight at 30°C to allow for protein synthesis (Figure 1b) and product immobilization. The slides were washed twice in 10 mL of Stabilguard buffer for 15 minutes each. Finally, the slides were rinsed thoroughly with water and spun dry.
Analysis of expressed protein elements
GFP fluorescence was detected using a GenePix 4200AL microarray scanner equipped with an argon ion 488nm laser. A standard curve of fluorescence emission was generated using a spotted dilution of GFP to estimate the expression level of protein spots on the slide. A 1 mg/mL solution of GFP (Roche) was serially diluted using 50 mM sodium phosphate (pH 8.0) and printed onto Codelink slides using a single print (0.7 nL). The slides were not blocked or washed, and were scanned immediately after printing. The standard curve was used to relate fluorescence emission to the amount of protein per spot, based on a delivery volume of 0.7 nL. Fluorescence quantification on the microarrays was carried out using Genepix software. Although MALDI cannot be considered a truly quantitative mass spectrometric method, we needed to be able to estimate the protein analyte range over which detectable MALDI signals could be obtained. In order to qualitatively estimate the sensitivity of the MALDI instrument, a standard curve similar to that described for printed GFP was generated using a dilution of BSA in water. This standard curve was printed on a bare 2″ × 2″ indium tin oxide coated MALDI slide (Sigma) using a single print of a dilution of 100 mg/mL BSA in water. The subarrays contained array elements positioned in a 15 × 15 grid, with an element center-to-center spacing of 150μm. The BSA standard curve was not blocked or washed prior to MALDI processing. Finally, aliquots (1 μL) of saturated sinapinic acid in 70:30 acetonitrile:water containing 0.1% trifluoroacetic acid were hand-spotted over the protein subarrays and allowed to dry. MALDI-TOF spectra were acquired on a Bruker Reflex III MALDI-TOF instrument in linear mode detecting positive ions. A commercial N2 laser was used for ionization (337 nm). In order to obtain protein ions with a high signal to noise ratio, the laser power was operated in the region of 35-45%, the accelerating voltage was 20 kV, and the duration of the laser pulse was 3 ns.
Results and Discussion
Optimization of on-slide protein synthesis
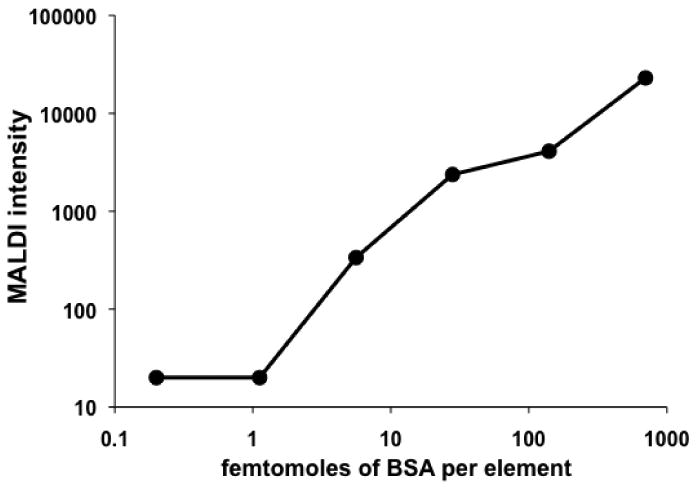
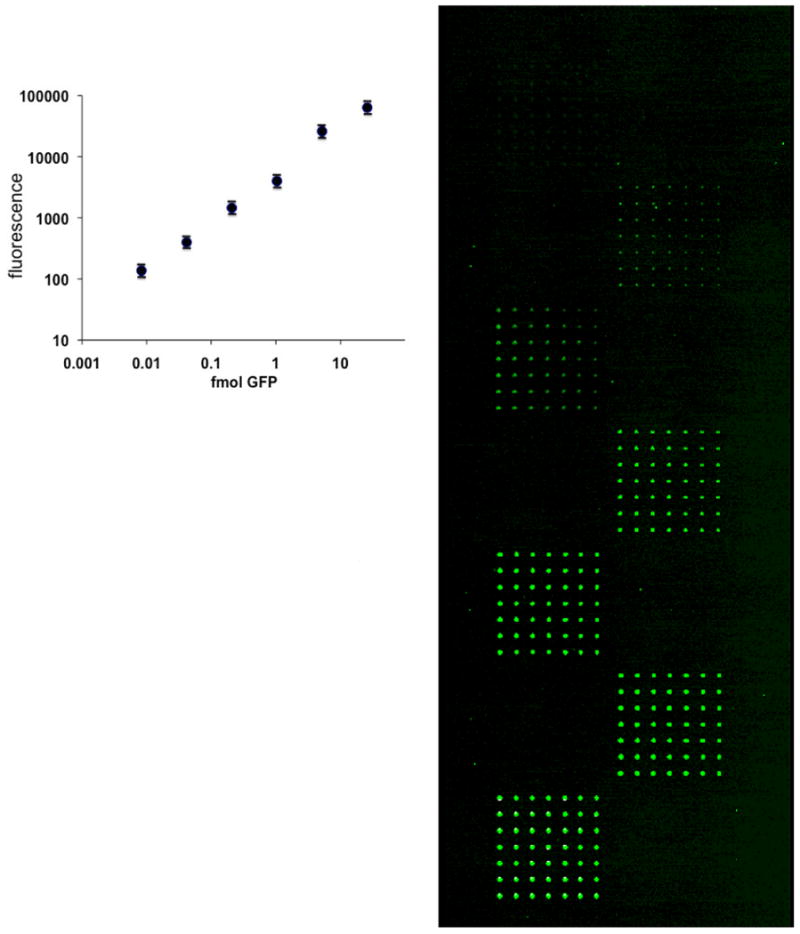
In the first experiments, using a dilution series of BSA printed directly onto the MALDI sample holder, we determined the limit of detection of the mass spectrometer, in linear-mode MALDI, as being approximately 10 fmol per spot (Figure 2). The next experiments were done to provide an estimate, based on GFP fluorescence emission, of the amounts of protein produced per spot by the transcription-translation system (Figure 3). Based on emission of GFP fluorescence for the expressed protein, we estimate that our system generates approximately 4 fmol protein per array element. Efficient surface immobilization of in situ expressed proteins is necessary to provide sufficient protein for downstream MALDI analysis, and this necessitated the use of capture antibodies on the surface. We evaluated various surfaces and slide manufacturers for capacity to bind protein and found that NHS-ester coated slides bound significantly more protein than epoxide, aldehyde, and nitrocellulose coated slides based on GFP fluorescence (data not shown). This was performed by printing 1 mg/ml GFP onto each surface, washing the slides in the Stabilguard buffer as described in the Methods section, and scanning the washed slides for bound GFP.
Figure 2.

Qualitative assessment of the sensitivity of the MALDI system. MALDI sensitivity of a microarray-printed dilution of BSA shows the limit of detection to be greater than 10 fmol per spot.
Figure 3.

Standard curve of GFP.
A printed dilution of GFP in a 7×7 grid for each subarray was used to generate a standard curve to quantitate the amount of expressed GFP and GFP-constructs for the self-assembled arrays.
Arraying the cell-free transcription/translation mixture allowed for the miniaturization and confinement of on-slide protein synthesis, which ultimately produced higher yields of protein per spot than that method in which the total slide is covered with the same mixture [15]. At 30°C, an appropriate minimal rehydration of the printed cell-free extract compatible with protein production was achieved using 3X SSC as the chamber well solution. Placing a solution saturated with SSC salts in the chamber well failed to allow spot rehydration, and using pure water led to an excessive hydration, and resulted in spot enlargement to the point that they ultimately merged. In this manner, the volume of each rehydrated protein synthesis reaction was controlled by chamber humidity. This improvement in yield using reduced volumes compared to expression yields in the recommended solution conditions (IVTT manufacturer's instructions) may be due to multiple-order reaction kinetics, in which reaction rates increase exponentially in reduced volumes.
Since MALDI requires a conductive surface for proper desorption, we obtained commercially-available ITO -coated glass microscope slides which were then coated with the amine-reactive Codelink surface in collaboration with Surmodics; coating the ITO-glass slides with the Codelink surface did not affect the surface conductivity of the slides (data not shown). Preliminary experiments indicated MALDI detection was sensitive to residual ions and polymers present in the cell-free extract, indicating that blocking was necessary. It was also found essential to block residual active NHS-ester groups using on the slide surface using Stabilguard buffer prior to printing the transcription/translation extract.
MALDI detection of expressed proteins
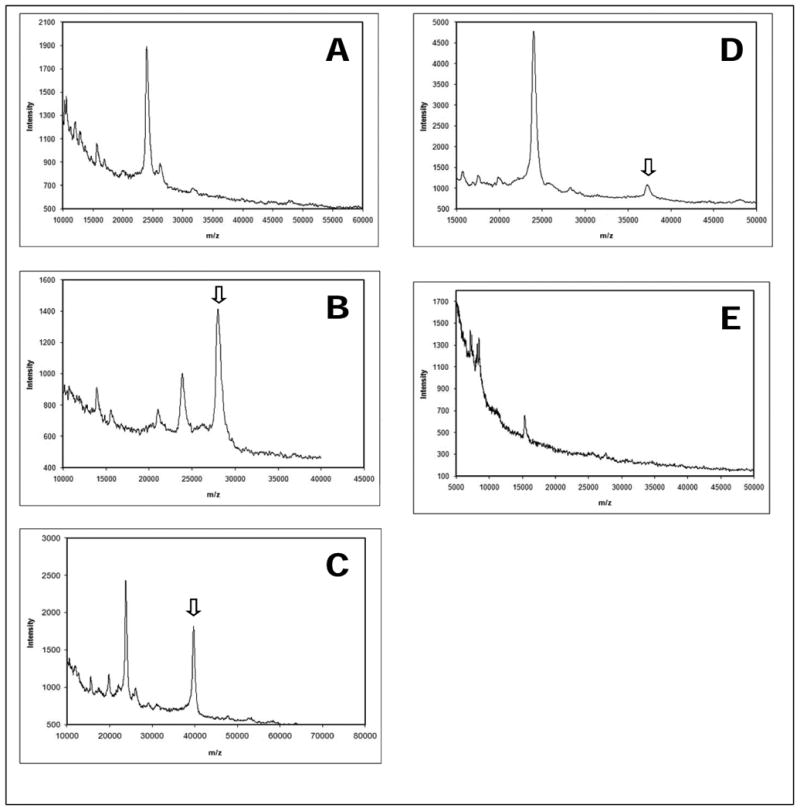
After in situ expression of proteins from the plasmids, and crystallization with matrix, the presence of full-length proteins was successfully detected by MALDI (Figure 4). The m/z profiles show discrete peaks at 28,000, 37,250, and 39,700 Da, indicating expression of GFP, SLY2-GFP, and CusF-GFP, respectively. The mass differences of 9,250 and 11,700 Da between SLY2-GFP, CusF-GFP, and GFP are consistent with insertion of SLY2 and CusF at the N-terminus of GFP. The peak at 23,800 probably represents the light chain of the anti-GFP capture antibody, since it appears in the spectra of controls lacking plasmid, and is absent from those of spots lacking capture antibody (Figure 4E). This is consistent with observations using MALDI for analysis of microarrayed spots of an anti-Ras antibody [16]. Intact capture antibody (MW ∼140,000) or antibody-antigen complexes in the high m/z range were not detected in the MALDI spectra. The reasons for this may be due to the repulsive electrostatic forces between the antibody and antigen that are dominant in the gas phase, and the covalent immobilization of the capture antibody may prevent desorption of the intact antibody from the surface.
Figure 4.

MALDI spectra of self-assembled protein array elements. (A) Control spectra of spots without the expression plasmid show artifact peaks from immobilized Anti-GFP. Spots containing plasmids for expression of GFP (B), CusF-GFP (C), and SLY2-GFP (D) show peaks at the expected m/z values for full-length protein. (E) Spectra of array elements without immobilized Anti-GFP show minimal binding of contaminants from the cell-free transcription/translation mixture. Arrows in B, C, and D indicate expression of GFP, CusF-GFP, and SLY2-GFP, respectively.
The major limitation in using this approach appears to be the expression of larger proteins. We have evaluated a number of cDNA constructs that encode fusion proteins greater in size than 40 kDa and have found that both the C-terminal GFP signal and MALDI signal intensity are significantly reduced as compared to those fusion proteins that are smaller than 40 kDa. This problem is not likely due to this particular type of printing method, but rather a function of the properties of the cell-free extract used to synthesize the proteins. Lower yields of these larger constructs are also observed when they are expressed in solution according to the manufacturer's instructions. It is anticipated that with further developments in commercial in vitro transcription / translation mixtures, a more robust means of protein production will emerge that is less sensitive to product size, and that can then be used for fabrication of protein microarrays containing these larger proteins.
Herein, we have described a multiple spotting technique to generate auto fluorescent protein microarrays as a development tool for maximizing on-chip functional protein expression. The amount of protein generated at each array element is quantified using a microarray scanner, and the full-length protein products are detected using MALDI. The combined technologies of protein self-assembly and MALDI can be used for high-throughput screening of proteins for structure/ function determination, as theoretically every spot in the array can contain expression cDNAs encoding different proteins. We anticipate that advances in high-throughput protein expression and analysis such as those described here will complement traditional protein microarrays which rely on antibody-based detection.
Acknowledgments
This work was supported by NSF-PGRP 0501914 (to DG and SSL) and T32 ES016652 (MJK). Mass spectrometric data was acquired by the Arizona Proteomics Consortium supported by NIEHS grant P30ES06694 to the Southwest Environmental Health Sciences Center, NIH/NCI grant P30CA023074 to the Arizona Cancer Center and by the BIO5 Institute of the University of Arizona. We would like to thank Ms. April Lake for her assistance with the mass spectral analysis. We would also like to thank Dr. Dave Henderson for his advice in using the NHS slides.
Footnotes
Publisher's Disclaimer: This is a PDF file of an unedited manuscript that has been accepted for publication. As a service to our customers we are providing this early version of the manuscript. The manuscript will undergo copyediting, typesetting, and review of the resulting proof before it is published in its final citable form. Please note that during the production process errors may be discovered which could affect the content, and all legal disclaimers that apply to the journal pertain.
References
- 1.Kersten B, Wanker EE, Hoheisel JD, Angenendt P. Multiplex approaches in protein microarray technology. Expert Rev Proteomics. 2005;2:499–510. doi: 10.1586/14789450.2.4.499. [DOI] [PubMed] [Google Scholar]
- 2.LaBaer J, Ramachandran N. Protein microarrays as tools for functional proteomics. Curr Opin Chem Biol. 2005;9:14–9. doi: 10.1016/j.cbpa.2004.12.006. [DOI] [PubMed] [Google Scholar]
- 3.MacBeath G. Protein microarrays and proteomics. Nat Genet. 2002;32(Suppl):526–32. doi: 10.1038/ng1037. [DOI] [PubMed] [Google Scholar]
- 4.Ramachandran N, Larson DN, Stark PR, Hainsworth E, LaBaer J. Emerging tools for real-time label-free detection of interactions on functional protein microarrays. FEBS J. 2005;272:5412–25. doi: 10.1111/j.1742-4658.2005.04971.x. [DOI] [PubMed] [Google Scholar]
- 5.Zhu H, Snyder M. Protein chip technology. Curr Opin Chem Biol. 2003;7:55–63. doi: 10.1016/s1367-5931(02)00005-4. [DOI] [PubMed] [Google Scholar]
- 6.Ramachandran N, Hainsworth E, Bhullar B, Eisenstein S, Rosen B, Lau AY, Walter JC, LaBaer J. Self-assembling protein microarrays. Science. 2004;305:86–90. doi: 10.1126/science.1097639. [DOI] [PubMed] [Google Scholar]
- 7.Chatterjee DK, Sitaraman K, Baptista C, Hartley J, Hill TM, Munroe DJ. Protein microarray on-demand: a novel protein microarray system. PLoS One. 2008;3:e3265. doi: 10.1371/journal.pone.0003265. [DOI] [PMC free article] [PubMed] [Google Scholar]
- 8.Angenendt P, Kreutzberger J, Glokler J, Hoheisel JD. Generation of high density protein microarrays by cell-free in situ expression of unpurified PCR products. Mol Cell Proteomics. 2006;5:1658–66. doi: 10.1074/mcp.T600024-MCP200. [DOI] [PubMed] [Google Scholar]
- 9.Michaud GA, Salcius M, Zhou F, Bangham R, Bonin J, Guo H, Snyder M, Predki PF, Schweitzer BI. Analyzing antibody specificity with whole proteome microarrays. Nat Biotechnol. 2003;21:1509–12. doi: 10.1038/nbt910. [DOI] [PubMed] [Google Scholar]
- 10.Haab BB, Dunham MJ, Brown PO. Protein microarrays for highly parallel detection and quantitation of specific proteins and antibodies in complex solutions. Genome Biol. 2001;2 doi: 10.1186/gb-2001-2-2-research0004. RESEARCH0004. [DOI] [PMC free article] [PubMed] [Google Scholar]
- 11.Person MD, Monks TJ, Lau SS. An integrated approach to identifying chemically induced posttranslational modifications using comparative MALDI-MS and targeted HPLC-ESI-MS/MS. Chem Res Toxicol. 2003;16:598–608. doi: 10.1021/tx020109f. [DOI] [PubMed] [Google Scholar]
- 12.Christiansen M, Jorgensen CS, Laursen I, Hirschberg D, Hojrup P, Houen G. Protein chemical characterization of Gc globulin (vitamin D-binding protein) isoforms; Gc-1f, Gc-1s and Gc-2. Biochim Biophys Acta. 2007;1774:481–92. doi: 10.1016/j.bbapap.2007.01.005. [DOI] [PubMed] [Google Scholar]
- 13.Angenendt P, Glokler J, Konthur Z, Lehrach H, Cahill DJ. 3D protein microarrays: performing multiplex immunoassays on a single chip. Anal Chem. 2003;75:4368–72. doi: 10.1021/ac034260l. [DOI] [PubMed] [Google Scholar]
- 14.Angenendt P, Wilde J, Kijanka G, Baars S, Cahill DJ, Kreutzberger J, Lehrach H, Konthur Z, Glokler J. Seeing better through a MIST: evaluation of monoclonal recombinant antibody fragments on microarrays. Anal Chem. 2004;76:2916–21. doi: 10.1021/ac035357a. [DOI] [PubMed] [Google Scholar]
- 15.Zarate X, Henderson DC, Phillips KC, Lake AD, Galbraith DW. Development of high-yield autofluorescent protein microarrays using hybrid cell-free expression with combined Escherichia coli S30 and wheat germ extracts. Proteome Science. 2010;8 doi: 10.1186/1477-5956-8-32. [DOI] [PMC free article] [PubMed] [Google Scholar]
- 16.Becker CF, Wacker R, Bouschen W, Seidel R, Kolaric B, Lang P, Schroeder H, Muller O, Niemeyer CM, Spengler B, Goody RS, Engelhard M. Direct readout of protein-protein interactions by mass spectrometry from protein-DNA microarrays. Angew Chem Int Ed Engl. 2005;44:7635–9. doi: 10.1002/anie.200502908. [DOI] [PubMed] [Google Scholar]


