Abstract
Despite the widespread use of multiplex immunoassays, there are very few scientific reports that test the accuracy and reliability of a platform prior to publication of experimental data. Our laboratory has previously demonstrated the need for new assay platform validation prior to use of biologic samples from large studies in order to optimize sample handling and assay performance. In this study, our goal was to test the accuracy and reproducibility of an electrochemiluminescent multiplex immunoassay platform (Meso Scale Discovery, MSD®) and compare this platform to validated, singleplex immunoassays (R&D Systems®) using actual study subject (human plasma and mouse bronchoalveolar lavage fluid (BALF) and plasma) samples. We found that the MSD platform performed well on intra- and inter-assay comparisons, spike and recovery and cross-platform comparisons. The mean intra-assay CV% and range for MSD was 3.49 (0.0-10.4) for IL-6 and 2.04 (0.1-7.9) for IL-8. The correlation between values for identical samples measured on both MSD and R&D was R=0.97 for both analytes. The mouse MSD assay had a broader range of CV% with means ranging from 9.5-28.5 depending on the analyte. The range of mean CV% was similar for single plex ELISAs at 4.3-23.7 depending on the analyte. Regardless of species or sample type, CV% was more variable at lower protein concentrations. In conclusion, we validated a multiplex electrochemiluminscent assay system and found that it has superior test characteristics in human plasma compared to mouse BALF and plasma. Both human and MSD assays compared favorably to well-validated singleplex ELISA's
INTRODUCTION
The use of multiplex immunoassays for the measurement of multiple protein analytes in a single sample is becoming increasingly common. Multiplex immunoassays offer several advantages over singleplex immunoassays including reduced cost, increased efficiency and maximal information from minimal sample volume. There are several different multiplex platforms that are commercially available and the number and variety of proteins that can be measured using these technologies is increasing yearly (Chandra et al., 2011; Li et al., 2012; Salvante et al., 2012; Ostendorff et al., 2013). Despite this major expansion in multiplex technology, there continue to be many challenges in multiplex development including antibody interference and wide variability in abundance and limits of detection for different analytes (Ellington et al., 2010).
Despite the widespread use and potential pitfalls of multiplex immunoassay platforms for both clinical and basic research, there are few publications that specifically address accuracy and reliability of the commercially available platforms across a range of clinical research settings (Chowdhury et al., 2009; Ellington et al., 2009; Fu et al., 2010; Richens et al., 2010; Chandra et al., 2011; Eastman et al., 2012; Li et al., 2012; Belabani et al., 2013; Ostendorff et al., 2013). There is even less information about the use of these assays for mouse blood and body fluid samples. In fact, to our knowledge, there are no publications validating multiplex protein immunoassays in mouse samples. Our translational research group has studied several different multiplex immunoassay platforms in the last decade and identified issues of reproducibility and reliability for some of these platforms (Bastarache et al., 2011). As a result of our experience, our group has developed a standard protocol for validation of new bioassays, both multiplex and singleplex, prior to use in our research studies. Intra- and inter-assay variability and spike and recovery efficiency is tested in the intended assay matrix (plasma, serum, bronchoalveolar lavage fluid, urine, etc) and when feasible, a cross-platform validation is done. Use of this standard protocol allows the accuracy and reproducibility of each new assay to be assessed prior to use with human or mouse samples.
Herein, we present the results of a comprehensive validation study of the MesoScale Discovery® Electrochemiluminescent multiplex immunoassay platform (MSD). The MSD platform uses a specialized 96 well plate with integrated electrodes to deliver an electric impulse to the test well. Capture antibodies are applied in discrete spots in the test wells that bind the analyte in a sample. The detection reagent contains electrochemiluminescent labels that bind to the detection antibody and are only activated by an electric charge. This requires the label to be in close proximity to the charge at the bottom of the plate, in theory eliminating any background interference by non-specific label detection (Discovery, 2012). We tested accuracy, reproducibility and analyte recovery in human plasma, mouse plasma and mouse bronchoalveolar lavage fluid (BALF) using two different multiplex immunoassays on the MSD platform and compared our results to traditional singleplex ELISAs that have been previously validated and are routinely used in our laboratory. (Calfee et al., 2008; Christie et al., 2009; Siew et al., 2010; Ware et al., 2010; Bastarache et al., 2011; Janz et al., 2013; Ware et al., 2013)
METHODS
Patients
This work was performed to validate a multiplex assay platform in preparation to measuring multiple protein biomarkers in plasma from human subjects enrolled in several clinical studies. Patients for the validation were selected from two randomized clinical trials of critically ill patients and represent a broad spectrum of critically ill patients. All clinical studies were approved by the Vanderbilt University Institutional Review Board.
Animals
Wild type C57Bl6 mice and low tissue factor (LTF) mice (Bastarache et al., 2012) were used for all experiments. Mice were treated with either intratracheal administration of 0.08 units of bleomycin or saline control and blood and bronchoalveolar lavage fluid (BALF) were harvested at selected time points. Both early (4-24 hours following LPS) or late (4-7 days following bleomycin) time points were chosen in order to obtain a biologically representative range of low and high cytokine values. Heparinized blood was collected by retro-orbital puncture and centrifuged at 1,500 × g. With the exception of the R&D KC kits, all other kits have been validated by the manufacturer for use with heparinized plasma. Plasma was carefully removed and frozen at −80°C until analysis. For BALF collection, mice were euthanized with an overdose of phenobarbital and a midline incision was made over the trachea. A blunt catheter was inserted into the trachea and tied in place. 900 μl of sterile normal saline (0.9%) was gently infused and withdrawn. Cellular components were removed by centrifugation at 1,500 × g and the cell free BALF was stored at −80°C until analysis. All studies were approved by the Vanderbilt University Institutional Animal Care and Use Committee.
Assays: MSD
For the human studies, the Human Proinflammatory 7-Plex Ultrasensitive Kit (cat no. K15008C-1) was used. This kit measures IFN-γ, IL-1β, IL-10, IL-12p70, IL-6, IL-8, and TNF-α and the manufacturer's range of detection for each analyte is 0.61-10,000pg/ml. For the mouse studies, the Mouse Proinflammatory 7-Plex Ultra-sensitive Kit (cat no. K15012C-1) was used. This kit measures IFN-γ, IL-1β, IL-10, IL12p70, IL-6, KC/GRO, and TNF-α. The manufacturer's rage of detection for each analyte is 2.4-10,000pg/ml.
Assays: R&D Systems
All single-plex ELISA kits were from R&D as follows: Human IL-6 (cat no. D6050), detection range 3.12-300 pg/ml; human IL-8 (cat no. D8000C), detection range 31.2-2,000 pg/ml; mouse IL-6 (cat no. M6000B), detection range 7.8-500 pg/ml; mouse TNF-α (cat no. MTA00B), detection range 10.9-700 pg/ml; mouse KC (cat no. MKC00B), detection range 15.6-1,000 pg/ml.
Statistical Analysis
Intra-assay Coefficient of Variance (CV%) was calculated by dividing the standard deviation of the sample values by the mean of the values. Likewise, the inter-assay CV% was calculated by dividing the sample standard deviation by the mean of the values. The lower limit of detection occasionally varied from the lowest value on the standard curve when the signal of the “zero” standard was higher than that of the lowest value on the standard curve. In this situation, the lower limit of detection was set in between the “zero” value and the next lowest standard on the standard curve. For spike and recovery analysis, percent recovery was calculated by dividing the measured value by the spiked value after subtracting any baseline signal from the measured sample. Data are summarized with the mean and range. All data analyses were conducted with R version 3.0 (R Core Team).
Development of Standard Validation Protocol
We have developed a standardized validation procedure for our laboratory that uses minimal assay kits (typically 2 × 96 well plates), sample volume and time. Our standard procedure is to determine (1) Intra-assay CV (Coefficients of Variability)% using at least 10 patent or animal derived samples of the matrix of interest (2) Inter-assay CV% on identical samples (minimum of 6) and (3) Percent recovery of spiked standards in appropriate matrix. CV% is calculated as standard deviation/mean × 100 from measurements made in clinical or experimental samples. This protocol was employed in the current study and is routinely used to validate each new assay in our laboratory.
Human Validation
Inter-assay and intra-assay variability were tested on the MSD multiplex platform and compared to R & D Systems singleplex platform, which we have previously validated internally using our standard laboratory protocol. We measured intra-assay (within plate) variability in IL-6 and IL8 using identical patient plasma samples in duplicate (n=40) and calculated the CV% for each sample. In order to calculate the inter-assay (plate to plate) variability within each platform we measured identical patient samples (n= 14) on two different plates on two different days on the MSD platform. To assess the variability between the platforms we assayed 40 identical plasma samples on both the MSD multiplex and on R&D singleplex and calculated the inter-assay CV% for each patient sample. Since samples from actual study patients were assayed, it was not always possible to ensure that samples had never been thawed. For all measurements, every effort was made to use paired, not previously thawed matched samples. When this was not possible, samples were matched for handling (ie. 2 samples from the same patient that had each been thawed once). No sample had undergone more than two previous freeze thaw cycles.
Spike and recovery using MSD recombinant proteins on the MSD platform or R&D proteins on the R&D platform was performed by spiking a known amount of recombinant protein into normal, control plasma. The percent recovered was calculated. To determine whether the results were specific to MSD proteins we spiked the same proteins obtained from R & D Systems into normal, control plasma and calculated percent recovery on the MSD platform. For both the human and mouse validation, we chose to focus our spike and recovery analysis on the lower end of the standard curve since this is where we have found the greatest variability.
Mouse Validation
Inter-assay and intra-assay variability for mouse plasma and bronchoalveolar lavage fluid (BALF) was assessed on both the MSD (plasma n=6, BALF n=26) and R & D (plasma n=7, BALF n=4) platforms. Duplicate measurements of IL-6, KC, and TNF-α were made in the same samples with the MSD 7-plex proinflammatory kit and the R & D platform and the average CV% was calculated. Using mouse plasma and BALF, we determined inter-assay (plate to plate) variability by assaying identical aliquots of mouse BALF (n=4) and plasma (n=7) on both platforms. Identical samples were measured on two different plates on two different days on the MSD platform. All samples were aliquotted in advance and subjected to the same number of freeze/thaw cycles. The inter-assay CV% was calculated for all measurements. To access the variability between the platforms identical mouse plasma and BALF samples were measured on both platforms and CV% was calculated.
Spike and recovery
To determine the efficiency of protein recovery in both plasma and BALF, pooled normal, control samples for both were spiked with a known amount of MSD recombinant proteins and assayed on the MSD platform and percent recovery was calculated. Because of the limited sample volume of mouse samples we did not do spike and recovery of R&D proteins on the MSD platform.
RESULTS
Human Validation
intra-assay variability in human plasma on both platforms
To determine the intra-assay reliability of both platforms we measured the intra-assay CV% for 2 analytes measured on the same 40 patients run in duplicate on each assay. (Table 1).
Table 1.
Intra-assay CVs and comparison for R&D and MSD
| R&D Systems | MSD | R&D vs MSD | |
|---|---|---|---|
| Analyte | Intra-assay CV% Mean (range) | Intra-assay CV% Mean (range) | CV% Mean (range) |
| IL-6 | 2.03 (0.0-8.3) | 3.49 (0.0-10.4) | 16.0 (1.1-33.6) |
| IL-8 | 6.12 (0.0-41.3) | 2.04 (0.1-7.9) | 28.0 (0.1-66.4) |
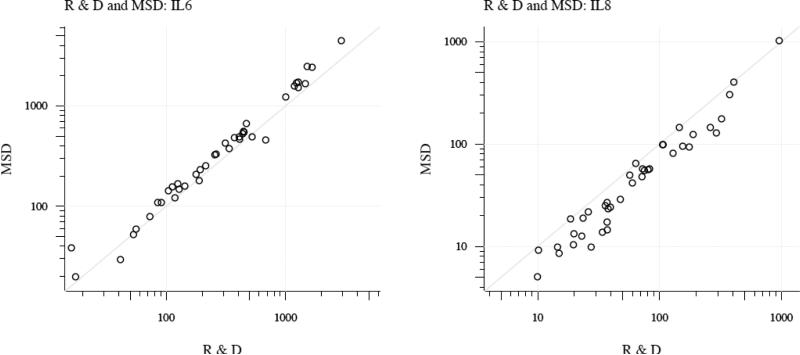
The mean intra-assay CVs for both analytes on both platforms were <10%. On the R&D platform, none of the IL-6 and 8 of the IL-8 measurements had CV%>10% while on the MSD platform one of the IL-6 and none of the IL-8 measurements had values >10%. Values that were below the limit of assay detection were excluded from analysis. For IL-8 measurements, 27.5% of samples on R&D were below the limit of detection while none of the MSD samples were below the limit of detection. For IL-6 measurements all of the samples on both platforms were within the detection range. To determine the concordance between individual samples on the 2 platforms we calculated between assay CVs for the same patient sample run on both platforms. The mean CV% for IL-6 on the 2 platforms was 16.0 and for IL-8 was 28.0. Values from individual samples assayed on both platforms are depicted in Figure 1.
Figure 1. Comparison of patient samples run on MSD and R&D platforms.
Individual patient values are represented as open circles with the cytokine value from R&D plotted on the x axis and the value from MSD on the y axis. Diagonal line represents perfect correlation. R=0.97 for IL-6 and 0.97 for IL-8.
Data from the two platforms show high correlation (0.97 for IL-6; 0.97 for IL-8). Values for IL-6 measured on the MSD platform were slightly higher than on the R & D platform for 35 of 40 samples (p<0.001). Conversely, values for IL-8 measured on the R & D platform were slightly higher than on the MSD platform for all but 2 samples (p<0.001).
Inter-assay variability in human plasma on MSD platform
To test the degree of plate-to-plate variability on the MSD platform we assayed the same 14 patient samples on two different plates run on two different days to calculate inter-assay CVs. For IL-6 the mean inter-assay CV% was 5.24 with a range of 0.59-12.69. For IL-8 the mean inter-assay CV% was 7.02 with a range of 0.71-26.75.
Relationship between CV% and sample concentration
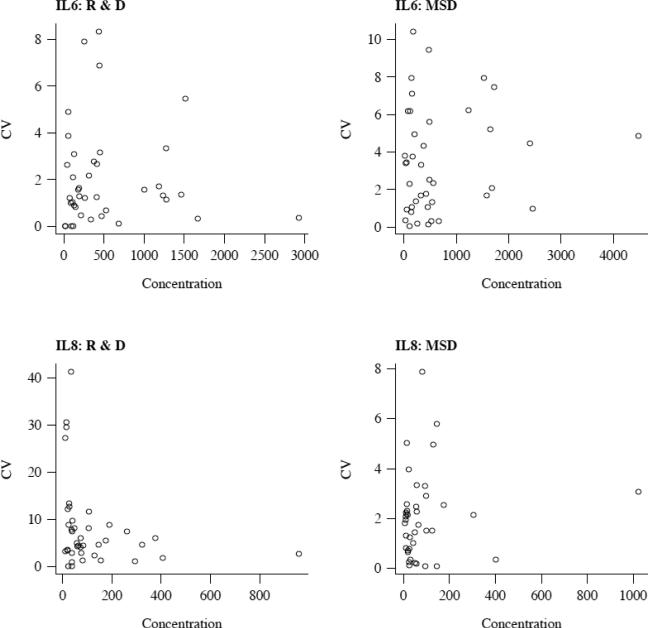
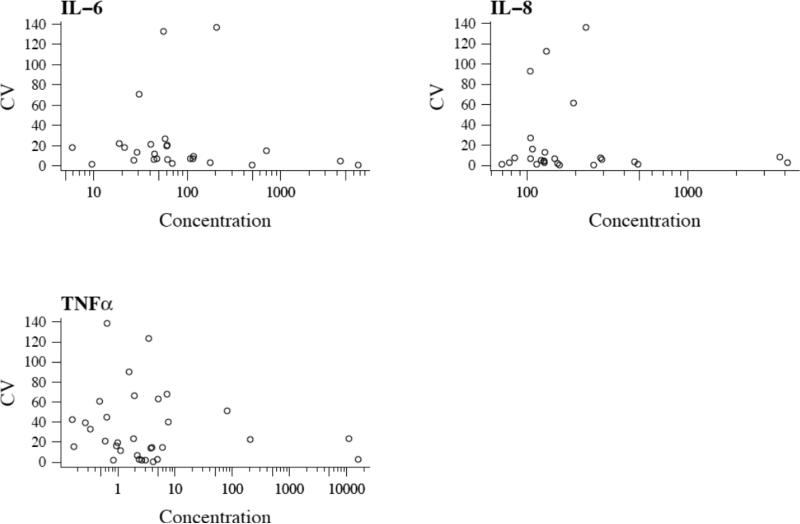
To understand why some analytes and samples had a high CV% we plotted intra-assay CV% versus sample concentration (Figure 2).
Figure 2.
Intra-assay CV percent as a function of concentration. Mean IL-6 or IL-8 concentration from R&D (left panels) and MSD (right panels) is plotted on the x axis and CV% is plotted on the y axis. In general, the lowest protein concentrations have the highest CV%.
We found that in general, the higher intra-assay CV% values occurred at the very low concentration levels.
Spike and recovery
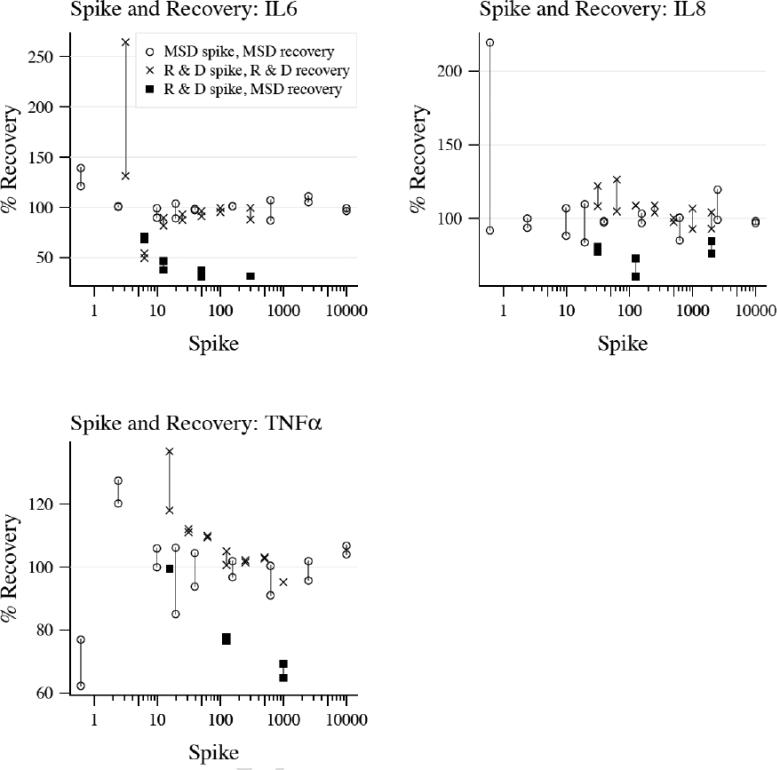
To test whether we could recover a known amount of protein on both platforms we spiked known concentrations of three MSD standard recombinant proteins (IL-6, IL-8, TNF-α) into normal human plasma and tested the amount recovered on the MSD platform. Similarly, we spiked a known concentration of the same three R&D standard recombinant proteins into plasma and tested the amount recovered on the R&D platform (Figure 3).
Figure 3. Spile and recovery for human validation.
Recombinant protein standards form each platform were spiked into control plasma and percent recovery was measured. Black circles represent MSD proteins recovered on the MSD platform, red circles represent R&D proteins recovered on the R&D platform and blue circles represent R&D proteins recovered on MSD platform. Duplicates of each measurement are represented as circles connected by a vertical line.
For all three cytokines, the percent recovery was close to 100% (average percent recovery and range for IL-6 was 103% (88-139%) on MSD and 102% (50-264%) on R&D, IL-8 was 105% (84-220%) on MSD and 106% (93-126%) on R&D and TNF-α was 99% (62-128%) on MSD and 108% (95-137%) on R&D). To test whether recovery would be similar across platforms, we spiked the same three recombinant R&D cytokines into normal plasma and tested recovery on the MSD platform. (Figure 3, blue circles) Percent recovery was not as robust using R&D recombinant proteins on the MSD platform with average recoveries of 45% (31-71%) for IL-6, 75% (61-85%) for IL-8 and 82% (65-99%) for TNF-α.
Mouse validation
Intra-assay variability in mouse plasma and BAL on both platforms
To determine the intra-assay variability in BAL and plasma on both platforms we assayed the same mouse BAL and plasma samples using the MSD mouse 7-plex inflammatory platform and using R&D Systems singleplex ELISAs for IL-6, KC and TNF-α in duplicate and calculated intra-assay CV% for all measurements (Table 2).
Table 2.
Intra-assay CVs for mouse Plasma and BAL on MSD and R&D platforms.
| MSD | R&D | |||
|---|---|---|---|---|
| Analyte | Plasma | BAL | Plasma | BAL |
| IL-6 | 26.6 (1.2-136.7) | 6.8 (0.7-15.2) | 14.9 (2.1-28.6) | 3.0 (1.2-7.7) |
| KC | 25.5 (0.2-136.0) | 4.2 (0.9-8.1) | 4.3 (0.8-15.1) | 1.0 (0.2-1.7) |
| TNF-α | 36.3 (0.5-138.3) | 22.3 (2.4-51.1) | 23.7 (16.6-35.8) | 5.2 (2.9-7.0) |
| IL-10 | 23.5 (1.0-132.4) | 19.7(1.5-88.2) | ||
| IFN-υ | 9.5 (0.7-41.9) | 12.8 (3.2-7.1) | ||
| IL-12p70 | 28.5 (0.0-115.7) | 34.3 (3.6-91.0) | ||
| IL-1β | 13.5 (0.6-27.8) | 8.6 (0.8-24.0) | ||
Inter-assay variability in mouse plasma and BAL on MSD platform
To determine if there was plate-to-plate variability, we assayed the same mouse BAL (n=6) and plasma (n=26) samples on two different plates on two different days on the MSD platform. Table 3 shows the inter-assay CVs for all measurements.
Relationship between CV% and sample concentration
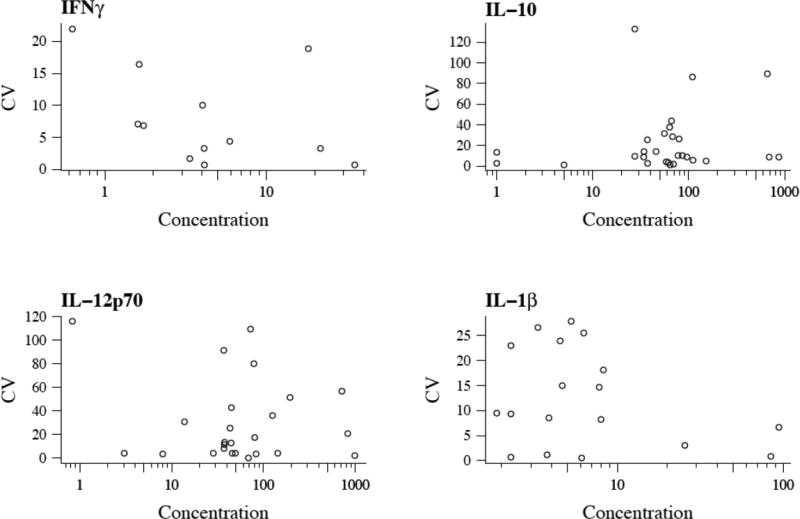
To understand why some analytes and samples had a high CV% we plotted intra-assay CV% versus sample concentration (Figure 5).
Figure 5.
Intra-assay CV percent as a function of concentration. Mean cytokine concentration from MSD is plotted on the x axis and CV% is plotted on the y axis. In general, the lowest protein concentrations have the highest CV%.
Similar to the human validation studies, the higher intra-assay CV% values occurred at the very low concentrations in mouse samples.
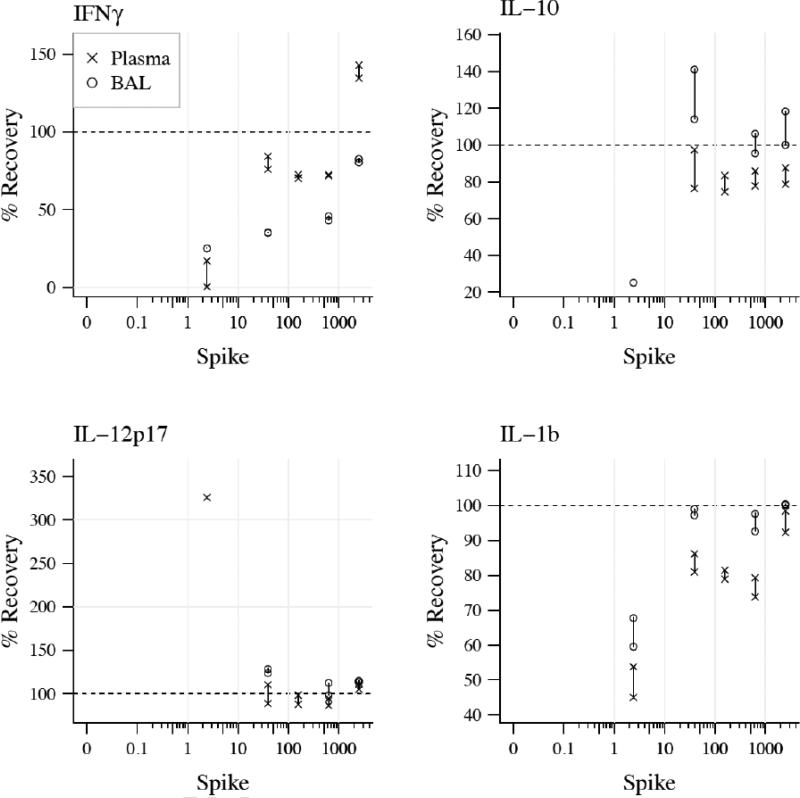
Spike and recovery of MSD proteins in plasma and BAL on MSD platform
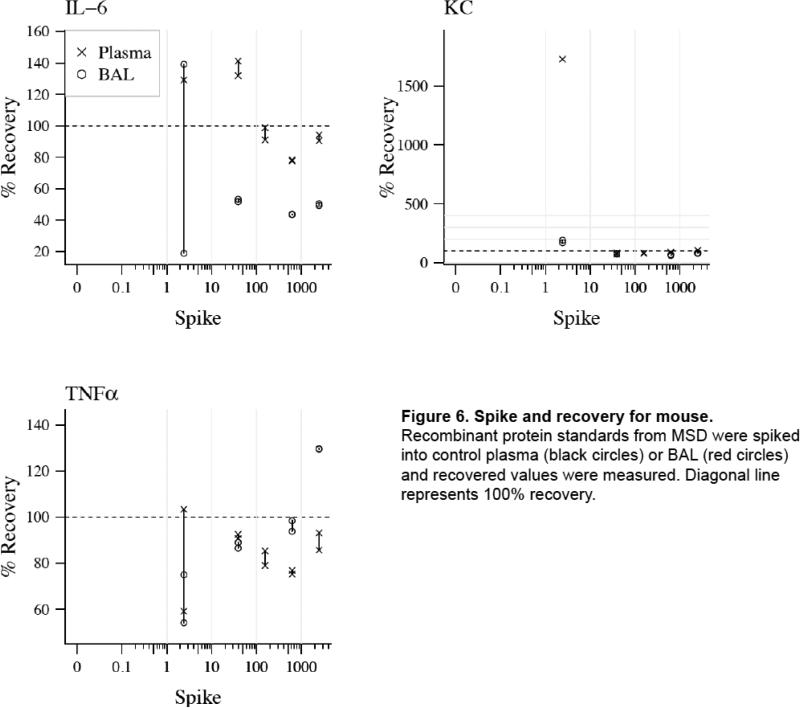
To determine the efficiency of protein recovery in both plasma and BAL, pooled normal samples of BAL and plasma from wild type animals were spiked with known concentrations of MSD recombinant proteins and assayed on the MSD platform. Figure 6 shows recovery efficiency for proteins in both sample matrices.
Figure 6. Spike and recovery for mouse.
Recombinant protein standards from MSD were spiked into control plasma (black circles) or BAL (red circles) and recovered values were measured. Diagonal line represents 100% recovery.
DISCUSSION
Mutliplex immunoassays are used increasingly in clinical and basic research. However, there are few studies that test the accuracy and reproducibility of these new platforms. Here we show that an electrochemiluminscent multiplex immunoassay platform (Meso-Scale Discovery®, MSD) has excellent intra- and inter-assay reliability as well as robust protein recovery efficiency in human plasma. The assay performance was not as robust in mouse BAL and plasma samples. While some validation studies of human assays on the MSD platform have been published (Toedter et al., 2008; Chowdhury et al., 2009; Breen et al., 2011; Eastman et al., 2012; Sloan et al., 2012) this is the first study to thoroughly validate the mouse multiplex immunoassay platform. Strengths of our study include use of clinical samples from studies of critically ill patients with a broad spectrum of cytokine levels rather than normal healthy volunteers, measurement of intra- and inter-assay CVs, comparison of multiplex measurements with validated singleplex ELISAs using identical samples and protein spike and recovery in both plasma (human and mouse) and BAL (mouse).
The MSD platform has been directly compared to other multiplex immunoassay platforms (Bio-Plex, Bio-Rad Laboratories; A2, Beckman Coulter; FAST Quant, Whatman Schleicher & Schuell BioScience; and FlowCytomix, Bender MedSystems) and along with the Bio-Plex had the best assay performance with the highest sensitivity as well as the best performance in spike and recovery studies. (Fu et al., 2010) Similar findings were reported by Chowdhury et al comparing MSD to the Luminex bead-based fluorescence immunoassay platform (Luminex Corp. Texas) who found that MSD had greater sensitivity but Luminex had improved precision at lower analyte concentrations with both platforms performing well at high analyte concentrations (Chowdhury et al., 2009). However, both of these studies used only normal plasma and did not compare measurements in actual study subject plasma samples. A recent large study of over 500 patient plasma samples compared measurements of four biomarkers (C-reactive protein, serum amyloid A soluble intercellular adhesion molecule 1 and soluble vascular adhesion marker 1) using a 4-plex MSD kit and individual ELISA kits. Although sample value ranks correlated strongly between the two platforms, the absolute values in each sample varied greatly (van Bussel et al., 2013).
Similarly, our study shows that the MSD platform performs well with plasma from human study subjects and compares favorably to individual ELISAs for the inflammatory biomarkers measured. All but one plasma cytokine measurement on the MSD platform had an intra-assay CV% <10% while several measurements on the R&D platform had CV%> 10%. MSD has the added advantage of increased sensitivity to detect low concentrations of cytokines. Depending on the study, detecting low concentrations of cytokines may be biologically important. For example, a study of gemcitabine response in patients with advanced pancreatic cancer found that patients with high plasma concentrations of IL-6 were less likely to respond to chemotherapy (Mitsunaga et al., 2013). For this study, high IL-6 was defined as any subject with a value greater than the median of 1.93 pg/ml, a concentration within the detection range of MSD (lower limit of detection of 0.61 pg/ml) but outside of he detection range of R&D (lower limit of detection of 3/12 pg/ml). In our study, while all of the patient samples were within the assay range of IL-6 on both platforms, almost 30% of samples were below the limit of IL-8 detection on R&D but within the range of detection on MSD. The increased sensitivity of the MSD platform could be of major value, especially when assaying for analytes with low concentrations such as IL-8. Dossus et al showed that while single and multiplex assays had good correlation when samples had relatively high concentrations of an analyte, the correlation was poor in subjects with low analyte concentrations (Dossus et al., 2009). Multiplex assays such as MSD have the added advantage of using a smaller sample volume (25 μl/well for multiple analytes) whereas most singleplex ELISAs require 100 μl/well per analyte. Both MSD and R&D have good percent recovery of spiked recombinant proteins however, the percent recovery was lower on MSD when using R&D recombinant proteins spiked into the sample compared to MSD proteins. The reason for the relatively lower percent recovery of R&D proteins on the MSD platform is not clear. The specifics of recombinant protein structure and antibody specificity are proprietary so it is possible that there are structural differences between the recombinant proteins that could affect antibody binding.
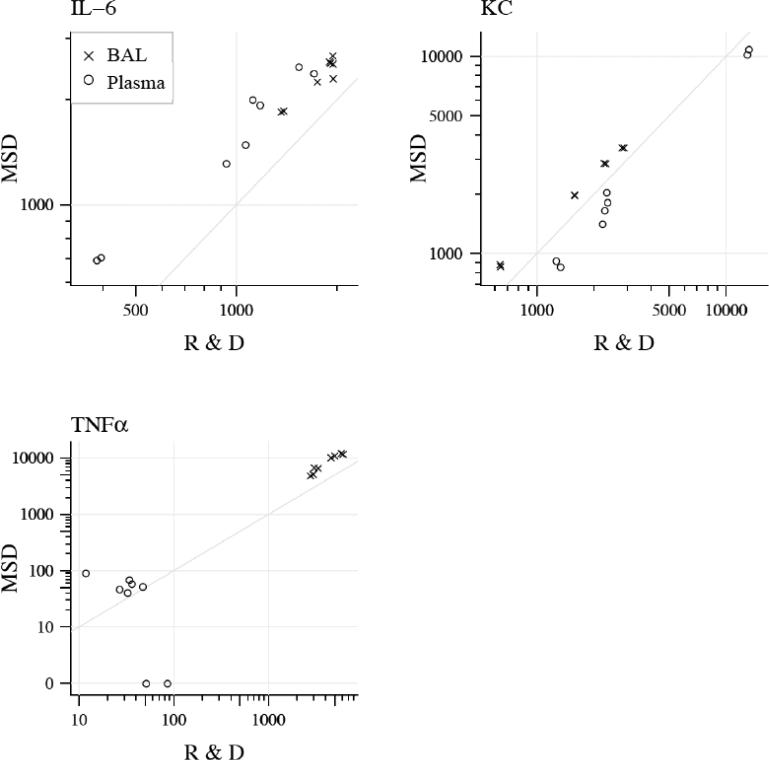
The data from the mouse validation experiments are particularly interesting as there are no published reports of validation of mouse cytokine measurements on any multiplex platform. Others have validated multiplex assays of hormones (Sun et al., 2010) and infectious agents (Ravindran et al., 2010) in mouse plasma but not cytokines. We show that a mouse MSD 7-plex cytokine immunoassay has intra-and inter-assay CV% <30% for the majority of analytes and percent recovery of spiked samples in both plasma (4 of 7 cytokines with mean % recovery 75-125%) and BAL (5 of 7 cytokines with mean % recovery 75-125%) (Figure 6). We did find that TNF-α has a slightly high CV% at 36.3, likely because the plasma values are quite low (average 5.35 pg/ml). In fact, of the 26 plasma samples evaluated, only 8 have values that were within the limit of detection of the assay, the rest being below the limit of detection. Although the R&D KC kit has not been validated for use with heparinized plasma, the tight correlation between KC measured by MSD which has been validated for use with heparinized plasma and the R&D ELISA suggests that the heparin did not present a problem with interference in the R&D assay. We did find good correlation for 3 cytokines between samples measured on the MSD multi-plex platform and R&D single-plex ELISA. Multi-plex immunoassays are especially useful for mouse samples given the small sample volume that is usually available. These findings will be of particular interest to mouse researchers measuring biomarkers in biologic samples.
In our laboratory we have developed a standardized validation protocol for use with clinical samples. One of the main features of our protocol is the use of clinical samples to calculate CV% for each assay rather than samples from normal subjects. This is different from many labs that calculate CV% using normal samples. One reason why this is important and provides a better representation of the assay characteristics is that in biologic samples from study subjects, circulating cytokine receptors, autoantibodies or other inhibitors may bind cytokines and interfere with measurements. Using clinical samples from study subjects and normal controls for validation will account for this possibility. We have found that using experimental samples gives us a better representation of how the assay will perform in our study population. For our spike and recovery studies we use normal samples (whatever matrix our assay will be in for example plasma, BALF, urine, CSF, etc) spiked with a known amount of recombinant protein. The critical aspect of these studies is that they must be done in the same matrix as the experimental samples. Using this simple, efficient validation process we are able to quickly determine if an assay, either single or multi-plex, meets our laboratory standards. While other groups have published similar validation protocols (Valentin et al., 2011; Belabani et al., 2013) the widespread use of systematic assay validation described in the literature is lacking. We recommend that all laboratories develop a validation protocol prior to using any new assay in order to minimize cost and sample waste as well as to optimize the selected platform for each particular study and assay matrix.
Our study has some limitations. Sample preparation and treatment (sample collection technique, storage duration, freeze-thaw exposure, etc) dramatically affect assay performance (see recent review by Keustermans et al (Keustermans et al., 2013) for an excellent comprehensive review of this topic). As our samples were collected in a standardized manner and fresh, newly frozen aliquots of plasma or BAL were used for the study, we did not test sample handling variations as part of this study. For all of the validation in this study, identical aliquots that were exposed to minimal freeze thaw and were not subject to prolonged storage were used. If sample handling issues are expected as part of an experiment, these variables should be tested prior to assay use. In addition, our study is only valid for the specific cytokines measured in human plasma or mouse BALF or plasma. Given that each matrix (plasma, BALF, etc) may have a unique profile of potentially interfering substances it is important to validate any assay in the sample matrix of interest. Others have confirmed this importance when studying sputum, (Bafadhel et al., 2012), urine (Siew et al., 2010; Zhang et al., 2013), and serum compared to plasma (Bea et al., 2011). Additionally, certain patient populations may present challenges when using specific assays. For example, high levels of circulating autoantibodies from patients with rheumatoid arthritis or spondyloarthritis may interfere with measurements of cytokines (Kragstrup et al., 2013), and pre-assay processing may be necessary to obtain accurate results. All of these factors highlight the need to validate each and every new assay platform with both the specific matrix of interest and representative study subject samples prior to assay use in a study cohort.
In summary, we report extensive validation of the MSD multiplex cytokine immunoassay platform in human plasma and mouse plasma and BALF. The MSD performs very well in human plasma and moderately well in mouse BAL and plasma with good intra- and inter-assay CV% for many but not all of the analytes and good percent recovery. In addition, biomarker measurements in the MSD multiplex platform correlated well with the same measurements in a well validated singleplex ELISA (R&D Systems). The MSD multiplex cytokine assays for human and mouse have acceptable performance characteristics.
Figure 4. Comparison of mouse plasma (red) and BAL (black) samples run on MSD and R&D platforms.
Individual values are represented as dots with the cytokine value from R&D plotted on the x axis and the value from MSD on the y axis. Diagonal line represents perfect correlation.
Table 3.
Inter-assay CVs for mouse Plasma and BAL on the same samples assayed on two different days on the MSD platform.
| MSD | ||
|---|---|---|
| Analyte | Plasma | BAL |
| IL-6 | 26.7 (2.0-82.7) | 40.0 (13.1-66.1) |
| KC | 9.2(0.5-14.1) | 14.9 (0.1-33.8) |
| TNF-α | 10.1 (2.7-17.9) | 26.1 (3.0-42.9) |
| IL-10 | 25.0 (5.4-56.7) | 21.7 (0.5-43.0) |
| IFN-υ | 11.6 (0.5-30.7) | 14.4 (7.1-19.7) |
| IL-12p70 | 24.4 (0.8-42.6) | 11.4 (1.1-19.9) |
| IL-1 β | 28.2 (0.2-68.4) | 18.1 (8.9-29.3) |
Acknowledgements
The authors would like to thank Daphne Mitchell, Fred Bossert and Blake Curtis for technical assistance.
Footnotes
Publisher's Disclaimer: This is a PDF file of an unedited manuscript that has been accepted for publication. As a service to our customers we are providing this early version of the manuscript. The manuscript will undergo copyediting, typesetting, and review of the resulting proof before it is published in its final citable form. Please note that during the production process errors may be discovered which could affect the content, and all legal disclaimers that apply to the journal pertain.
References
- Bafadhel M, McCormick M, Saha S, McKenna S, Shelley M, Hargadon B, Mistry V, Reid C, Parker D, Dodson P, Jenkins M, Lloyd A, Rugman P, Newbold P, Brightling CE. Profiling of sputum inflammatory mediators in asthma and chronic obstructive pulmonary disease. Respiration. 2012;83:36–44. doi: 10.1159/000330667. [DOI] [PMC free article] [PubMed] [Google Scholar]
- Bastarache JA, Koyama T, Wickersham NE, Mitchell DB, Mernaugh RL, Ware LB. Accuracy and reproducibility of a multiplex immunoassay platform: a validation study. Journal of immunological methods. 2011;367:33–9. doi: 10.1016/j.jim.2011.01.005. [DOI] [PMC free article] [PubMed] [Google Scholar]
- Bastarache JA, Sebag SC, Clune JK, Grove BS, Lawson WE, Janz DR, Roberts JL, 2nd, Dworski R, Mackman N, Ware LB. Low levels of tissue factor lead to alveolar haemorrhage, potentiating murine acute lung injury and oxidative stress. Thorax. 2012;67:8. doi: 10.1136/thoraxjnl-2012-201781. [DOI] [PMC free article] [PubMed] [Google Scholar]
- Bea JW, Wright NC, Thompson P, Hu C, Guerra S, Chen Z. Performance evaluation of a multiplex assay for future use in biomarker discovery efforts to predict body composition. Clin Chem Lab Med. 2011;49:817–24. doi: 10.1515/CCLM.2011.122. [DOI] [PMC free article] [PubMed] [Google Scholar]
- Belabani C, Rajasekharan S, Poupon V, Johnson T, Bar-Or A. A condensed performance-validation strategy for multiplex detection kits used in studies of human clinical samples. Journal of immunological methods. 2013;387:1–10. doi: 10.1016/j.jim.2012.08.002. [DOI] [PubMed] [Google Scholar]
- Breen EC, Reynolds SM, Cox C, Jacobson LP, Magpantay L, Mulder CB, Dibben O, Margolick JB, Bream JH, Sambrano E, Martinez-Maza O, Sinclair E, Borrow P, Landay AL, Rinaldo CR, Norris PJ. Multisite comparison of high-sensitivity multiplex cytokine assays. Clinical and vaccine immunology . CVI. 2011;18:1229–42. doi: 10.1128/CVI.05032-11. [DOI] [PMC free article] [PubMed] [Google Scholar]
- Calfee CS, Eisner MD, Parsons PE, Thompson BT, Conner ER, Jr., Matthay MA, Ware LB. Soluble intercellular adhesion molecule-1 and clinical outcomes in patients with acute lung injury. Intensive Care Med. 2008 doi: 10.1007/s00134-008-1235-0. [DOI] [PMC free article] [PubMed] [Google Scholar]
- Chandra PE, Sokolove J, Hipp BG, Lindstrom TM, Elder JT, Reveille JD, Eberl H, Klause U, Robinson WH. Novel multiplex technology for diagnostic characterization of rheumatoid arthritis. Arthritis Res Ther. 2011;13:R102. doi: 10.1186/ar3383. [DOI] [PMC free article] [PubMed] [Google Scholar]
- Chowdhury F, Williams A, Johnson P. Validation and comparison of two multiplex technologies, Luminex and Mesoscale Discovery, for human cytokine profiling. Journal of immunological methods. 2009;340:55–64. doi: 10.1016/j.jim.2008.10.002. [DOI] [PubMed] [Google Scholar]
- Christie JD, Shah CV, Kawut SM, Mangalmurti N, Lederer DJ, Sonett JR, Ahya VN, Palmer SM, Wille K, Lama V, Shah PD, Shah A, Weinacker A, Deutschman CS, Kohl BA, Demissie E, Bellamy S, Ware LB. Plasma levels of receptor for advanced glycation end products, blood transfusion, and risk of primary graft dysfunction. Am J Respir Crit Care Med. 2009;180:1010–5. doi: 10.1164/rccm.200901-0118OC. [DOI] [PMC free article] [PubMed] [Google Scholar]
- Discovery MS. 2012 In. [Google Scholar]
- Dossus L, Becker S, Achaintre D, Kaaks R, Rinaldi S. Validity of multiplex-based assays for cytokine measurements in serum and plasma from “non-diseased” subjects: comparison with ELISA. Journal of immunological methods. 2009;350:125–32. doi: 10.1016/j.jim.2009.09.001. [DOI] [PubMed] [Google Scholar]
- Eastman PS, Manning WC, Qureshi F, Haney D, Cavet G, Alexander C, Hesterberg LK. Characterization of a multiplex, 12-biomarker test for rheumatoid arthritis. Journal of pharmaceutical and biomedical analysis. 2012;70:415–24. doi: 10.1016/j.jpba.2012.06.003. [DOI] [PubMed] [Google Scholar]
- Ellington AA, Kullo IJ, Bailey KR, Klee GG. Measurement and quality control issues in multiplex protein assays: a case study. Clin Chem. 2009;55:1092–9. doi: 10.1373/clinchem.2008.120717. [DOI] [PMC free article] [PubMed] [Google Scholar]
- Ellington AA, Kullo IJ, Bailey KR, Klee GG. Antibody-based protein multiplex platforms: technical and operational challenges. Clin Chem. 2010;56:186–93. doi: 10.1373/clinchem.2009.127514. [DOI] [PMC free article] [PubMed] [Google Scholar]
- Fu Q, Zhu J, Van Eyk JE. Comparison of multiplex immunoassay platforms. Clinical chemistry. 2010;56:314–8. doi: 10.1373/clinchem.2009.135087. [DOI] [PMC free article] [PubMed] [Google Scholar]
- Janz DR, Bastarache JA, Sills G, Wickersham N, May AK, Bernard GR, Ware LB. Association between haptoglobin, hemopexin and mortality in adults with sepsis. Critical care. 2013;17:R272. doi: 10.1186/cc13108. [DOI] [PMC free article] [PubMed] [Google Scholar]
- Keustermans GC, Hoeks SB, Meerding JM, Prakken BJ, de Jager W. Cytokine assays: an assessment of the preparation and treatment of blood and tissue samples. Methods. 2013;61:10–7. doi: 10.1016/j.ymeth.2013.04.005. [DOI] [PubMed] [Google Scholar]
- Kragstrup TW, Vorup-Jensen T, Deleuran B, Hvid M. A simple set of validation steps identifies and removes false results in a sandwich enzyme-linked immunosorbent assay caused by anti-animal IgG antibodies in plasma from arthritis patients. Springerplus. 2013;2:263. doi: 10.1186/2193-1801-2-263. [DOI] [PMC free article] [PubMed] [Google Scholar]
- Li D, Chiu H, Gupta V, Chan DW. Validation of a multiplex immunoassay for serum angiogenic factors as biomarkers for aggressive prostate cancer. Clin Chim Acta. 2012;413:1506–11. doi: 10.1016/j.cca.2012.06.017. [DOI] [PMC free article] [PubMed] [Google Scholar]
- Mitsunaga S, Ikeda M, Shimizu S, Ohno I, Furuse J, Inagaki M, Higashi S, Kato H, Terao K, Ochiai A. Serum levels of IL-6 and IL-1beta can predict the efficacy of gemcitabine in patients with advanced pancreatic cancer. Br J Cancer. 2013;108:2063–9. doi: 10.1038/bjc.2013.174. [DOI] [PMC free article] [PubMed] [Google Scholar]
- Ostendorff HP, Awad A, Braunschweiger KI, Liu Z, Wan Z, Rothschild KJ, Lim MJ. Multiplexed VeraCode bead-based serological immunoassay for colorectal cancer. Journal of immunological methods. 2013 doi: 10.1016/j.jim.2013.09.013. [DOI] [PMC free article] [PubMed] [Google Scholar]
- Ravindran R, Khan IH, Krishnan VV, Ziman M, Kendall LV, Frasier JM, Bates R, Griffey SM, Fahey JR, Luciw PA. Validation of multiplex microbead immunoassay for simultaneous serodetection of multiple infectious agents in laboratory mouse. Journal of immunological methods. 2010;363:51–9. doi: 10.1016/j.jim.2010.10.003. [DOI] [PubMed] [Google Scholar]
- Richens JL, Urbanowicz RA, Metcalf R, Corne J, O'Shea P, Fairclough L. Quantitative validation and comparison of multiplex cytokine kits. J Biomol Screen. 2010;15:562–8. doi: 10.1177/1087057110362099. [DOI] [PubMed] [Google Scholar]
- Salvante KG, Brindle E, McConnell D, O'Connor K, Nepomnaschy PA. Validation of a new multiplex assay against individual immunoassays for the quantification of reproductive, stress, and energetic metabolism biomarkers in urine specimens. Am J Hum Biol. 2012;24:81–6. doi: 10.1002/ajhb.21229. [DOI] [PMC free article] [PubMed] [Google Scholar]
- Siew ED, Ikizler TA, Gebretsadik T, Shintani A, Wickersham N, Bossert F, Peterson JF, Parikh CR, May AK, Ware LB. Elevated urinary IL-18 levels at the time of ICU admission predict adverse clinical outcomes. Clin J Am Soc Nephrol. 2010;5:1497–505. doi: 10.2215/CJN.09061209. [DOI] [PMC free article] [PubMed] [Google Scholar]
- Sloan JH, Siegel RW, Ivanova-Cox YT, Watson DE, Deeg MA, Konrad RJ. A novel high-sensitivity electrochemiluminescence (ECL) sandwich immunoassay for the specific quantitative measurement of plasma glucagon. Clin Biochem. 2012;45:1640–4. doi: 10.1016/j.clinbiochem.2012.07.111. [DOI] [PubMed] [Google Scholar]
- Sun M, Manolopoulou J, Spyroglou A, Beuschlein F, Hantel C, Wu Z, Bielohuby M, Hoeflich A, Liu C, Bidlingmaier M. A microsphere-based duplex competitive immunoassay for the simultaneous measurements of aldosterone and testosterone in small sample volumes: validation in human and mouse plasma. Steroids. 2010;75:1089–96. doi: 10.1016/j.steroids.2010.07.005. [DOI] [PubMed] [Google Scholar]
- Toedter G, Hayden K, Wagner C, Brodmerkel C. Simultaneous detection of eight analytes in human serum by two commercially available platforms for multiplex cytokine analysis. Clin Vaccine Immunol. 2008;15:42–8. doi: 10.1128/CVI.00211-07. [DOI] [PMC free article] [PubMed] [Google Scholar]
- Valentin MA, Ma S, Zhao A, Legay F, Avrameas A. Validation of immunoassay for protein biomarkers: bioanalytical study plan implementation to support pre-clinical and clinical studies. Journal of pharmaceutical and biomedical analysis. 2011;55:869–77. doi: 10.1016/j.jpba.2011.03.033. [DOI] [PubMed] [Google Scholar]
- van Bussel BC, Ferreira I, van de Waarenburg MP, van Greevenbroek MM, van der Kallen CJ, Henry RM, Feskens EJ, Stehouwer CD, Schalkwijk CG. Multiple inflammatory biomarker detection in a prospective cohort study: a cross-validation between well-established single-biomarker techniques and an electrochemiluminescense-based multi-array platform. PLoS One. 2013;8:e58576. doi: 10.1371/journal.pone.0058576. [DOI] [PMC free article] [PubMed] [Google Scholar]
- Ware LB, Koyama T, Billheimer DD, Wu W, Bernard GR, Thompson BT, Brower RG, Standiford TJ, Martin TR, Matthay MA. Prognostic and pathogenetic value of combining clinical and biochemical indices in patients with acute lung injury. Chest. 2010;137:288–96. doi: 10.1378/chest.09-1484. [DOI] [PMC free article] [PubMed] [Google Scholar]
- Ware LB, Koyama T, Zhao Z, Janz DR, Wickersham N, Bernard GR, May AK, Calfee CS, Matthay MA. Biomarkers of lung epithelial injury and inflammation distinguish severe sepsis patients with acute respiratory distress syndrome. Critical care. 2013;17:R253. doi: 10.1186/cc13080. [DOI] [PMC free article] [PubMed] [Google Scholar]
- Zhang X, Gibson B, Jr., Mori R, Snow-Lisy D, Yamaguchi Y, Campbell SC, Simmons MN, Daly TM. Analytical and biological validation of a multiplex immunoassay for acute kidney injury biomarkers. Clin Chim Acta. 2013;415:88–93. doi: 10.1016/j.cca.2012.09.022. [DOI] [PubMed] [Google Scholar]


