Abstract
This work presents a 3D tailored RF slab-select pulse for reducing the B1 field inhomogeneity at 3T and possibly higher applied field strengths. The small tip angle approximation is used to design a compensated 3D slice profile from a map of the B1 inhomogeneity. The SNR improvement and degree and artifact reduction were evaluated in NiCl2 doped phantom experiments. The method was also implemented in-vivo in the human brain where it was found to be effective in reducing inhomogeneities as large as 35% of the peak image magnitude in all three spatial directions in the brain. The main drawback of the technique is long pulse lengths.
INTRODUCTION
The use of high static magnetic fields (B0) such as 3T and 4T and even ultra-high fields such as 7T and higher is of current interest in human MRI applications. The advantages of a high B0 include increased SNR (1-3) and increased contrast to noise ratio for functional MRI (4-7). However, a major disadvantage of a high B0 is image artifacts from increased RF field (B1) inhomogeneity (8-11). This is a result of the B1 wavelength becoming comparable to the size of the imaged object as the wavelength decreases with increasing B0. This problem is worsened by the interaction of the RF field with the dielectric and conductive properties of the human body, which further reduce the wavelength and attenuate the amplitude. The resultant standing wave and penetration behavior of the B1 effectively leads to a spatial distribution of flip angles and receiver sensitivities, producing areas of increased and decreased magnitude in the images.
Several methods have been proposed to mitigate B1 inhomogeneity artifacts including novel RF coil designs (12-14), adiabatic RF pulses (15), small tip angle 2D tailored RF pulses (16,17), and using active transmit power modulation (18). Although improving the RF coil performance is clearly a necessary step for homogeneous transmission and reception, it may be unlikely that coils alone will be able to remove all inhomogeneity because the effect also depends on the sample’s geometry and its physical properties. Adiabatic pulses are problematic for many imaging applications because of increased power deposition or SAR in the subject. The 2D tailored RF pulse method does not provide a complete 3D correction and uses an approximation to the field inhomogeneity. For the active transmit power modulation technique, the B1 profile was first measured along z-axis and then compensated by scaling the RF transmitter power as a function of slice position. This method works well if coil geometry effects are the more dominant source of B1 inhomogeneity than the sample’s dielectric or conductive properties.
We propose a novel method to reduce the B1 inhomogeneity at 3T and possibly higher magnetic field strengths using 3D tailored RF (TRF) pulses (19-22). The pulses use a 3D map of the B1 inhomogeneity acquired in-vivo as a pre-scan and are implemented as slab-select pulses for 3D imaging. Compared to our previous work using 3D TRF slice-select pulses for susceptibility artifact reduction, the slab-select 3D TRF implementation is more practical because it allows for relatively short pulse lengths. Furthermore, the spatial variation of the B1 inhomogeneity is slow enough that only a low-resolution map is required, which further reduces the length of the pulse. Below we demonstrate the technique with imaging experiments using a NiCl2 doped phantom and normal human brains in vivo at 3T.
THEORY
Ignoring relaxation and off-resonance, the MR signal at time t for a gradient echo and small tip angles α(r) can be written as
| [1] |
In the above equation, V is the volume of the coil, Gacq(s) are the acquisition gradients, W(r) is the spatial weighting due to selective excitation, and C(r) is the coil receive sensitivity. The spatial dependencies of α(r) and C(r) reflect the effects of an inhomogeneous B1 field and will be present in the reconstructed image I(r) of the spin density ρ(r):
| [2] |
Although the exact form of the above equations depends on the specific details of the acquisition, hardware, and reconstruction, they are generally applicable to methods described here.
The B1 inhomogeneity artifacts in I(r) can be reduced by designing 3D TRF pulses using the small tip angle approximation (23). The small tip angle approximation equates the pulse waveform P(t) to the Fourier transform of the desired slice profile W(k(t)), weighted by the k-space velocity produced by the gradients G(t) applied during excitation:
| [3] |
This equation is technically valid for tip angles less than 30° and is found to hold well for angles on the order of 90° (24). In the above equation, W(k(t)) is defined as
| [4] |
The excitation k-space trajectory k(t) is equal to the area remaining under the gradients at time t and the end of the pulse T. Any arbitrary W(r) can be tailored provided that sampling requirements are met by k(t). The practical issue is that often a pulse of unreasonable length is needed to excite a profile W(r) with the desired resolution and no aliasing and implementation of 3D TRF pulses often requires a multi-shot modality (21). It can be seen from Eq. [2] that the B1 inhomogeneity can be removed if the excitation profile is tailored to have the spatial distribution
| [5] |
In this equation W0(r) is the desired uniform 3D slice profile. Either in vivo measurements or theoretical calculations of α(r) and C(r) can be used.
METHODS
Pulse Construction
The 3D TRF pulses were designed for a General Electric (GE Medical Systems, Waukesha, WI) 3T imaging system with a standard head coil and a body gradient with a 150 T/m/sec slew rate and a 40 mT/m peak. A two-shot interleaved stacked-spiral k-space trajectory was used for the excitation. Figure 1 shows a diagram of a two-shot stacked-spiral trajectory where the solid and dashed lines represent each shot. The excitation profile W0(r) was a Fourier transform of a sinc function (a “rect” function) along z and a Fermi function along the in-plane coordinate ρ:
| [6] |
FIG. 1.
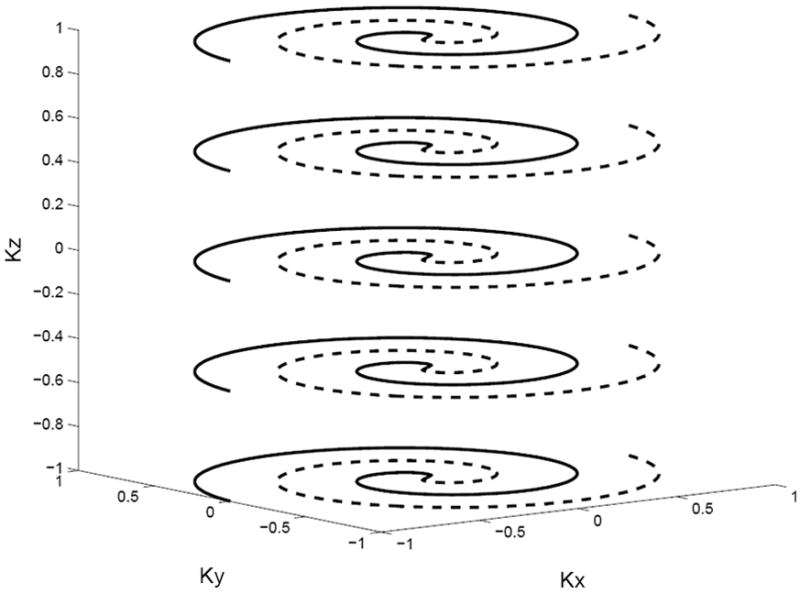
Diagram of a two-shot 3D stacked spiral k-space trajectory used for the 3D TRF pulses.
In this equation, z0 and 2ρ0 are the effective slice thicknesses along z and ρ, respectively, and w is a parameter that controls the steepness of the edges of the Fermi function. Equation [6] represents a profile that is essentially a cylinder. The rect function was smoothed with a Hamming filter to reduce ripple along the z-direction. The slab thickness z0 was 10 cm and the in-plane radius ρ0 was 12 cm. It is convenient to describe 3D TRF pulses by an “excitation resolution” and an “excitation FOV” in the xyz-directions. These were 1.25×2.0×2.0 cm3 and 20×24×24 cm3, respectively. The excitation resolution determines the degree to which small changes in the slice profile can be tailored and the excitation FOV determines the separation between slice aliases. The resultant pulse length was approximately 11 ms for each shot. Figure 2 shows Bloch equation simulations of the profile W0(r) plotted versus x-y and x-z using the 3D TRF pulse at a 20° flip angle. The 3D TRF pulses were inserted into a standard 3D stacked-spiral (25) pulse sequence for use on the scanner.
FIG. 2.
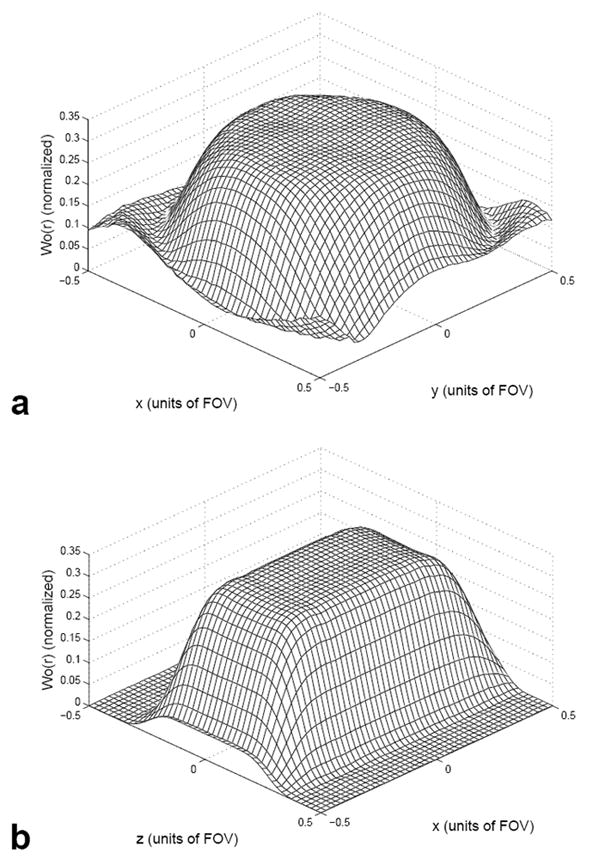
Mesh plots of the excited magnetization W0(r) in the x-y (a) and x-z (b) directions generated from Bloch equation simulations using a 3D TRF pulse as input.
Maps of the B1 inhomogeneity were acquired in vivo as part of the pre-scan procedure. The maps were generated from 3D images acquired over the same FOV as the pulse, smoothed down to match the pulse resolution: 16×12×12 matrix size over a 20×24×24 cm3 FOV. The effect of the smoothing process can be understood from Eq. [2]. By reducing the resolution of I(r), the spin density becomes approximately uniform and the resultant image M(r) is a map of the coil sensitivity times the flip angle:
| [7] |
The excited slice profile was assumed to be uniform (W(r) = W0(r)). The smoothing of the 3D image was done using a Gaussian filter with the full width at half maximum matched to the excitation resolution of the pulse. Equations [3], [5], and [6] were then used to determine the correct 3D TRF pulse profile. In practice, however, the division required by Eq. [5] produced singularities and errors amplified by noise in the measurement of M(r). Therefore, it was found for a simple proof of concept to be more convenient to either window or subtract out the mean of M(r) such that
| [8] |
In this case the desired profile is determined by
| [9] |
The approximation in Eq. [9] holds if ΔM(r) is small compared to unity. Figure 3 (a) shows an example of a 3D image from a human brain displayed as sixteen 2D slices and (b) shows the smoothed and windowed image approximating ΔM(r). Figure 3 (c) shows the uniform profile W0(r) and (d) shows the compensated profile W(r). Figure 4 shows an example of one shot from a two-shot 3D TRF pulse using W(r) as input. Figure 5 shows Bloch equation simulations of the profile W(r) plotted versus x-y and x-z using the 3D TRF pulse at a 20° flip angle. Compared to Fig. 2, these profiles now excite the inverse of the spatial variation due to B1 inhomogeneity. All of the image processing and pulse construction programs were written in Matlab (The Mathworks Inc., Natick, MA) running on the scanner console.
FIG. 3.
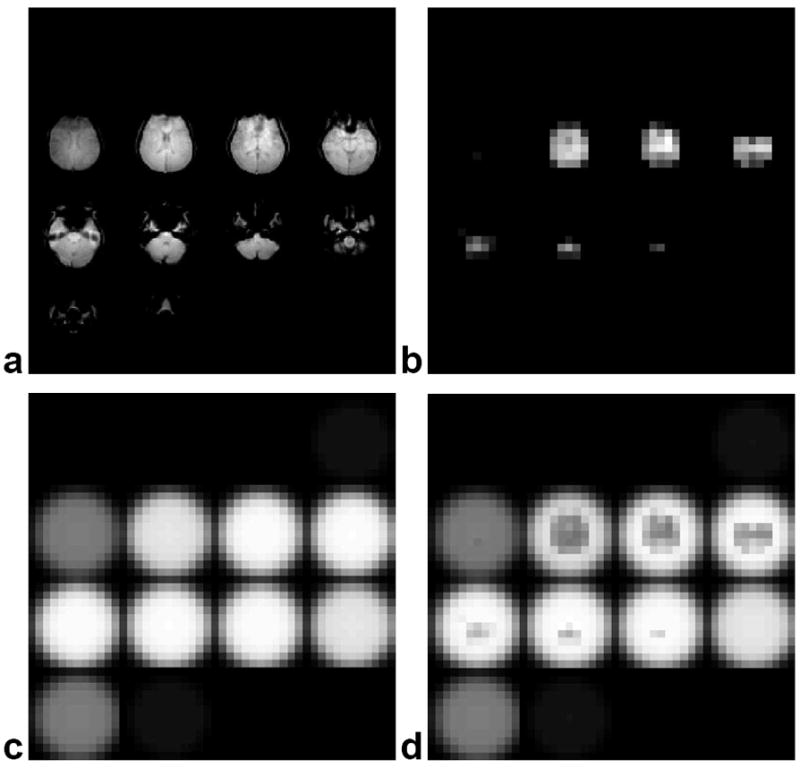
Three-dimensional images displayed as slices of a human brain and subsequent slice profiles used for the 3D TRF pulses. (a) Initial brain images acquired for input into 3D TRF pulse algorithm. (b) Smoothed and windowed brain images used to approximate the degree of B1 inhomogeneity ΔM(r). (c) Desired uniform slice profile W0(r). (d) Modified slice profile W(r) generated from M(r) used to excite a uniform slice profile.
FIG. 4.
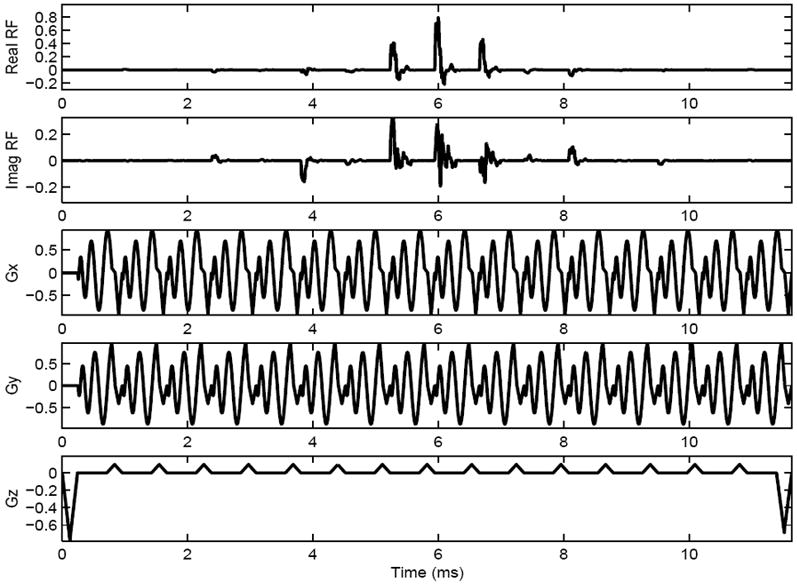
Diagram of one shot from a two-shot 3D TRF pulse with B1 inhomogeneity compensation tailored into the pulse. The rows from top to bottom are the real part of the RF, the imaginary part of the RF, the x-, y-, and z-gradients, respectively.
FIG. 5.
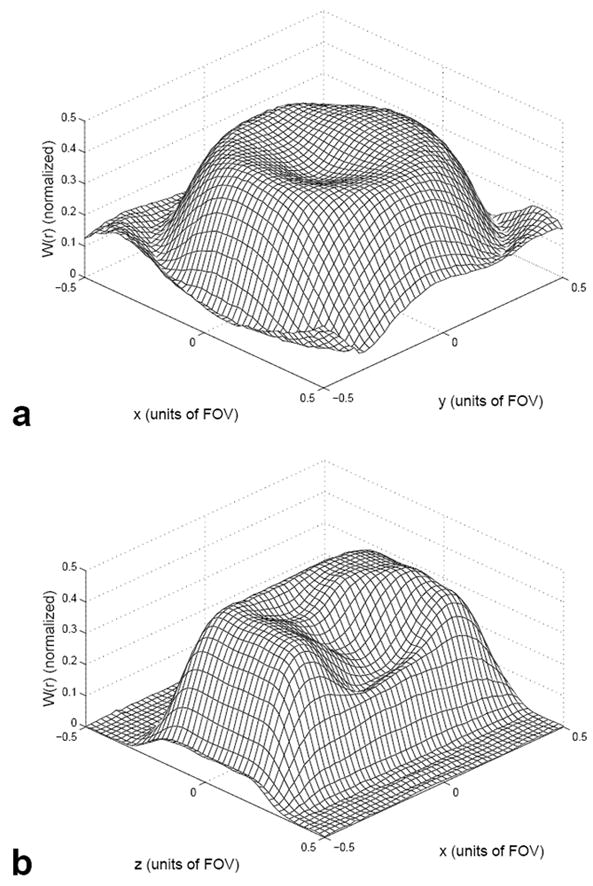
Mesh plots of the excited magnetization W(r) in the x-y (a) and x-z (b) directions generated from Bloch equation simulations using a 3D TRF B1 inhomogeneity compensated pulse as input.
Imaging Experiments
Phantom and human imaging experiments were performed to test the method in vivo. The 3D TRF pulse parameters and construction methods were identical to that described above other than the flip angle used. The phantom experiments used a 20 cm NiCl2 doped TLT phantom where a substantial amount of B1 inhomogeneity was observed at 3T. The 3D stacked spiral acquisition had a 64×64×16 (xyz) matrix size, TR = 50 ms, TE = 8 ms, and FOV = 24 cm. Phantom images were acquired using a standard 10 cm (minimum phase SLR) slab-select pulse and the 3D TRF slab-select pulse with B1 inhomogeneity compensation. A flip angle of 25° was used. The amplitude P(t) of the 3D TRF pulses was adjusted manually during pre-scan to obtain the correct flip angle compared to the conventional slab-select pulse. Experiments were also performed on three normal human volunteers in different scan sessions. Similar to the phantom experiments, a standard slab-select pulse and a 3D TRF pulses with B1 inhomogeneity compensation, both with a 25° flip angle, were used. The 3D stacked spiral acquisition had a 128×128×64 resolution using four spiral interleaves, TR = 50 ms, TE = 8 ms, and FOV = 24 cm.
RESULTS
Figure 6 (a) shows a 3D image of the NiCl2 phantom displayed as a series of sixteen 2D slices acquired using the standard slab-select pulse. Note that the images have decreased magnitude near the outer edges due to inhomogeneity in the B1 field. Figure 6 (b) shows an image of the same phantom acquired after being excited by a 3D TRF pulse with B1 inhomogeneity compensation. The resultant images have a more uniform magnitude. A 1 cm3 ROI was taken near the edge of the phantom where a large degree of B1 inhomogeneity was present. The SNR in the ROI was measured as 88.4 and 55.6 from the images excited by the 3D TRF and standard slab-select pulse, respectively. Plots of the image magnitude profile through the center of the phantom along the L-R direction are plotted in Fig. 7 (a). The solid and dashed lines are the profiles through the phantom with and without using the 3D TRF pulse. The profile using the 3D TRF pulse shows a flatter profile with recovered image magnitude near the edges. A plot of the difference between the solid and dashed lines in (a), normalized to maximum of the image acquired without the 3D TRF pulse, is shown in (b).
FIG. 6.
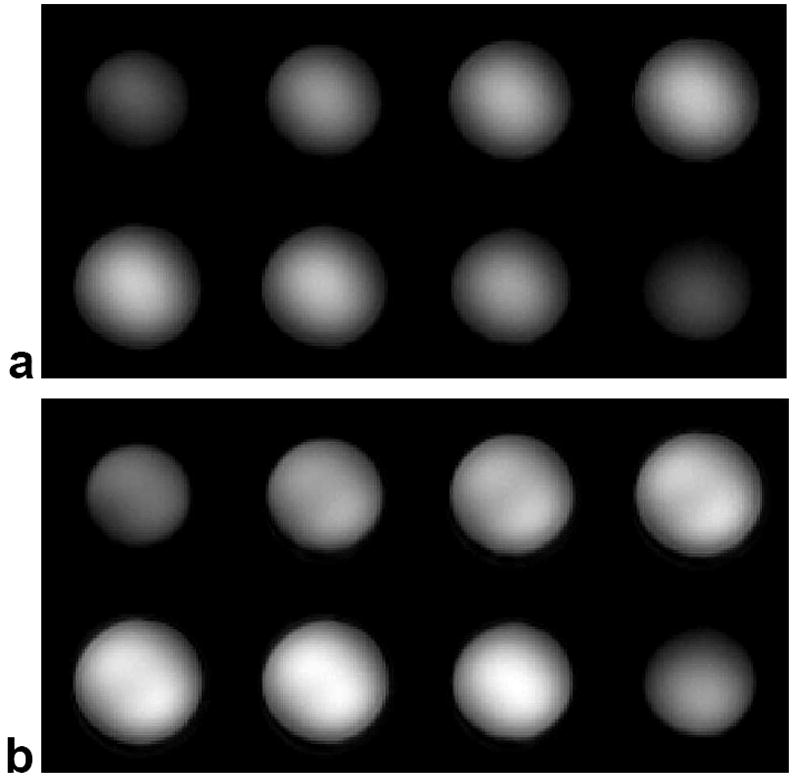
Three-dimensional images at 3T of a uniform NiCl2 phantom displayed as slices. (a) Image excited with a standard sinc-shaped slab-select pulse. (b) Image excited with the 3D TRF B1 inhomogeneity compensated slab-select pulse.
FIG. 7.
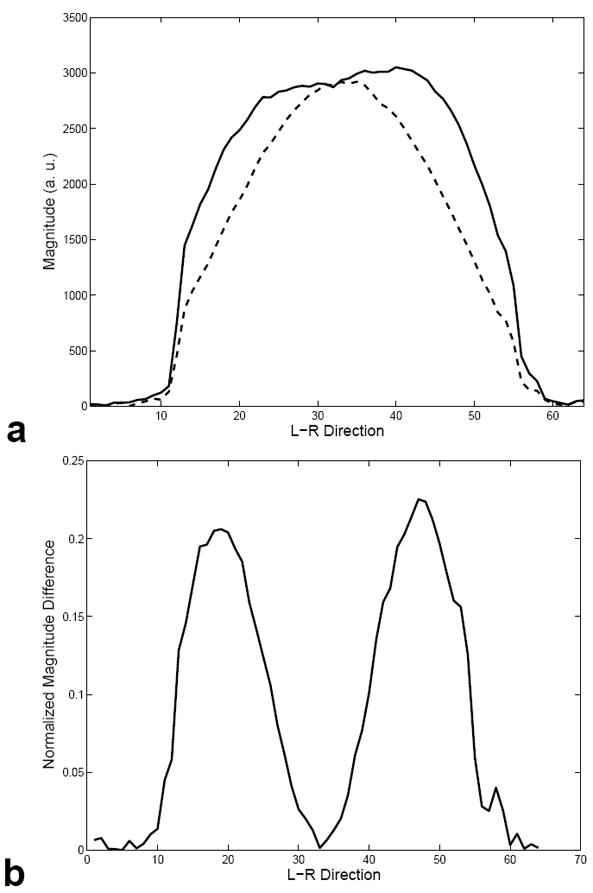
(a) Plot of the profile along the L-R direction through middle of the volume shown in Fig. 6 (a) and (b) shown with dashed and dotted lines, respectively. The image excited with the 3D TRF pulse shows a more uniform image magnitude between the edges and the center. (b) Plot of the normalized difference between the profiles shown in (a).
Figure 8 (a) shows a representative 3D image from one of the human subjects displayed as a series of 2D slices acquired using the standard slab-select pulse. The images are brighter in the center than at the edges due to B1 inhomogeneity. Figure 8 (b) shows the same 3D image in the same subject acquired using the 3D TRF slab-select pulse. The images show a more uniform image magnitude than those acquired with the standard slab-select pulse. Figure 9 shows the same 3D image displayed as 2D slices along the axial, sagittal, and coronal directions through the center of the volume. Column (a) and (b) are the images acquired without and with the 3D TRF pulse, respectively. Column (c) shows images of the difference between columns (a) and (b) windowed between −0.35 and 0.35. In (c) the images were first normalized to the maximum magnitude of the image shown in (a) before subtraction. These images show that the 3D TRF pulse was able to compensate for variations as large as 35% of the peak image magnitude.
FIG. 8.
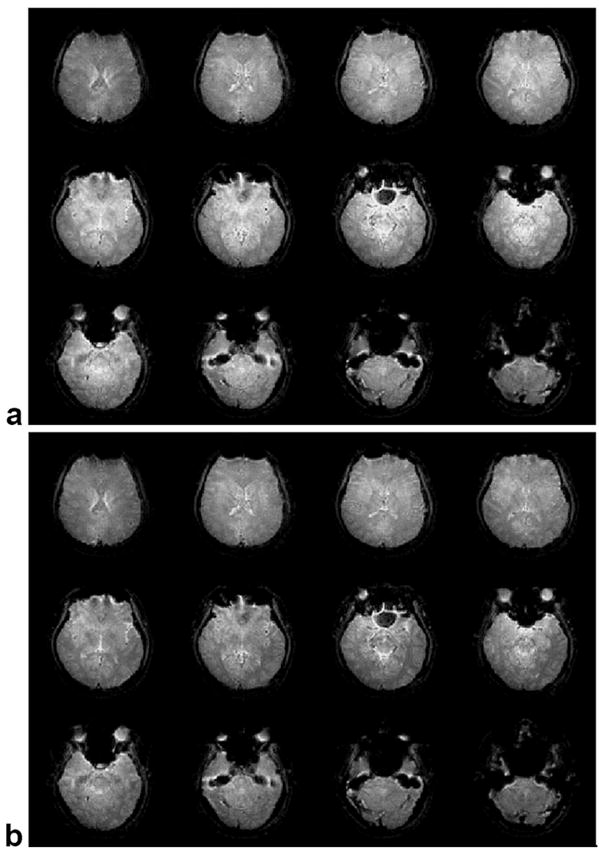
Three-dimensional images at 3T of a human brain in vivo displayed as slices. (a) Image excited with a standard slab-select pulse. (b) Image excited with the 3D TRF B1 inhomogeneity compensated slab-select pulse. The image excited with the 3D TRF pulse shows a more uniform image magnitude between the edges and the center.
FIG. 9.
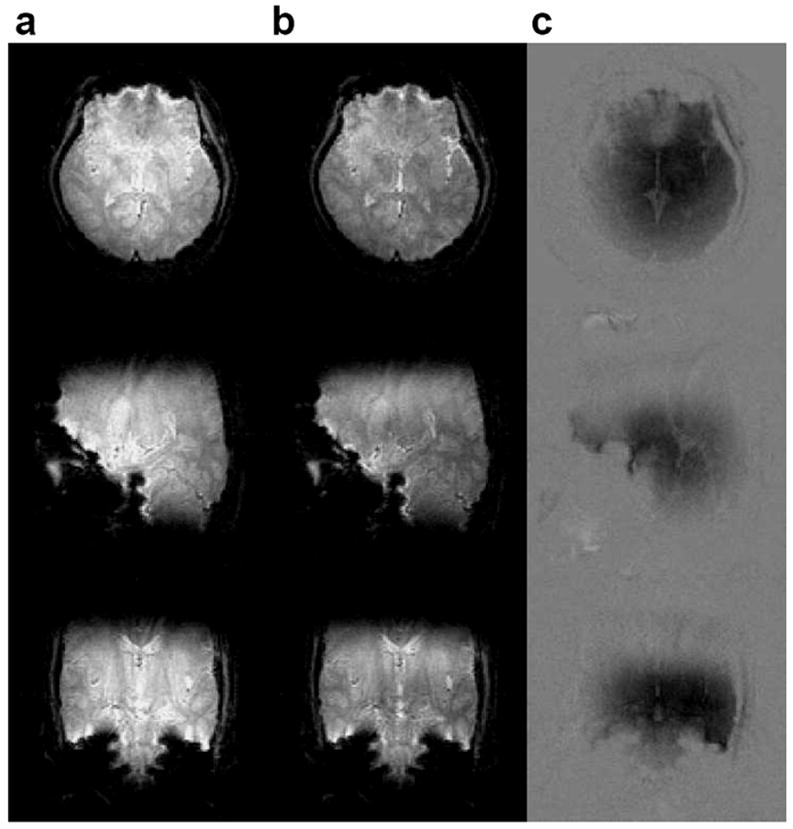
Center slices through a 3D image of a human brain acquired at 3T. The slices are displayed as axial (top), sagittal (middle) and coronal (bottom) 2D images. The images in column (a) and (b) were acquired with a standard slab-select pulse and a 3D TRF pulse, respectively. Column (c) shows images of the normalized difference between columns (a) and (b) windowed between −0.35 and 0.35.
DISCUSSION
This work shows that anatomically accurate maps of the flip angle and coil receive sensitivity can be used to construct small tip angle, slab-select 3D TRF pulses that compensate for B1 inhomogeneity in all three spatial directions. We were able to design pulses that reduced B1 inhomogeneities on the order of 35% of the peak image magnitude in the human brain over a 24×24×20 cm3 FOV at 3T. The method was implemented on a standard scanner and required no special hardware. We approximated the flip angle and receive sensitivity maps with a smoothed low-resolution anatomical image. The smoothing removed differences in image intensity from anatomical features, leaving only the variation due to B1 inhomogeneity. The results above indicate that this is adequate at 3T with the added advantage that both the flip angle and receive sensitivity variations are present in the image and do not need to be acquired separately. A higher field implementation, however, may require an explicit measurements of the two maps due to their potentially unique spatial distributions (26,27) and larger flip angles. We also found it simpler to use Eq. [9] where the fraction of inhomogeneity present in the image was subtracted to obtain the desired excitation profile as opposed to dividing. This approach was adequate for a proof of concept but required that the amplitude of the pulse be increased to match peak image magnitude of the uncorrected image to maintain SNR. This can be seen in the plot shown in Fig. 7 (a) where the center magnitudes of the phantom images were matched by increasing the amplitude of the 3D TRF pulse. Due to scanner time constraints, this was not done in the human experiments where the images acquired with the 3D TRF pulses were more uniform but had decreased SNR. This SNR loss can be easily remedied by increasing the pulse amplitude as in the phantoms. Further work is being pursued to find spatial maps of the flip angle and receive sensitivity in vivo. There are no known safety concerns using this method. The SAR is not to an issue with these pulses, despite their length, because the majority of the peak B1 occurs only for short intervals at the spiral k-space centers along the length of the pulse. These sharp peaks in B1 can be seen in the top row of Fig. 4. A potential problem is that the scanner hardware may not be able to achieve the peak B1 needed to obtain the desired flip angle in a region with very large inhomogeneity. This will be a concern in a higher field implementation where the degree B1 inhomogeneity is more severe. It may be likely at higher fields a combination of an innovative coil design (12,13) and a tailored RF pulse will prove to be effective or possibly the pulse construction algorithms need to be recast using peak B1 as a constraint.
The major limitation of the 3D TRF method remains that pulse lengths are often impractically long due to sampling requirements. Pulses on the order of 80 ms were needed in our previous work addressing susceptibility artifacts. This problem can be overcome with a multi-shot approach at the expense of increased image acquisition time. In the application of correcting the B1 inhomogeneity in a 10 cm slab at 3T, however, the pulse sampling requirements are not as severe due to the slower spatial variations of the B1 inhomogeneity. We found that a single pulse on the order of 22 ms, which excited slab with 1.25×2.0×2.0 cm3 resolution over 20×24×24 cm3 FOV, was more than sufficient. Implementation in the stacked spiral acquisition required that the pulse be decomposed into two 11 ms long excitations to reduce off-resonance effects. In spite of the two-shot implementation, the acquisition obtained nearly whole brain coverage with a 2 mm3 isotropic resolution in 51 seconds. Increasing the resolution to 1 mm3 would bring the acquisition time to just less than 7 minutes (approximately eight times longer). A factor of two in acquisition speed could be obtained by developing a single-shot implementation of the 3D TRF pulse. It is likely that an excitation with a lower map resolution would have worked adequately, requiring a 3D TRF pulse shorter than 22 ms. However, the resolution we chose was based more on the sampling needs of the uniform slice profile function W0(r). Although the use of smoother functions for W0(r) would reduce pulse length, the edges of the slice profile would be less steep.
The slice profile along the slab-select direction of the 3D TRF pulse used in this work was already not as sharp as the minimum phase SLR slab-select pulse and required 25% over-sampling to remove aliasing. Poor slice profiles are a drawback of this technique. Future work is aimed at addressing pulse lengths including the use of parallel transmitters and transmit SENSE techniques to reduce pulse lengths (28).
CONCLUSIONS
This work presents a novel 3D tailored RF pulse method that uses anatomical maps of the flip angle and coil receive sensitivity to compensate for B1 inhomogeneity in all three spatial directions. We were able to design 10 cm thick 3D TRF slab-select pulses that reduced B1 inhomogeneities as large as 35% of the peak image magnitude over a 24×24×20 cm3 FOV at 3T The method was implemented on a standard scanner and required no special hardware. A 10 cm thick slab with 2 mm3 isotropic resolution could be acquired in under a minute using the pulse with a four-shot stacked spiral sequence.
Acknowledgments
The authors wish to thank Dr. Petra Schmalbrock at the Ohio State University and Dr. Qing Yang at Penn State University for useful discussions. Their expertise in high field MRI was a a large benefit to the manuscript.
Supported by NIMH 1 R01 MH66066-01 and NIDA 1 R21 DA015900-01.
References
- 1.Hoult D, Richards R. The signal to noise ratio of the nuclear magnetic resonance experiment. J Magn Reson. 1976;24:71–85. doi: 10.1016/j.jmr.2011.09.018. [DOI] [PubMed] [Google Scholar]
- 2.Vaughan JT, Garwood M, Collins CM, Liu W, DelaBarre L, Adriany G, Andersen P, Merkle H, Goebel R, Smith MB, et al. 7T vs. 4T: RF power, homogeneity, and signal-to-noise comparison in head images. Magn Reson Med. 2001;46(1):24–30. doi: 10.1002/mrm.1156. [DOI] [PubMed] [Google Scholar]
- 3.Edelstein WA, Glover GH, Hardy CJ, Redington RW. The intrinsic signal-to-noise ratio in NMR imaging. Magn Reson Med. 1986;3(4):604–18. doi: 10.1002/mrm.1910030413. [DOI] [PubMed] [Google Scholar]
- 4.Ogawa S, Lee T, Nayak A, Glynn P. Oxygenation-sensitive contrast in magnetic resonance image of rodent brain at high magnetic fields. Magn Reson Med. 1990;14:68–78. doi: 10.1002/mrm.1910140108. [DOI] [PubMed] [Google Scholar]
- 5.Duong TQ, Yacoub E, Adriany G, Hu X, Ugurbil K, Vaughan JT, Merkle H, Kim SG. High-resolution, spin-echo BOLD, and CBF fMRI at 4 and 7 T. Magn Reson Med. 2002;48(4):589–93. doi: 10.1002/mrm.10252. [DOI] [PubMed] [Google Scholar]
- 6.Yacoub E, Shmuel A, Pfeuffer J, Van De Moortele PF, Adriany G, Andersen P, Vaughan JT, Merkle H, Ugurbil K, Hu X. Imaging brain function in humans at 7 Tesla. Magn Reson Med. 2001;45(4):588–94. doi: 10.1002/mrm.1080. [DOI] [PubMed] [Google Scholar]
- 7.Ugurbil K, Hu X, Chen W, Zhu XH, Kim SG, Georgopoulos A. Functional mapping in the human brain using high magnetic fields. Philos Trans R Soc Lond B Biol Sci. 1999;354(1387):1195–213. doi: 10.1098/rstb.1999.0474. [DOI] [PMC free article] [PubMed] [Google Scholar]
- 8.Bottomley P, Andrews E. RF magnetic field penetration, phase shift and power dissipation in biological tissue: Implications for NMR imaging. Phys Med Biol. 1978;23:630–643. doi: 10.1088/0031-9155/23/4/006. [DOI] [PubMed] [Google Scholar]
- 9.Glover GH, Hayes CE, Pelc NJ, Edelstein WA, Mueller OM, Hart HR, Hardy CJ, O’Donnell M, Barber WD. Comparison of linear and circular polarization for magnetic resonance imaging. J Magn Reson. 1985;64:255–270. [Google Scholar]
- 10.Ibrahim TS, Lee R, Abduljalil AM, Baertlein BA, Robitaille PM. Dielectric resonances and B(1) field inhomogeneity in UHFMRI: computational analysis and experimental findings. Magn Reson Imaging. 2001;19(2):219–26. doi: 10.1016/s0730-725x(01)00300-9. [DOI] [PubMed] [Google Scholar]
- 11.Yang QX, Wang J, Zhang X, Collins CM, Smith MB, Liu H, Zhu XH, Vaughan JT, Ugurbil K, Chen W. Analysis of wave behavior in lossy dielectric samples at high field. Magn Reson Med. 2002;47(5):982–9. doi: 10.1002/mrm.10137. [DOI] [PubMed] [Google Scholar]
- 12.Alsop D, Connick T, Mizsei G. A spiral volume coil for improved RF field homogeneity at high static magnetic field strength. Magn Reson Med. 1998;40:49–54. doi: 10.1002/mrm.1910400107. [DOI] [PubMed] [Google Scholar]
- 13.Vaughan J, Adriany G, Garwood M, Yacoub E, Duong T, DelaBarre L, Anderson P, Ugurbil K. Detunable transverse electromagnetic (TEM) volume coil for high-field NMR. Magn Reson Med. 2002;47:990–1000. doi: 10.1002/mrm.10141. [DOI] [PubMed] [Google Scholar]
- 14.Ibrahim TS, Lee R, Baertlein BA, Abduljalil AM, Zhu H, Robitaille PM. Effect of RF coil excitation on field inhomogeneity at ultra high fields: a field optimized TEM resonator. Magn Reson Imaging. 2001;19(10):1339–47. doi: 10.1016/s0730-725x(01)00404-0. [DOI] [PubMed] [Google Scholar]
- 15.Staewen R, Johnson A, Ross B, Parrish T, Merkle H, Garwood M. 3-D FLASH imaging using a single surface coil and a new adiabatic pulse, BIR-4. Invest Radiol. 1990;25:559–567. doi: 10.1097/00004424-199005000-00015. [DOI] [PubMed] [Google Scholar]
- 16.Deichmann R, Good CD, Josephs O, Ashburner J, Turner R. Optimization of 3-D MP-RAGE sequences for structural brain imaging. NeuroImage. 2000;12(1):112–27. doi: 10.1006/nimg.2000.0601. [DOI] [PubMed] [Google Scholar]
- 17.Deichmann R, Good C, Turner R. RF inhomogeneity compensaiton in structural brain imaging. Magn Reson Med. 2002;47:398–402. doi: 10.1002/mrm.10050. [DOI] [PubMed] [Google Scholar]
- 18.Claire S, Alecci M, Jezzard P. Compensating for B1 inhomogeneity using active transmit power modulation. Magn Reson Imaging. 2001;19:1349–1352. doi: 10.1016/s0730-725x(01)00467-2. [DOI] [PubMed] [Google Scholar]
- 19.Pauly JM, Hu BS, Wang SJ, Nishimura DG, Macovski A. A Three Dimensional Spin-Echo or Inversion Pulse. Magnetic Resonance in Medicine. 1993;29:2–6. doi: 10.1002/mrm.1910290103. [DOI] [PubMed] [Google Scholar]
- 20.Stenger VA, Boada FE, Noll DC. Three-dimensional tailored RF pulses for the reduction of susceptibility artifacts in T2*-weighted functional MRI. Magn Reson Med. 2000;44:525–531. doi: 10.1002/1522-2594(200010)44:4<525::aid-mrm5>3.0.co;2-l. [DOI] [PMC free article] [PubMed] [Google Scholar]
- 21.Stenger VA, Boada FE, Noll DC. Multishot 3D slice-select tailored RF pulses for MRI. Magn Reson Med. 2002;48:157–165. doi: 10.1002/mrm.10194. [DOI] [PMC free article] [PubMed] [Google Scholar]
- 22.Stenger VA, Boada FE, Noll DC. Variable density spiral 3D tailored RF pulses. Magn Reson Med. 2003;50:1100–1106. doi: 10.1002/mrm.10623. [DOI] [PMC free article] [PubMed] [Google Scholar]
- 23.Pauly JM, Nishimura D, Macovski A. A k-space analysis of small-tip-angle excitation. J Magn Reson. 1989;81:43–56. doi: 10.1016/j.jmr.2011.09.023. [DOI] [PubMed] [Google Scholar]
- 24.Pauly J, Nishimura D, Macovski A. A Linear Class of Large Tip-Angle Selective Excitation Pulses. Journal of Magnetic Resonance. 1989;82:571–587. [Google Scholar]
- 25.Irarrazabal P, Nishimura D. Fast Three Dimensional Magnetic Resonance Imaging. Magn Reson Med. 1995;33(5):656–662. doi: 10.1002/mrm.1910330510. [DOI] [PubMed] [Google Scholar]
- 26.Collins CM, Yang QX, Wang JH, Zhang X, Liu H, Michaeli S, Zhu XH, Adriany G, Vaughan JT, Anderson P, et al. Different excitation and reception distributions with a single-loop transmit-receive surface coil near a head-sized spherical phantom at 300 MHz. Magn Reson Med. 2002;47:1026–1028. doi: 10.1002/mrm.10153. [DOI] [PubMed] [Google Scholar]
- 27.Wang J, Yang QX, Zhang X, Collins CM, Smith MB, Zhu XH, Adriany G, Ugurbil K, Chen W. Polarization of the RF field in a human head at high field: a study with a quadrature surface coil at 7.0 T. Magn Reson Med. 2002;48:362–369. doi: 10.1002/mrm.10197. [DOI] [PubMed] [Google Scholar]
- 28.Katscher U, Bornert P, Leussler C, van den Brink J. Transmit SENSE. Magn Reson Med. 2003;49(1):144–150. doi: 10.1002/mrm.10353. [DOI] [PubMed] [Google Scholar]


