

Abstract
Nascent embryonic joints, interzones, contain a distinct cohort of progenitor cells responsible for the formation of the majority of articular tissues. However, to date the interzone has largely been studied using in situ analysis for candidate genes in the context of the embryo rather than using an unbiased genome-wide expression analysis on isolated interzone cells, leaving significant controversy regarding the exact role of the intermediate and outer interzone layers in joint formation. Therefore, in this study, using laser capture microdissection (three biological replicates), we selectively harvested the intermediate and outer interzones of mouse embryos at gestational age 15.5 days, just prior to cavitation, when the differences between the layers should be most profound. Microarray analysis (Agilent Whole Mouse Genome Oligo Microarrays) was performed and the differential gene expression between the intermediate interzone cells and outer interzone cells was examined by performing a two-sided paired Student's t-test and pathway analysis. One hundred ninety-seven genes were differentially expressed (≥2-fold) between the intermediate interzone and the outer interzone with a P-value≤0.01. Of these, 91 genes showed higher expression levels in the intermediate interzone and 106 were expressed higher in the outer interzone. Pathway analysis of differentially expressed genes suggests an important role for inflammatory processes in the interzone layers, especially in the intermediate interzone, and hence in joint and articular cartilage development. The high representation of genes relevant to chondrocyte hypertrophy and endochondral ossification in the outer interzone suggests that it undergoes endochondral ossification.
Introduction
Articular chondrocytes have a separate embryonic origin from the transient chondrocytes, which prefigure the bony skeleton [1,2]. The descent of different progenitor cell populations and the resulting differences between these two chondrocyte populations might explain why redifferentiation of in-vitro-expanded, dedifferentiated articular chondrocytes can yield hyaline cartilage, while chondrogenically differentiated mesenchymal stem cells undergo premature hypertrophy and mineralize [1–14]. Synovial joints allow vertebrates to display a great range of motion between adjacent bones and are essential for skeletal function. However, since adult articular cartilage does not regenerate, traumatic injuries and degenerative diseases frequently lead to irreversible damage and osteoarthritis. Osteoarthritis is the most common degenerative arthritic condition and a leading cause of disability worldwide, affecting 27 million persons in the United States alone [15]. To date, the persistent limitation of cartilage repair and tissue engineering is the difficulty to induce and perpetuate a stable, permanent articular chondrocyte phenotype that produces and maintains hyaline articular cartilage [16]. Since regeneration as well as tissue engineering ideally recapitulate developmental processes [17,18], studying the morphogenesis of synovial joints might greatly contribute to a biomimetic approach to cartilage tissue engineering.
Joint formation first becomes morphologically evident during embryogenesis, when cells at each prospective joint site (interzone) flatten and form a clear separation of the previously uninterrupted cartilaginous skeletal anlagen [2–5]. The interzone is a tripartite structure consisting of two outer layers adjacent to the epiphyseal end of the future bones and an intermediate zone containing the flattened cells (Fig. 1a) [1–5]. Besides being detectable morphologically, interzone cells can be distinguished from the non-articular transient chondrocytes of the cartilaginous skeletal anlagen through the higher expression of markers such as growth/differentiation factor 5 (Gdf5) and Wnt9a [1–4,19] and lower expression of matrilin-1 (Matn1) [2–5]. The interzone layers can also be discriminated from each other based on their phenotype. The outer layers are chondrogenic and express collagen type-II (Col2a1), while the intermediate layer ceases Col2a1 expression at the onset of interzone formation and reverts to a mesenchymal phenotype [3].
FIG. 1.
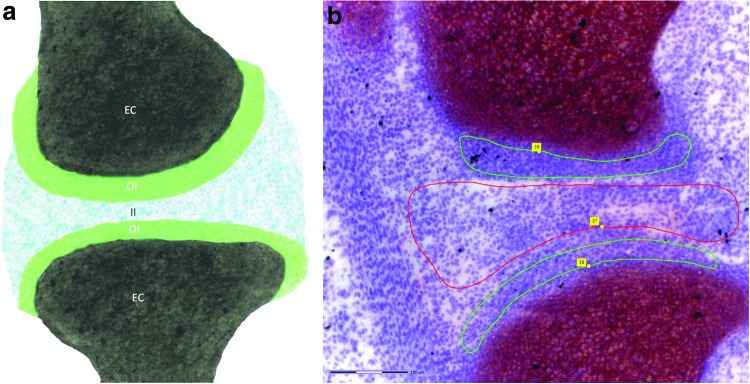
Panel (a) shows a graphical representation of the murine interzone at 15.5 days of gestation. The two chondrogenous outer interzone (OI) layers are arranged around the ends of the long bone anlagen, which at this age consist of transient chondrocytes (EC). The mesenchymal intermediate interzone (II) consists of more loosely arranged cells and is situated between the two outer interzone layers. (b) Micrograph (200× magnification, see scale bar in bottom left) of an E15.5 murine knee with the interzone layers marked for laser capture microdissection (outer interzone, green; intermediate interzone, red). The femur is situated at the top, the tibia is at the bottom, and the patella is visible in the top left corner of the image. Color images available online at www.liebertpub.com/scd
Since it has been shown that microsurgical removal of the interzone from the nascent elbow joint results in joint ablation and fusion of the humerus with radius and ulna, the pivotal role the interzone plays in joint formation has been widely recognized [2–5,20]. In addition, several lineage-tracing experiments have demonstrated that interzone cells constitute a distinct cohort of progenitor cells responsible for the formation of the majority of joint tissues and structures, including articular cartilage, ligaments, and synovial lining [2–5].
However, to date the interzone has largely been studied using in situ analysis for candidate genes in the context of the embryo rather than using an unbiased genome-wide expression analysis on isolated interzone cells. Therefore, while it is well corroborated that articular chondrocytes descend from the Gdf5-expressing interzone cells, significant controversy exists regarding the exact role of the different cells and layers of the interzone in joint development and which specific articular structures they give rise to. Ultrastructural analysis in developing rat embryos indicated that the chondrogenic outer interzone layers differentiate into transient chondrocytes and participate in initial lengthening of long bone anlagen by appositional growth, whereas the mesenchymal intermediate layer would form the majority of the articular components, including articular cartilage [2–4,21]. Others however have suggested that articular chondrocytes derive from the outer interzone based on their shared expression of Col2a1 and the presence of collagen V around both mature articular chondrocytes and cells in the outer interzone, whereas cells in the intermediate interzone differentiate into synovial fibroblasts, meniscal chondrocytes, and tenocytes of intraarticular ligaments [3,4,22].
The murine femorotibial interzone exists for ∼2 days only, from gestational age 13.5 when it is first morphologically detectable until gestational age 15.5, when cavitation commences, replacing the interzone with the diarthrodial joint. In this study we used laser capture microdissection (LCM) to obtain homogenous samples from the intermediate and the outer femorotibial interzone layers at gestational age 15.5, just prior to cavitation, when the differences between the layers should be most profound to establish their differential gene expression profile (Fig. 1a). We chose the femorotibial interzone since the timeline of its development and marker gene expression have been well documented and because the knee is the joint most commonly affected by osteoarthritis hence offering the greatest possible clinical relevance [3,4,23].
Our study identifies and catalogues the genes differentially expressed between the intermediate and outer interzone layers to gain insight into the mechanisms contributing to diarthrodial joint development and to advance our knowledge of articular chondrogenesis. A better understanding of embryonic articular chondrogenesis might ultimately allow recapitulation of these events for cartilage tissue engineering.
Materials and Methods
Tissue preparation
Timed pregnant outbred CD-1 IGS mice (n=3) were purchased from Charles River Laboratories (Sulzbach, Germany, and Margate, United Kingdom). Embryos were recovered on gestational day 15.5 (E15.5), where noon of the day the vaginal plug was detected was designated as embryonic day 0.5. To minimize experimental bias due to differences in breeding and developmental timing, limbs were staged according to Wanek et al. and only limbs of stage 11–12 were used for this experiment [24]. Limbs were dissected in ice-cold phosphate-buffered saline, snap frozen in liquid nitrogen, and stored at −80°C.
This study was approved by the institutional animal research ethics committee of University College Dublin (AREC-P-10-47).
Laser capture microdissection
Hind limbs were embedded in frozen section medium (Neg-50; ThermoFisher, Walldorf, Germany) and sectioned along their sagittal axis using a cryostat (Hyrax C 50 Cryostat; Carl Zeiss Microscopy GmbH, Jena, Germany) at a −25°C chamber/chuck temperature. Sections (10 μm) were mounted onto precooled RNAse-free polyethylene naphthalate (PEN)–coated slides (Zeiss MembraneSlide 1.0 PEN NF; Carl Zeiss MicroImaging GmbH) and stained with cresyl violet. On stained sections, the border between the light-stained femorotibial interzone and dark-stained cartilage and bone condensations was readily distinguishable at 50× magnification (Fig. 1b). The layers of the interzone and transient embryonic cartilage were identified at 100× to 200× magnification. The outer interzone has a higher cell density and shows a concentric arrangement around the distal femur and proximal tibia (Fig. 1b). The cells of the intermediate interzone are more loosely arranged and not clearly oriented toward either bone (Fig. 1b).
The femorotibial intermediate interzone (II), femorotibial outer interzone (OI), femoral and tibial transient embryonic cartilage (EC), and adult articular cartilage (AC) were harvested by LCM using the PALM MicroBeam system (Carl Zeiss Microscopy GmbH) equipped with an inverted microscope (Axio Observer; Carl Zeiss Microscopy GmbH), a CCD color camera (Axio Cam ICc1; Carl Zeiss Microscopy GmbH) and a motorized, computer-controlled microscope stage and collection mechanism (CapMover; Carl Zeiss Microscopy GmbH). Each region of interest (II, OI, and EC) was individually traced freehand on the touchpad screen (PL-2200; Wacom, Krefeld, Germany) in PALM Robosoftware (Carl Zeiss Microscopy GmbH), using different color tracing for each tissue type (Fig. 1b). Then, using the RoboLPC laser function, the ultraviolet laser beam cut along the predetermined path, dissected the regions of interest by color code and catapulted the selected tissues (505,786–2,484,543 μm2/individual sample) of each sample group directly into separate 500-μL AdhesiveCap tubes (Carl Zeiss Microscopy GmbH). Three independent biological replicates were collected for each cell type (II and OI). Each replicate originated from one of the three individual embryos from different litters. The six samples included in this study can be itemized as follows: II embryo 1, II embryo 2, II embryo 3, OI embryo 1, OI embryo 2, and OI embryo 3. The experimental design is to analyze the within-animal variation (between II and OI) in triplicate where each of the six samples represents a statistical unit. The sample groups EC (two biological replicates) and AC (three biological replicates) served as known biological standard for comparison.
Total RNA (1.64–11.03 ng/individual sample) was extracted from cell lysates using RNeasy Micro Kits (Qiagen Sciences, Inc., Germantown, MD) according to manufacturer's protocols. RNA integrity, purity, and quantity was determined and expressed as RNA integrity number with an Agilent Bioanalyzer 2100 (RNA 6000 Pico LabChip® Kit; Agilent Technologies, Waldbronn, Germany). RNA was stored at −80°C.
Microarray analysis
Each RNA sample was amplified and labeled using the Agilent Low Input Quick Amp Labelling kit (Agilent Technologies) following the manufacturer's protocol, to produce Cyanine 3-CTP (Cy-3)–labeled cRNA. Yields of cRNA and dye incorporation rate were measured with a NanoDrop ND-1000 UV-Vis Spectrophotometer (NanoDrop Technologies, Wilmington, DE).
Labeled cRNA was hybridized to Agilent Whole Mouse Genome Oligo Microarrays (Agilent SurePrint G3 Mouse 8x60L Microarray; Agilent Technologies). Hybridizations were performed by Miltenyi Biotec (Bergisch Gladbach, Germany) according to the Agilent 60-mer microarray processing protocol. In brief, Cy-3-labeled fragmented cRNA in hybridization buffer was hybridized overnight (17 h, 65°C) using the Agilent Gene Expression Hybridization Kit and Agilent's recommended hybridization chamber and oven. Following hybridization, the arrays were washed using the Gene Expression Wash Buffer 1 at room temperature and Buffer 2 at 37°C (Agilent No. 5188–5325 and No. 5188–5326) for 1 min each. The last washing step was performed with acetonitrile.
Fluorescence signals of the hybridized microarrays were detected using Agilent's Microarray Scanner System. The Agilent Feature Extraction Software (FES) was used to read out and process the microarray image files. FES-derived output data files were further analyzed using Partek Genomics Suite software (version 6.11.0321; Partek, Inc., Chesterfield, MO). The raw data were quantile normalized and log2 transformed (GEO accession No. GSE51098). The difference between the means of the three OI and the three II samples for all the probes on the microarrays was plotted in a histogram and a Q–Q plot and observed to be normally distributed (data not shown). Homogeneity of the variances of the OI and II groups (quantile normalized and log2 transformed) was analyzed with an F-test (α=0.05). This test confirmed that the variances of the samples in the two groups were homogeneous (data not shown). The six samples being analyzed for this study are derived from two tissues (II and OI) from three mice. Since a normal distribution of the difference between the two paired groups and homogeneous variance for all the samples was observed, the two-sided paired t-test was selected to detect the differentially expressed genes between the intermediate interzone and outer interzone cells.
Functional analysis of the differentially regulated genes was performed using Ingenuity Pathway Analysis (IPA) Winter release 2012 (Ingenuity® Systems, www.ingenuity.com).
The differentially regulated Agilent identifiers along with the log2-transformed fold change (FC) and P-values were uploaded and mapped in IPA. The IPA Functional Analysis identified the biological functions that were most significant to the dataset. Only identifiers that met the FC cutoff of ≥2 with a P-value of≤0.01 were selected. Multiple identifiers mapping to the same molecule were resolved using the median FC value. Only molecules that were associated with biological functions and/or diseases in the Ingenuity Knowledge Base were considered for the functional analysis. The right-tailed Fisher's exact test was used to calculate a P-value determining the probability that each biological function assigned to that dataset is due to chance alone. Both top 25 gene lists differentially upregulated in the intermediate zone and differentially upregulated in the outer interzone were generated in the same IPA analysis. Molecule networks are generated as part of the Ingenuity Core analysis. IPA computes a P score to rank networks according to the differentially expressed proteins. The score is calculated as P score=−log 10 (P value), which indicates the probability of matching the input proteins in a protein–protein interaction from the Ingenuity Knowledge Base by random chance. A score of 3 or higher indicates at least a 99.9% confidence level for excluding random chance.
For unsupervised cluster analysis, the data were back-transformed to normal intensity values. Next, for each probe set, the geometric mean of the intensities of all six samples was calculated. The relative expression for each probe for each sample was compared to this geometric mean and log2 transformed to ascribe equal weight to gene-expression levels with similar relative distances to the geometric mean. Unsupervised cluster analysis was performed in Omniviz (version 6.0.1; BioWisdom, Inc., Cambridge, United Kingdom) using Pearson's correlation in the Correlation View. Principal component analysis was performed in Partek on the quantile-normalized and log2-transformed data.
Quantitative real-time polymerase chain reaction
RNA (500 pg) was amplified to be able to perform quantitative real-time polymerase chain reaction (qRT-PCR) analysis on samples harvested from individual embryos (1.6–23.5 ng/sample). Complementary DNA was synthesized according to manufacturer's instructions using the Ovation® PicoSL WTA System V2 (NuGEN Technologies, Inc., Leek, The Netherlands), purified with the QIAquick® PCR Purification Kit (Qiagen Sciences, Inc., Hilden, Germany) according to manufacturer's guidelines, and quantified by NanoDrop® ND-1000 UV-Vis Spectrophotometer (Isogen Life Science B.V., De Meern, The Netherlands). qRT-PCRs for Col2a1 (NM_001113515.2; NM_031163.3), Gdf5 (NM_008109.2), Matn1 (NM_010769.2), cytokine-like protein 1 (Cytl1; NM_001081106.1), Rho GDP dissociation inhibitor beta (Arhgdib; NM_007486.4), leukocyte immunoglobulin-like receptor subfamily B (with transmembrane domain and cytoplasmic immunoreceptor tyrosine-based inhibitory motifs) member 3 (Lilrb3; NM_011095.2), and hedgehog interacting protein (Hhip; NM_020259.4; all Applied Biosystems Capelle a/d Ijssel, The Netherlands) were performed using TaqMan® Universal PCR MasterMix (Applied Biosystems) on a CFX96™ Real-Time System (Bio-Rad Laboratories, Inc., Veenendaal, The Netherlands). These genes were chosen to verify the layer selection (Gdf5, Col2a1, and Matn1) and the expression levels of genes with high (Cytl1 and Lilrb3) and low (Arhgdib and Hhip) expression levels in one of the two interyone layers. Ct values for each gene were normalized to the housekeeping gene glyceraldehyde-3-phosphate dehydrogenase [GAPDH (Mm99999915_g1) Primer-Probe set; Applied Biosystems, Foster City, CA] using the formula ΔCt=Ct (target)−Ct (GAPDH), and relative expression was calculated using the formula 2−ΔCt. As a reference tissue for the layer selection, we included transient embryonic cartilage of the same embryos in the qRT-PCR analysis. The transient embryonic cartilage was harvested using laser microdissection from the distal femur and proximal tibia of the same mice as the interzone samples and was processed identically. Hence it provided a tissue reference without introducing technical variability.
Results
Verification of interzone layer selection
To verify the selection of the interzone layers using LCM, we examined the expression levels of known markers with qRT-PCR. The expression patterns matched those previously reported [2–4,19]. Gdf5 expression was present in interzone cells, with higher expression levels observed in the intermediate compared with the outer layer, but absent in the transient embryonic cartilage (Fig. 2). In contrast, Matn1 expression was present in the transient embryonic cartilage but completely absent in interzone cells (Fig. 2). Cells from the outer layer of the interzone expressed Col2a1 while no expression was observed in the intermediate layer. Col2a1 expression was highest in the transient embryonic cartilage (Fig. 2). Together, these data validate our layer selection process.
FIG. 2.

Confirmation of layer selection. Chart comparing the gene expression (quantitative real-time polymerase chain reaction) of collagen type-II (Col2a1), growth/differentiation factor 5 (Gdf5), and matrilin-1 (Matn1) between the outer (OI) and intermediate (II) interzones and the transient embryonic cartilage (EC) of all three biological replicates (embryo 1: Wanek stage 12; embryos 2 and 3: Wanek stage 11). Each bar represents the signal intensity (y-axis) of one biological replicate (embryo) of each tissue group (x-axis). The three tissues of each embryo are always grouped with the intermediate interzone (II, solid gray bar) on the left, the outer interzone (OI, striped bar) in the middle, and transient embryonic cartilage (EC, solid black bar) on the right. The signal intensities are expressed relative to the housekeeping gene glyceraldehyde-3-phosphate dehydrogenase (GAPDH). To allow visualization of the respective gene expression proportions between the tissue groups and biological replicates, each of the three genes is shown in a separate chart.
Cluster and principal component analysis on the microarray data confirmed that the three biological replicates (ie, three different embryos) of the two sample groups (intermediate and outer interzones) were more similar to the samples of the same group than to samples of the other group (Supplementary Figs. S1 and S2; Supplementary Data are available online at www.liebertpub.com/scd) and further support proper interzone layer selection and cell harvesting.
As expected, principal component analysis (Fig. 3) comparing the two interzone layers to transient embryonic cartilage and adult articular cartilage grouped the chondrogenous tissues, placing transient embryonic cartilage closest to articular cartilage closer together in the first component (explaining 27.8% of the variance between the samples, Fig. 3B). Interestingly, the second principal component (explaining 17.6% of the variance between the samples, Fig. 3C) grouped the mesenchymal intermediate interzone slightly closer to adult articular cartilage than the chondrogenous outer interzone and positioned the embryonic epiphyseal cartilage at the greatest distance from articular cartilage.
FIG. 3.

Principal component analysis of the intermediate interzone (II, green), outer interzone (OI, red), transient embryonic cartilage (EC, purple), and adult articular cartilage (AC, blue) samples used in this study. The numbers 1–3 indicate the adult mouse (AC), respectively, the embryo (II, OI, and EC), the tissue was harvested from (ie, II1, OI1, and EC1 were harvested from the same individual, embryo 1: Wanek stage 12, embryos 2 and 3: Wanek stage 11). (A) The two principal components explain 45.4% of the variance between the samples. This plot again shows for the II and OI samples that the three biological replicates of each sample group are more similar to each other than to the other group. In addition this plot shows that the AC samples are more similar to II than to OI and that the EC samples are less dissimilar to OI than to II. (B) Plot of only principal component 1. This principal component explains 27.8% of the variance between the samples. (C) Plot of only principal component 2. This principal component explains 17.6% of the variance between the samples. Color images available online at www.liebertpub.com/scd
Differential gene expression analysis
Differential gene expression analysis yielded 197 genes (out of 55,821 entities included in the microarray) that reached an FC of ≥2 with a P-value≤0.01 in the intermediate versus the outer interzone cells. Of these, 106 genes had a higher expression level in the outer than in the intermediate interzone (indicated as positive FC throughout this study) and 91 had a higher expression level in the intermediate than in the outer interzone (indicated as negative FC throughout this study).
Genes higher expressed in the outer interzone with their associated functions, pathways, and networks
The top 25 genes higher expressed in the outer than in the intermediate interzone (ranked by FC) are listed in Table 1, and their associated pathways, gene ontology (GO) annotation functions, and processes are in Supplementary Table S1. The majority of these genes are associated with endochondral ossification, cartilage and growth plate matrix composition (Fig. 4). They also partake in Wnt/β-catenin signaling, bone morphogenetic protein (BMP) signaling, and sonic hedgehog signaling, which are essential regulatory pathways for chondro- and osteogenesis.
Table 1.
List of the Top 25 Genes, Which Are Higher Expressed in the Outer Compared with the Intermediate Interzone with Their P-Value and FC
| Gene symbol | FC OI/II | P-value (median) | Quantile normalized mean signal (OI) | Quantile normalized mean signal (II) |
|---|---|---|---|---|
| 3110079O15Rik | 42.28 | 4.95E-03 | 258.78 | 6.12 |
| Matn1 | 41.52 | 6.98E-05 | 218.45 | 5.26 |
| Mfi2 | 37.96 | 3.01E-03 | 475.78 | 12.53 |
| Pdcd1 | 31.56 | 4.06E-03 | 251.47 | 7.97 |
| Susd5 | 27.73 | 7.41E-03 | 955.70 | 34.46 |
| A330049M08Rik | 26.49 | 7.90E-03 | 717.08 | 27.07 |
| Tctex1d1 | 24.52 | 5.48E-03 | 70.45 | 2.87 |
| Pthlh | 23.16 | 8.80E-03 | 321.45 | 13.88 |
| Matn3 | 21.81 | 6.27E-03 | 119.44 | 5.48 |
| 2610017I09Rik | 20.65 | 3.53E-04 | 69.99 | 3.39 |
| Extl1 | 15.41 | 7.90E-03 | 59.07 | 3.83 |
| Sfrp5 | 14.84 | 7.69E-05 | 164.24 | 11.07 |
| ENSMUST00000148862 | 12.69 | 5.85E-03 | 37.48 | 2.95 |
| Bmp5 | 12.19 | 8.64E-03 | 144.51 | 11.85 |
| Kcns1 | 11.52 | 8.26E-04 | 54.60 | 4.74 |
| Fgfr3 | 10.32 | 6.30E-03 | 707.06 | 68.52 |
| Prelp | 9.77 | 2.85E-04 | 40.77 | 4.17 |
| Wnt4 | 9.60 | 4.26E-03 | 648.87 | 67.62 |
| 5430407P10Rik | 7.79 | 1.75E-03 | 367.15 | 47.16 |
| Abcb9 | 9.35 | 3.68E-03 | 316.63 | 33.87 |
| Col2a1 | 7.92 | 7.86E-03 | 59785.17 | 7547.07 |
| Hhip | 5.85 | 5.05E-03 | 19.05 | 3.26 |
| Hhip | 10.27 | 5.05E-03 | 444.23 | 43.27 |
| Itga10 | 7.71 | 7.60E-03 | 1110.27 | 144.08 |
| Itga10 | 7.72 | 7.60E-03 | 1136.67 | 147.27 |
| Ptch1 | 7.50 | 4.55E-03 | 137.56 | 18.33 |
| Ptch1 | 7.54 | 4.55E-03 | 214.77 | 28.48 |
| Thrsp | 7.24 | 2.27E-03 | 28.60 | 3.95 |
For each gene, the quantile normalized mean signal for both OI and II and the associated FC are also shown for the statistically significant probes. For genes with duplicate probes (ie, Hhip, Itga10, and Ptch1) the FC and P-value are listed separately for each probe. The differentially expressed genes are sorted by FC.
FC, fold change; II, intermediate interzone; OI, outer interzone.
FIG. 4.

Network generated based on the differential gene expression from the comparison of the II tissue to the OI tissue. Genes that are upregulated in OI have negative fold change (FC) values and are colored green (only significant FC). Genes that are upregulated in II have positive FC values and are colored red (only significant FC). This network is enriched for molecules that are upregulated in OI and many of them play a role in endochondral ossification. This network has an IPA network score of 45. Below each gene is listed first the P-value for the significance of the FC and next the FC itself. IPA, Ingenuity Pathway Analysis. Color images available online at www.liebertpub.com/scd
Genes higher expressed in the intermediate interzone with their associated functions, pathways, and networks
The top 25 genes that showed higher expression in the intermediate than in the outer interzone (ranked by FC) are listed in Table 2, and their associated pathways, GO annotation functions, and processes are in Supplementary Table S2.
Table 2.
List of the Top 25 Genes, Which Are Higher Expressed in the Intermediate Compared with the Outer Interzone with Their P-Value and FC
| Gene symbol | FC OI/II | P-value (median) | Quantile normalized mean signal (OI) | Quantile normalized mean signal (II) |
|---|---|---|---|---|
| Evx1 | −20.10 | 1.58E-03 | 3.31 | 66.43 |
| Alox5 | −16.50 | 9.28E-03 | 2.80 | 46.13 |
| Clec7a | −10.91 | 8.49E-03 | 2.70 | 29.43 |
| Ear2 | −8.43 | 4.81E-03 | 2.48 | 20.90 |
| Rspo2 | −8.36 | 5.05E-03 | 73.39 | 613.32 |
| Ifi204 | −8.05 | 9.21E-03 | 3.45 | 27.78 |
| Pdgfb | −7.59 | 1.75E-03 | 3.24 | 24.63 |
| 1810011H11Rik | −7.18 | 6.01E-03 | 3.74 | 26.82 |
| Clec1a | −6.92 | 1.83E-03 | 2.93 | 20.27 |
| Ntm | −6.54 | 9.78E-03 | 5.69 | 37.19 |
| Ankrd1 | −6.24 | 9.46E-03 | 3.58 | 22.35 |
| Naip2 | −6.12 | 8.73E-03 | 5.85 | 35.85 |
| Nrarp | −5.98 | 1.73E-03 | 9.41 | 56.28 |
| Ms4a4b | −5.96 | 8.84E-03 | 3.50 | 20.90 |
| Ifitm6 | −5.80 | 6.15E-03 | 2.78 | 16.11 |
| Hpgds | −5.75 | 8.19E-03 | 2.83 | 16.26 |
| Amtn | −5.74 | 1.50E-03 | 4.15 | 23.79 |
| Nefl | −5.69 | 3.09E-03 | 89.15 | 506.79 |
| Ifi202 | −5.60 | 7.94E-03 | 64.90 | 363.33 |
| Tspan8 | −5.58 | 7.79E-03 | 2.62 | 14.60 |
| Alox12 | −5.49 | 3.79E-04 | 47.56 | 261.24 |
| Ptafr | −5.43 | 9.90E-03 | 3.18 | 17.27 |
| Sfpi1 | −5.28 | 3.57E-03 | 2.63 | 13.88 |
| Arhgap26 | −5.24 | 1.57E-03 | 4.36 | 22.85 |
| Lyn | −5.16 | 1.80E-03 | 3.59 | 18.52 |
For each gene, the quantile normalized mean signal for both OI and II and the associated FC are also shown for the statistically significant probes. The differentially expressed genes are sorted by FC.
Many of these genes are involved in the regulation of inflammation and immune response (Fig. 5). Arachidonate 5-lipoxygenase (Alox5) is the only gene with known joint association, although from the rather unexpected angle as mediator of the inflammatory response in osteoarthritis [25]. Cell adhesion, an important regulatory mechanism of cell shape and chondrocyte phenotype, is the second dominant feature of this gene group [26].
FIG. 5.

Network generated based on the differential gene expression from the comparison of the II tissue to the OI tissue. Genes that are upregulated in II have positive FC values and are colored red (only significant FC). Genes that are upregulated in OI have negative FC values and are colored green (only significant FC). This network is enriched for molecules that are upregulated in II and many of them play a role in inflammation. This network has an IPA network score of 22. Below each gene is listed first the P-value for the significance of the FC and next the FC itself. Color images available online at www.liebertpub.com/scd
Pathways and functions of the differentially expressed genes
All 197 differentially expressed genes were included in the molecular and cellular functions as well as pathway analysis.
Ingenuity biological function analysis revealed 50 major functional and 23 disease categories associated with these genes, including 20 categories related to the musculoskeletal system and 6 categories related to the immune system and inflammation (Table 3 and Supplementary Table S3).
Table 3.
Subset of the Functional Categories of Biological Functions and Diseases Associated with the 197 Genes, Which Are Differentially Expressed (≥2-Fold Difference, P≤0.01) Between the Intermediate and Outer Interzones with Specific Focus on Those Functions and Diseases That Have Known Relevance for the Musculoskeletal System or Inflammation
| Functional/disease top category | P-value range | Molecule count |
|---|---|---|
| Functions | ||
| Musculoskeletal functions | ||
| Cellular development | 7.25E-09–4.44E-03 | 80 |
| Connective tissue development and function | 6.82E-08–4.51E-03 | 42 |
| Embryonic development | 6.82E-08–4.41E-03 | 64 |
| Organ development | 6.82E-08–4.41E-03 | 57 |
| Skeletal and muscular system development and function | 6.82E-08–4.51E-03 | 50 |
| Cellular movement | 1.29E-07–3.54E-03 | 51 |
| Cellular growth and proliferation | 1.47E-06–3.76E-03 | 72 |
| Cell-to-cell signaling and interaction | 2.58E-06–3.54E-03 | 56 |
| Cell signaling | 3.35E-06–4.00E-03 | 36 |
| Hematopoiesis | 3.69E-06–3.99E-03 | 19 |
| Lymphoid tissue structure and development | 8.60E-06–4.51E-03 | 29 |
| Cell death and survival | 1.26E-05–4.44E-03 | 66 |
| Cellular assembly and organization | 3.00E-05–3.52E-03 | 19 |
| Cell morphology | 8.08E-05–3.00E-03 | 37 |
| Vitamin and mineral metabolism | 8.74E-05–4.00E-03 | 15 |
| Inflammatory functions | ||
| Immune cell trafficking | 2.58E-06–3.01E-03 | 35 |
| Humoral immune response | 3.69E-06–3.58E-03 | 12 |
| Diseases | ||
| Musculoskeletal diseases | ||
| Connective tissue disorders | 5.98E-06–4.41E-03 | 30 |
| Skeletal and muscular disorders | 5.98E-06–4.41E-03 | 37 |
| Neurological disease | 3.07E-04–4.09E-03 | 24 |
| Renal and urological disease | 4.74E-04–4.41E-03 | 12 |
| Hematological disease | 1.09E-03–4.25E-03 | 16 |
| Inflammatory diseases | ||
| Inflammatory response | 2.58E-06–3.54E-03 | 41 |
| Inflammatory disease | 5.98E-06–4.41E-03 | 33 |
| Immunological disease | 1.32E-04–4.41E-03 | 22 |
| Hypersensitivity response | 1.49E-03–1.49E-03 | 3 |
The list is sorted by statistical significance and also indicates number of molecules involved in each function/disease category.
The high representation of inflammation-associated pathways, such as the interleukin-9 (IL-9) pathway, the nuclear-factor κB (NF-κB), and the B-cell-receptor signaling pathway, in this gene list lends further emphasis to the role of inflammation in the interzone (Tables 4 and 5 and Supplementary Table S4). Many other pathways associated with the differentially expressed genes play significant roles in endochondral ossification, chondrocyte differentiation, rheumatoid arthritis, bone homeostasis, and osteogenesis, confirming the two major focus areas of the differential gene expression profile, inflammation/immune system and endochondral ossification. This dual focus is nicely demonstrated in the equally dual function of the NF-κB pathway that not only has well-established importance in the maintenance of inflammatory reaction but also plays a role in the regulation of endochondral ossification and terminal chondrocyte differentiation [27–29].
Table 4.
Subset of Pathways Associated with the 197 Genes Differentially Expressed (≥2-Fold Difference, P≤0.01) Between the Intermediate and Outer Interzones with Specific Focus on Those Pathways That Have Known Relevance for the Musculoskeletal System or Inflammation
| Ingenuity canonical pathways | −Log (P-value) | P-value | Ratio | Molecules |
|---|---|---|---|---|
| Musculoskeletal pathways | ||||
| Human embryonic stem cell pluripotency | 3.89 | 1.29E-04 | 0.051 | FGFR3, BMPR1B, BMP2, WNT4, PIK3CD, BMP5, PDGFB, WNT5B |
| Role of NANOG in mammalian embryonic stem cell pluripotency | 2.83 | 1.48E-03 | 0.053 | BMPR1B, BMP2, WNT4, PIK3CD, BMP5, WNT5B |
| Wnt/β-catenin signaling | 2.52 | 3.02E-03 | 0.040 | SOX9, FRZB, SFRP5, WNT4, CCND1, RARG, WNT5B |
| Sonic hedgehog signaling | 2.49 | 3.24E-03 | 0.091 | PTCH1, HHIP, GLIS1 |
| Role of osteoblasts, osteoclasts, and chondrocytes in rheumatoid arthritis | 2.47 | 3.39E-03 | 0.034 | BMPR1B, FRZB, BMP2, SFRP5, WNT4, PIK3CD, BMP5, WNT5B |
| BMP signaling pathway | 1.34 | 4.57E-02 | 0.038 | BMPR1B, BMP2, BMP5 |
| Inflammatory pathways | ||||
| FcγRIIB signaling in B lymphocytes | 2.91 | 1.23E-03 | 0.068 | BLNK, BTK, LYN, PIK3CD |
| IL-9 signaling | 2.20 | 6.31E-03 | 0.075 | IL9R, BCL3, PIK3CD |
| Atherosclerosis signaling | 2.05 | 8.91E-03 | 0.037 | PLB1, COL2A1, ALOX12, ALOX5, PDGFB |
| Role of JAK1 and JAK3 in γc cytokine signaling | 1.50 | 3.16E-02 | 0.045 | BLNK, IL9R, PIK3CD |
| B cell receptor signaling | 1.48 | 3.31E-02 | 0.029 | BLNK, BTK, EBF1, LYN, PIK3CD |
| NF-κB signaling | 1.48 | 3.31E-02 | 0.029 | FGFR3, BMPR1B, BMP2, FLT4, PIK3CD |
| GM-CSF signaling | 1.46 | 3.47E-02 | 0.044 | LYN, PIK3CD, CCND1 |
| Role of macrophages, fibroblasts, and endothelial cells in rheumatoid arthritis | 1.36 | 4.37E-02 | 0.021 | FRZB, SFRP5, WNT4, PIK3CD, CCND1, PDGFB, WNT5B |
The list is sorted by statistical significance. The column “Molecules” lists the differentially expressed genes of our experimental dataset, which are categorized into the respective pathways. The column “Ratio” indicates the number of experimental genes partaking in the pathway divided by the total number of genes known to participate in the pathway.
BMP, bone morphogenetic protein; GM-CSF, granulocyte-macrophage colony-stimulating factor; IL-9, interleukin-9; NF-κB, nuclear-factor κB.
Table 5.
List of the Top Five Functions in the Three Categories “Diseases and Disorders,” “Molecular and Cellular Functions,” and “Physiological System Development and Function” and the Top Five Pathways Associated with the 197 Genes Differentially Expressed (≥2-Fold Difference, P≤0.01) Between the Intermediate and Outer Interzones (the 91 Genes Differentially Upregulated in the Intermediate Interzone and the 106 Genes Differentially Upregulated in the Outer Interzone)
| Category | Function name | Molecules | |
|---|---|---|---|
| 15.5 OI vs. II | Physiological system development and function | Cardiovascular system development and function | 44 |
| Connective tissue development and function | 42 | ||
| Embryonic development | 64 | ||
| Organ development | 57 | ||
| Organismal development | 75 | ||
| Molecular and cellular functions | Cellular development | 80 | |
| Cellular movement | 51 | ||
| Cellular growth and proliferation | 72 | ||
| Cell-to-cell signaling and interaction | 56 | ||
| Cell signaling | 36 | ||
| Diseases and disorders | Cancer | 88 | |
| Cardiovascular disease | 35 | ||
| Inflammatory response | 41 | ||
| Gastrointestinal disease | 40 | ||
| Connective tissue disorders | 30 | ||
| Pathways | Basal cell carcinoma signaling | 7/73 | |
| Human embryonic stem cell pluripotency | 8/157 | ||
| Cardiomyocyte differentiation via BMP receptors | 3/20 | ||
| Axonal guidance signaling | 13/468 | ||
| Fc-gammaRIIB signaling in B lymphocytes | 4/59 | ||
| Up in OI | Physiological system development and function | Skeletal and muscular system development and function | 25 |
| Tissue development | 40 | ||
| Connective tissue development and function | 26 | ||
| Organismal development | 40 | ||
| Embryonic development | 36 | ||
| Molecular and cellular functions | Cellular development | 41 | |
| Cellular growth and proliferation | 36 | ||
| Cellular assembly and organization | 20 | ||
| Cellular function and maintenance | 13 | ||
| Cell morphology | 26 | ||
| Diseases and disorders | Connective tissue disorders | 17 | |
| Inflammatory disease | 9 | ||
| Skeletal and muscular disorders | 19 | ||
| Developmental disorder | 23 | ||
| Hereditary disorder | 16 | ||
| Pathways | Basal cell carcinoma signaling | 7/73 | |
| Wnt/β-catenin signaling | 7/174 | ||
| Human embryonic stem cell pluripotency | 6/157 | ||
| Cardiomyocyte differentiation via BMP receptors | 3/20 | ||
| Axonal guidance signaling | 10/468 | ||
| Up in II | Physiological system development and function | Hematological system development and function | 26 |
| Cardiovascular system development and function | 22 | ||
| Hematopoiesis | 14 | ||
| Humoral immune response | 9 | ||
| Immune cell trafficking | 24 | ||
| Molecular and cellular functions | Cellular function and maintenance | 28 | |
| Cellular movement | 28 | ||
| Lipid metabolism | 17 | ||
| Small-molecule biochemistry | 31 | ||
| Cellular development | 31 | ||
| Diseases and disorders | Inflammatory response | 28 | |
| Cardiovascular disease | 20 | ||
| Immunological disease | 19 | ||
| Hypersensitivity response | 4 | ||
| Gastrointestinal disease | 18 | ||
| Pathways | Fc-gammaRIIB signaling in B lymphocytes | 4/59 | |
| eNOS signaling | 5/152 | ||
| Nitric oxide signaling in cardiovascular system | 4/99 | ||
| B cell receptor signaling | 5/170 | ||
| Eicosanoid signaling | 3/80 |
The column “Molecules” indicates the number of differentially expressed genes of our experimental dataset, which are categorized into the respective functions. For the pathways, the ratio of experimental genes partaking in the pathway divided by the total number of genes known to participate in the pathway is specified in the “Molecules” column.
eNOS, endothelial nitric oxide synthase.
The top five “molecular and cellular functions” (Table 5) indicate the importance of cellular development, cellular movement, cell-to-cell signaling, and cellular growth and proliferation in the interzone, all of which have relevance in the context of embryogenesis and morphogenesis.
Genes that are higher expressed in the outer interzone contribute the majority of musculoskeletal associations, while genes that are higher expressed in the intermediate interzone seem responsible for most inflammatory and immunological annotations (Table 5).
qRT-PCR validation of microarray data
To validate our microarray data, we performed qRT-PCR on a selection of differentially up- and downregulated genes. Results indicated that increased or decreased expression levels for all genes tested were well-matched between microarray and qRT-PCR analyses (Table 6). Cytl1, Matn1, Col2a1, and Hhip were higher expressed in outer than in intermediate interzone on both microarray and qRT-PCR data (Table 6). Similarly, Arhgdib, Gdf5, and Lilrb3 were lower expressed in outer interzone on both microarray data and qRT-PCR data. The qRT-PCR data, therefore, supports the validity of the microarray data.
Table 6.
Comparison of the Expression Values Between Microarray and qRT-PCR, Indicating the FC Between the Outer and Intermediate Interzones, as well as the Normalized Signal Intensity of the Microarray and the qRT-PCR
| 15.5 OI vs. 15.5 II | 15.5 II | 15.5 OI | 15.5 EC | |||||
|---|---|---|---|---|---|---|---|---|
| Gene | Microarray | PCR | Microarray | PCR | Microarray | PCR | Microarray | PCR |
| Col2a1 | 7.72 | 18.98 | 7959.63 | 6.27E-02 | 61459.29 | 1.19E+00 | 154205.97 | 1.53E+01 |
| Gdf5 | −1.03 | −10.74 | 4367.74 | 1.60E-03 | 4256.10 | 1.49E-04 | 1408.85 | 6.03E-06 |
| Matn1 | 41.47 | 69.61 | 6.74 | 7.70E-07 | 279.58 | 5.36E-05 | 23579.76 | 7.17E-02 |
| Arhgdib | −1.57 | −22.88 | 693.91 | 1.08E-02 | 442.80 | 4.72E-04 | ||
| Cytl1 | 65.26 | 310.98 | 135.55 | 3.28E-04 | 8845.57 | 1.02E-01 | ||
| Hhip | 9.84 | 3.36 | 23.7 | 3.15E-04 | 233.16 | 1.06E-03 | ||
| Lilrb3 | −28.2 | −2.35 | 118.62 | 5.82E-06 | 4.21 | 2.48E-06 | ||
For all genes, which had more than one probe included in the microarray, an average of the two or three replicate probes was calculated for inclusion in this table. Since the RNA was amplified differently for the two techniques, it is not surprising that the FCs are not identical between the two techniques. However the direction and degree of FCs are similar. For the genes used for verification of the layer selection, Gdf5, Col2a1, and Matn1, the normalized signal intensities measured in transient EC using microarray and qRT-PCR are also listed.
EC, embryonic cartilage; qRT-PCR, quantitative real-time polymerase chain reaction.
Discussion
Articular chondrocytes and many other articular tissues descend from a distinct cohort of progenitor cells located in the nascent embryonic joints, the interzones [2,3]. The contributions of the outer and intermediate interzone layers to the various articular tissues are however equivocal [2–4,21,22]. In this study we therefore selectively isolated cells from the different murine knee interzone layers using LCM and performed whole-genome microarray analysis with the aim to establish the differential gene expression profile of the interzone layers and start to shed some light on their potential differentiation lineage.
The majority of genes specifically differentially upregulated in the outer interzone are related to chondrogenesis, chondrocyte hypertrophy, endochondral ossification, and cartilage matrix. For example, 2 genes involved in the Wnt pathway, Wnt4 and secreted frizzled related protein 5 (Sfrp5), are among the 25 genes with the highest upregulation in the outer compared with the intermediate interzone. Wnt4 is a positive regulator of chondrocyte maturation acting at the transition from prehypertrophic to hypertrophic chondrocytes [30,31]. Similarly, the Wnt antagonist Sfrp5 is typically expressed in proliferating and prehypertrophic chondrocytes during mouse limb development at E15.5 [32]. Three members of the Bmp signaling pathway—Bmp2, Bmp5, and Bmpr1B—were higher in the outer interzone. Bmp2 induces Runx2, a key regulator of chondrocyte differentiation required for chondrocyte maturation and endochondral bone formation [33]. Similarly Bmp5, an important regulator of chondrocyte proliferation and differentiation, has been shown to induce upregulation of hypertrophic markers parathyroid receptor 1 and collagen type X alpha 1 in vitro [34,35].
Parathyroid hormone like hormone (Pthlh) and fibroblast growth factor receptor 3 (Fgfr3) are essential for the regulation of endochondral ossification [36–38]. Matn1 and Matn3 are noncollagenous extracellular matrix proteins bridging macromolecular networks that are specific for transient embryonic cartilage, growth plate, and bone [39,40]. Mutation in Matn3 results in multiple epiphyseal dysplasia characterized by early onset osteoarthritis and irregular ossification of the epiphyses [41]. Exostosis like 1 (Extl1) is involved in the biosynthesis of glycosaminoglycans and highly expressed in proliferating, prehypertrophic, and hypertrophic chondrocytes during endochondral ossification [42].
The high representation of genes associated with osteogenesis in the outer interzone combined with findings by Hunziker et al. that, during postnatal development, mammalian articular cartilage also acts as a surface growth plate to allow radial expansion and remodeling of the epiphyseal bone strongly suggests that the outer interzone undergoes endochondral ossification [43].
Genes specifically differentially upregulated in the intermediate interzone are related to inflammation, actin cytoskeleton organization, G-protein coupled receptor signaling, and housekeeping functions essential for cellular maintenance such as receptor activity. The lineage-specific expression patterns of “housekeeping” genes and genes of metabolic pathways are a well-reported phenomenon and might contribute to cell-type-specific effects of transcription factors and other regulatory proteins [44]. The only gene with known ties to limb development is Evx1, which is also expressed in the undifferentiated mesenchyme at the distal tip of the limb [45]. In lepidotrichia (bony ray), Evx1 is required for joint formation in the fin dermoskeleton, while endoskeletal joints require Gdf5 instead. In the light of the well-established importance of Gdf5 for joint formation, this alternative pathway in lepidotrichia dermoskeletal fin joints invites further studies in mammalian species [46].
Although chondrogenic genes are not represented among the 25 genes that show highest expression levels in the intermediate compared with the outer interzone, Sox9, Sox5, Sox6, Col2a1, Comp, and Aggrecan are expressed in the intermediate interzone at only slightly lower levels than in the outer interzone, suggesting that this layer is still prone to form cartilage.
In this study, we deliberately chose to use an outbred strain of mice (CD-1 mice), which have been shown to have a suitable genetic structure to support high-resolution mapping of both quantitative and qualitative traits and a complex genetic history similar to a human founder population [47]. For similar reasons, to more accurately reflect the naturally occurring genetic and phenotypic variation of human populations, we used embryos from different litters as biological replicates. To account for the variation in developmental stage within and between individual litters of the same gestational age, we used stringent inclusion criteria and limited the developmental variance by including only embryos of Wanek limb developmental stage 11 and 12. Even though these two stages are only hours apart, at Wanek stage 12, the femorotibial joint is closer to cavitation and the expression of the early interzone marker Gdf5 in the intermediate interzone of embryo 1, as measured by qPCR, was lower than expected (Fig. 2). Typically Gdf5 expression is high at the onset of interzone formation and becomes downregulated during cavitation [2,48,49]. Principal component analysis comparing the six samples (three biological replicates of the intermediate and outer interzones, Supplementary Fig. S2) included in this study as well as principal component analysis comparing the three biological replicates of the intermediate and outer interzones with transient embryonic cartilage and articular cartilage (Fig. 3) demonstrated that the three biological replicates (ie, three different embryos) of the two sample groups (intermediate and outer interzones) were more similar to the samples of the same group than to samples of the other tissue groups and confirm correct interzone layer selection and cell harvesting.
The differences in gene expression between the inner and outer layers of the interzone can provide valuable information about the biology of joint formation. However, in situ hybridization and immunohistochemistry will be needed to further confirm the expression of these genes in the interzone layers, to determine whether the interzone cell populations are uniform or whether some genes are expressed solely in specific developing anatomical structures. Since different joints, such as the elbow and knee, have different anatomical structures and have recently been shown to also exhibit slight differences in their gene expression profile [50], subtractive gene expression profiling of the interzone layers of different joints might help establish the common genes necessary for joint and articular cartilage development.
A better understanding of embryonic articular chondrogenesis might ultimately allow recapitulation of these events for cartilage tissue engineering. In this respect the finding that inflammation appeared a dominant feature in the subset of 25 genes with the highest differential upregulation in the intermediate interzone as well as in the pathways and functions of the 197 differentially expressed genes has caught our interest. Inflammation is typically seen as a response to cellular damage and has been shown to play an important role in regeneration [51,52]. In addition, inflammation has been implicated in tumorigenesis, which, similar to regenerative processes, recapitulates aspects of ontogeny [53]. Inflammatory pathways could represent molecular and cellular mechanisms that play a role in normal embryonic development and hence might play an important role in the interzone layers during joint formation. The fact that most current therapies for inflammatory arthritis show unintentional side effects, such as embryo resorption and malformations, further suggests that the targeted inflammatory pathways might also play pivotal roles in embryogenesis and emphasizes the need to study these parallels [54]. The typical association between inflammation and cartilage in osteoarthritis pathogenesis, more specifically chondrocyte hypertrophy and matrix degradation, is another example of how inflammatory pathways might relate to joint formation and tissue remodeling.
While inflammation was long thought to inhibit differentiation and tissue formation, recently several studies have reported evidence to the contrary and showed molecule- and dose-dependent effects of inflammatory mediators on cellular differentiation, indicating that in this context “cellular activation” might be a more appropriate description of these processes than the negatively annotated term “inflammation” [55–59]. TNFα, IL-1β, and NF-κB, for example, stimulate osteogenesis at low concentrations and inhibit at high concentrations [55–60]. In chondrogenesis the role of inflammation is even more controversial. To date the prevailing opinion holds that inflammation inhibits chondrogenesis. However, recent studies have reported that early transient activation of NF-κB/p65 facilitates chondrogenic differentiation via stimulation of Sox9 expression and is required for chondrocyte viability [61–64].
While the role of inflammation in chondrogenesis remains equivocal, the importance of mechanical stimulation in chondrogenesis, for cartilage maintenance and as a contributor to osteoarthritis, is well established. Indeed, mechanical stimulation has been proven essential for joint formation in the embryo, with in-ovo-paralyzed chicks demonstrating loss of characteristic interzone gene expression, abnormal expression of cartilage markers, and joint fusion [65–68]. Similarly the association between mechanical stimulation and inflammation, such as the convergence of signaling pathways triggered by inflammatory and mechanical stimuli, for example, in the NF-κB and IL-6 pathways, is well recognized [60,69,70]. Interestingly, an increase in hyaluronan (HA), followed by HA–CD44 interaction, is not only one of the best-documented mechanisms underlying the mechanical stimulation requirement for synovial joint cavitation, it also induces inflammation in chondrocytes and as such might be one of the explanations for the upregulation of inflammation-associated genes in the intermediate interzone [65,71,72].
A recent article by Longobardi et al. compared the gene expression profile of the pooled interzone of developing murine interdigital joints at 14.5 days of gestation with the adjacent transient embryonic cartilage and found downregulation of inflammatory chemokines and especially of monocyte-chemoattractant protein (Mcp5) in the interzone [73]. While this appears contradictory our findings at first glance, their in vitro studies demonstrated that Mcp5 induces chondrogenesis in interzone cells and decreases the expression of interzone marker genes, such as Gdf5 and Wnt9a, and thereby confirmed the connection between inflammatory chemokines and induction of chondrogenesis. Since the interdigital interzone at gestational day 14.5 is just forming, while the femorotibial interzone at gestational day 15.5 is in the final stages of its existence [24], low Mcp5 in the interzone at 14.5 days provides continued expression of Gdf5 and Wnt9a, while upregulation of inflammatory mediators and pathways in the intermediate femorotibial interzone at 15.5 days, as seen in our study, might induce chondrogenesis. The specific role of inflammatory pathways and genes in the interzone and in different phases of joint tissue formation therefore invite further studies.
Conclusions
In conclusion, pathway analysis of differentially expressed genes suggests an important role for inflammation-related transcripts in the interzone layers and hence in joint development. Genes with high differential upregulation in the intermediate interzone focus on inflammation and actin cytoskeleton organization, while genes with high differential upregulation in the outer interzone show associations with cartilage matrix formation, chondrogenesis, chondrocyte hypertrophy, and endochondral ossification. The high representation of genes relevant to cartilage hypertrophy and bone formation in the outer interzone allows hypothesizing that the outer interzone undergoes endochondral ossification, while the intermediate interzone forms the articular tissues, including cartilage. This hypothesis was strengthened by principal component analysis, comparing the two interzone layers with transient embryonic cartilage and adult articular cartilage. While in the first component, transient embryonic cartilage was positioned closest to articular cartilage as might be expected based on their shared chondrogenous nature, the second component grouped the mesenchymal intermediate interzone closest to articular cartilage. Additional studies will be needed to look into the various pathways and genes found to be differentially expressed between the interzone layers in this study and to confirm this hypothesis.
Supplementary Material
Acknowledgments
This material is based upon works supported by the Science Foundation Ireland under grant no. 11/RFP/BMT/3150 and a grant from the Dutch government to the Netherlands Institute for Regenerative Medicine (NIRM, grant no. FES0908).
Author Disclosure Statement
The authors declare no conflict of interest. All authors approved of the article and its submission to Stem Cells and Development. We did not submit this article (or closely related research) to any other journal and it has not been published or accepted for publication in any other forum. The legal and ethical requirements with regards to the humane treatment of animals described in the study have been met. All animal experiments were approved by the Utrecht University's Animal Experimentation Committee (permission no. 2007.III.02.036).
References
- 1.Pacifici M, Koyama E, Shibukawa Y, WU C, Tamamura Y, Enomoto-Iwamoto M. and Iwamoto M. (2006). Cellular and molecular mechanisms of synovial joint and articular cartilage formation. Ann N Y Acad Sci 1068:74–86 [DOI] [PMC free article] [PubMed] [Google Scholar]
- 2.Koyama E, Shibukawa Y, Nagayama M, Sugito H, Young B, Yuasa T, Okabe T, Ochiai T, Kamiya N, et al. (2008). A distinct cohort of progenitor cells participates in synovial joint and articular cartilage formation during mouse limb skeletogenesis. Dev Biol 316:62–73 [DOI] [PMC free article] [PubMed] [Google Scholar]
- 3.Hyde G, Boot-Handford RP. and Wallis GA. (2008). Col2a1 lineage tracing reveals that the meniscus of the knee joint has a complex cellular origin. J Anat 213:531–538 [DOI] [PMC free article] [PubMed] [Google Scholar]
- 4.Hyde G, Dover S, Aszodi A, Wallis GA. and Boot-Handford RP. (2007). Lineage tracing using matrilin-1 gene expression reveals that articular chondrocytes exist as the joint interzone forms. Dev Biol 304:825–833 [DOI] [PMC free article] [PubMed] [Google Scholar]
- 5.Koyama E, Ochiai T, Rountree RB, Kingsley DM, Enomoto-Iwamoto M, Iwamoto M. and Pacifici M. (2007). Synovial joint formation during mouse limb skeletogenesis: roles of Indian hedgehog signaling. Ann N Y Acad Sci 1116:100–112 [DOI] [PMC free article] [PubMed] [Google Scholar]
- 6.Pelttari K, Winter A, Steck E, Goetzke K, Hennig T, Ochs BG, Aigner T. and Richter W. (2006). Premature induction of hypertrophy during in vitro chondrogenesis of human mesenchymal stem cells correlates with calcification and vascular invasion after ectopic transplantation in SCID mice. Arthritis Rheum 54:3254–3266 [DOI] [PubMed] [Google Scholar]
- 7.Pelttari K, Steck E. and Richter W. (2008). The use of mesenchymal stem cells for chondrogenesis. Injury 39:58–65 [DOI] [PubMed] [Google Scholar]
- 8.Scotti C, Tonnarelli B, Papadimitropoulos A, Scherberich A, Schaeren S, Schauerte A, López-Ríos J, Zeller R, Barbero A. and Martin I. (2010). Recapitulation of endochondral bone formation using human adult mesenchymal stem cells as a paradigm for developmental engineering. Proc Natl Acad Sci U S A 107:7251–7256 [DOI] [PMC free article] [PubMed] [Google Scholar]
- 9.Farrell E, Both SK, Odörfer KI, Koevoet W, Kops N, O'Brien FJ, Baatenburg de Jong RJ, Verhaar JA, Cuijpers V, et al. (2011). In vivo generation of bone via endochondral ossification by in vitro chondrogenic priming of adult human and rat mesenchymal stem cells. BMC Musculoskelet Disord 12:31. [DOI] [PMC free article] [PubMed] [Google Scholar]
- 10.O'Sullivan J, D'Arcy S, Barry FP, Murphy JM. and Coleman CM. (2011). Mesenchymal chondroprogenitor cell origin and therapeutic potential. Stem Cell Res Ther 2:8. [DOI] [PMC free article] [PubMed] [Google Scholar]
- 11.Oldershaw RA. (2012). Cell sources for the regeneration of articular cartilage: the past, the horizon and the future. Int J Exp Pathol 93:389–400 [DOI] [PMC free article] [PubMed] [Google Scholar]
- 12.Dehne T, Schenk R, Perka C, Morawietz L, Pruss A, Sittinger M, Kaps C. and Ringe J. (2010). Gene expression profiling of primary human articular chondrocytes in high-density micromasses reveals patterns of recovery, maintenance, re- and dedifferentiation. Gene 462:8–17 [DOI] [PubMed] [Google Scholar]
- 13.Haudenschild DR, McPherson JM, Tubo R. and Binette F. (2001). Differential expression of multiple genes during articular chondrocyte redifferentiation. Anat Rec 263:91–98 [DOI] [PubMed] [Google Scholar]
- 14.Tallheden T, Karlsson C, Brunner A, Van Der Lee J, Hagg R, Tommasini R. and Lindahl A. (2004). Gene expression during redifferentiation of human articular chondrocytes. Osteoarthritis Cartilage 12:525–535 [DOI] [PubMed] [Google Scholar]
- 15.Cheng Y, Hootman J, Murphy L, Langmaid G. and Helmick C. (2010). Prevalence of doctor-diagnosed arthritis and arthritis-attributable activity limitation. MMWR Morb Mortal Wkly Rep 59:1261–1265 [PubMed] [Google Scholar]
- 16.Gelse K, Ekici AB, Cipa F, Swoboda B, Carl HD, Olk A, Hennig FF. and Klinger P. (2011). Molecular differentiation between osteophytic and articular cartilage–clues for a transient and permanent chondrocyte phenotype. Osteoarthritis Cartilage 20:162–171 [DOI] [PubMed] [Google Scholar]
- 17.Scholz H. (2006). Unraveling the basic principles. Am J Physiol Regul Integr Comp Physiol 290:R1485–R1487 [DOI] [PubMed] [Google Scholar]
- 18.Sundelacruz S. and Kaplan DL. (2009). Stem cell- and scaffold-based tissue engineering approaches to osteochondral regenerative medicine. Semin Cell Dev Biol 20:646–655 [DOI] [PMC free article] [PubMed] [Google Scholar]
- 19.Hartmann C. and Tabin CJ. (2001). Wnt-14 plays a pivotal role in inducing synovial joint formation in the developing appendicular skeleton. Cell 104:341–351 [DOI] [PubMed] [Google Scholar]
- 20.Holder N. (1977). An experimental investigation into the early development of the chick elbow joint. J Embryol Exp Morphol 39:115–127 [PubMed] [Google Scholar]
- 21.Ito MM. and Kida MY. (2000). Morphological and biochemical re-evaluation of the process of cavitation in the rat knee joint: cellular and cell strata alterations in the interzone. J Anatomy 197 (Pt 4):659–679 [DOI] [PMC free article] [PubMed] [Google Scholar]
- 22.Bland Y. and Ashhurst D. (1996). Development and ageing of the articular cartilage of the rabbit knee joint: distribution of the fibrillar collagens. Anat Embryol 194:607–619 [DOI] [PubMed] [Google Scholar]
- 23.Felson DT. and Zhang Y. (1998). An update on the epidemiology of knee and hip osteoarthritis with a view to prevention. Arthritis Rheum 41:1343–1355 [DOI] [PubMed] [Google Scholar]
- 24.Wanek N, Muneoka K, Holler-Dinsmore G, Burton R. and Bryant SV. (1989). A staging system for mouse limb development. J Exp Zool 249:41–49 [DOI] [PubMed] [Google Scholar]
- 25.Martel-Pelletier J, Mineau F, Fahmi H, Laufer S, Reboul P, Boileau C, Lavigne M. and Pelletier J-P. (2004). Regulation of the expression of 5-lipoxygenase-activating protein/5-lipoxygenase and the synthesis of leukotriene B4 in osteoarthritic chondrocytes: Role of transforming growth factor? and eicosanoids. Arthritis Rheum 50:3925–3933 [DOI] [PubMed] [Google Scholar]
- 26.Sanchez M, Arcella A, Pontarelli G. and Gionti E. (1996). The role of cell adhesion in retinoic acid-induced modulation of chondrocyte phenotype. Biochem J 313 (Pt 1):201–206 [DOI] [PMC free article] [PubMed] [Google Scholar]
- 27.Boyce BF, Yao Z. and Xing L. (2010). Functions of nuclear factor kappaB in bone. Ann N Y Acad Sci 1192:367–375 [DOI] [PMC free article] [PubMed] [Google Scholar]
- 28.Marcu KB, Otero M, Olivotto E, Borzí RM. and Goldring MB. (2010). NF-kappaB signaling: multiple angles to target OA. Curr Drug Targets 11:599–613 [DOI] [PMC free article] [PubMed] [Google Scholar]
- 29.Ulivi V, Giannoni P, Gentili C, Cancedda R. and Descalzi F. (2008). p38/NF-kB-dependent expression of COX-2 during differentiation and inflammatory response of chondrocytes. J Cell Biochem 104:1393–1406 [DOI] [PubMed] [Google Scholar]
- 30.Hartmann C. and Tabin CJ. (2000). Dual roles of Wnt signaling during chondrogenesis in the chicken limb. Development 127:3141–3159 [DOI] [PubMed] [Google Scholar]
- 31.Später D, Hill TP, O'Sullivan RJ, Gruber M, Conner DA. and Hartmann C. (2006). Wnt9a signaling is required for joint integrity and regulation of Ihh during chondrogenesis. Development 133:3039–3049 [DOI] [PubMed] [Google Scholar]
- 32.Witte F, Dokas J, Neuendorf F, Mundlos S. and Stricker S. (2009). Comprehensive expression analysis of all Wnt genes and their major secreted antagonists during mouse limb development and cartilage differentiation. Gene Expr Patterns 9:215–223 [DOI] [PubMed] [Google Scholar]
- 33.Shu B, Zhang M, Xie R, Wang M, Jin H, Hou W, Tang D, Harris SE, Mishina Y, et al. (2011). BMP2, but not BMP4, is crucial for chondrocyte proliferation and maturation during endochondral bone development. J Cell Sci 124:3428–3440 [DOI] [PMC free article] [PubMed] [Google Scholar]
- 34.Snelling SJB, Hulley PA. and Loughlin J. (2010). BMP5 activates multiple signaling pathways and promotes chondrogenic differentiation in the ATDC5 growth plate model. Growth Factors 28:268–279 [DOI] [PubMed] [Google Scholar]
- 35.Mailhot G, Yang M, Mason-Savas A, Mackay CA, Leav I. and Odgren PR. (2008). BMP-5 expression increases during chondrocyte differentiation in vivo and in vitro and promotes proliferation and cartilage matrix synthesis in primary chondrocyte cultures. J Cell Physiol 214:56–64 [DOI] [PMC free article] [PubMed] [Google Scholar]
- 36.Amizuka N, Davidson D, Liu H, Valverde-Franco G, Chai S, Maeda T, Ozawa H, Hammond V, Ornitz DM, Goltzman D. and Henderson JE. (2004). Signalling by fibroblast growth factor receptor 3 and parathyroid hormone-related peptide coordinate cartilage and bone development. Bone 34:13–25 [DOI] [PubMed] [Google Scholar]
- 37.Laplantine E, Rossi F, Sahni M, Basilico C. and Cobrinik D. (2002). FGF signaling targets the pRb-related p107 and p130 proteins to induce chondrocyte growth arrest. J Cell Biol 158:741–750 [DOI] [PMC free article] [PubMed] [Google Scholar]
- 38.Cleary MA, van Osch GJVM, Brama PA, Hellingman CA. and Narcisi R. (2013). FGF, TGFβ and Wnt crosstalk: embryonic to in vitro cartilage development from mesenchymal stem cells. J Tissue Eng Regen Med. DOI: 10.1002/term.1744 [DOI] [PubMed] [Google Scholar]
- 39.Klatt AR, Becker A-KA, Neacsu CD, Paulsson M. and Wagener R. (2011). The matrilins: modulators of extracellular matrix assembly. Int J Biochem Cell Biol 43:320–330 [DOI] [PubMed] [Google Scholar]
- 40.Huang X, Birk DE. and Goetinck PF. (1999). Mice lacking matrilin-1 (cartilage matrix protein) have alterations in type II collagen fibrillogenesis and fibril organization. Dev Dyn 216:434–441 [DOI] [PubMed] [Google Scholar]
- 41.Budde B, Blumbach K, Ylostalo J, Zaucke F, Ehlen HWA, Wagener R, Ala-Kokko L, Paulsson M, Bruckner P. and Grässel S. (2005). Altered integration of matrilin-3 into cartilage extracellular matrix in the absence of collagen IX. Mol Cell Biol 25:10465–10478 [DOI] [PMC free article] [PubMed] [Google Scholar]
- 42.Duchez S, Pascal V, Cogné N, Jayat-Vignoles C, Julien R. and Cogné M. (2011). Glycotranscriptome study reveals an enzymatic switch modulating glycosaminoglycan synthesis during B-cell development and activation. Eur J Immunol 41:3632–3644 [DOI] [PubMed] [Google Scholar]
- 43.Hunziker EB, Kapfinger E. and Geiss J. (2007). The structural architecture of adult mammalian articular cartilage evolves by a synchronized process of tissue resorption and neoformation during postnatal development. Osteoarthritis Cartilage 15:403–413 [DOI] [PubMed] [Google Scholar]
- 44.Kluger Y, Tuck DP, Chang JT, Nakayama Y, Poddar R, Kohya N, Lian Z, Ben Nasr A, Halaban HR, et al. (2004). Lineage specificity of gene expression patterns. Proc Natl Acad Sci U S A 101:6508–6513 [DOI] [PMC free article] [PubMed] [Google Scholar]
- 45.Niswander L. and Martin GR. (1993). FGF-4 regulates expression of Evx-1 in the developing mouse limb. Development 119:287–294 [DOI] [PubMed] [Google Scholar]
- 46.Schulte CJ, Allen C, England SJ, Juárez-Morales JL. and Lewis KE. (2011). Evx1 is required for joint formation in zebrafish fin dermoskeleton. Dev Dyn 240:1240–1248 [DOI] [PubMed] [Google Scholar]
- 47.Aldinger KA, Sokoloff G, Rosenberg DM, Palmer AA. and Millen KJ. (2009). Genetic variation and population substructure in outbred CD-1 mice: implications for genome-wide association studies. PLoS One 4:e4729. [DOI] [PMC free article] [PubMed] [Google Scholar]
- 48.Kavanagh E, Church VL, Osborne AC, Lamb KJ, Archer CW, Francis-West PH. and Pitsillides AA. (2006). Differential regulation of GDF-5 and FGF-2/4 by immobilisation in ovo exposes distinct roles in joint formation. Dev Dyn 235:826–834 [DOI] [PubMed] [Google Scholar]
- 49.Edwards CJ. and Francis-West PH. (2001). Bone morphogenetic proteins in the development and healing of synovial joints. Semin Arthritis Rheum 31:33–42 [DOI] [PubMed] [Google Scholar]
- 50.Pazin DE, Gamer LW, Cox KA. and Rosen V. (2012). Molecular profiling of synovial joints: use of microarray analysis to identify factors that direct the development of the knee and elbow. Dev Dyn 241:1816–1826 [DOI] [PubMed] [Google Scholar]
- 51.Michalopoulos GK. (1997). Liver regeneration. Science 276:60–66 [DOI] [PubMed] [Google Scholar]
- 52.Mastellos D, Germenis AE. and Lambris JD. (2005). Complement: an inflammatory pathway fulfilling multiple roles at the interface of innate immunity and development. Curr Drug Targets Inflamm Allergy 4:125–127 [DOI] [PubMed] [Google Scholar]
- 53.Arias J-I, Aller M-A, Prieto I, Arias A, de Julian Z, Yang H. and Arias J. (2012). The amazing power of cancer cells to recapitulate extraembryonic functions: the Cuckoo's tricks. J Oncol 2012:521284. [DOI] [PMC free article] [PubMed] [Google Scholar]
- 54.Østensen M, Lockshin M, Doria A, Valesini G, Meroni P, Gordon C, Brucato A. and Tincani A. (2008). Update on safety during pregnancy of biological agents and some immunosuppressive anti-rheumatic drugs. Rheumatology (Oxford) 47 (Suppl 3):iii28–iii31 [DOI] [PubMed] [Google Scholar]
- 55.Sonomoto K, Yamaoka K, Oshita K, Fukuyo S, Zhang X, Nakano K, Okada Y. and Tanaka Y. (2012). Interleukin-1β induces differentiation of human mesenchymal stem cells into osteoblasts via the Wnt-5a/receptor tyrosine kinase-like orphan receptor 2 pathway. Arthritis Rheum 64:3355–3363 [DOI] [PubMed] [Google Scholar]
- 56.Hess K, Ushmorov A, Fiedler J, Brenner RE. and Wirth T. (2009). TNFα promotes osteogenic differentiation of human mesenchymal stem cells by triggering the NF-κB signaling pathway. Bone 45:367–376 [DOI] [PubMed] [Google Scholar]
- 57.Cho HH, Shin KK, Kim YJ, Song JS, Kim JM, Bae YC, Kim CD. and Jung JS. (2010). NF-κB activation stimulates osteogenic differentiation of mesenchymal stem cells derived from human adipose tissue by increasing TAZ expression. J Cell Physiol 223:168–177 [DOI] [PubMed] [Google Scholar]
- 58.Nam D, Mau E, Wang Y, Wright D, Silkstone D, Whetstone H, Whyne C. and Alman B. (2012). T-lymphocytes enable osteoblast maturation via IL-17F during the early phase of fracture repair. PLoS One 7:e40044. [DOI] [PMC free article] [PubMed] [Google Scholar]
- 59.Yeh L-CC, Zavala MC. and Lee JC. (2002). Osteogenic protein-1 and interleukin-6 with its soluble receptor synergistically stimulate rat osteoblastic cell differentiation. J Cell Physiol 190:322–331 [DOI] [PubMed] [Google Scholar]
- 60.Deschner J, Hofman CR, Piesco NP. and Agarwal S. (2003). Signal transduction by mechanical strain in chondrocytes. Curr Opin Clin Nutr Metab Care 6:289–293 [DOI] [PMC free article] [PubMed] [Google Scholar]
- 61.Caron MMJ, Emans PJ, Surtel DAM, Cremers A, Voncken JW, Welting TJM. and van Rhijn LW. (2012). Activation of NF-κB/p65 facilitates early chondrogenic differentiation during endochondral ossification. PLoS One 7:e33467. [DOI] [PMC free article] [PubMed] [Google Scholar]
- 62.Ushita M, Saito T, Ikeda T, Yano F, Higashikawa A, Ogata N, Chung U, Nakamura K. and Kawaguchi H. (2009). Transcriptional induction of SOX9 by NF-kappaB family member RelA in chondrogenic cells. Osteoarthritis Cartilage 17:1065–1075 [DOI] [PubMed] [Google Scholar]
- 63.Park M, Yong Y, Choi S-W, Kim JH, Lee JE. and Kim D-W. (2007). Constitutive RelA activation mediated by Nkx3.2 controls chondrocyte viability. Nat Cell Biol 9:287–298 [DOI] [PubMed] [Google Scholar]
- 64.Ulivi V, Tutolo G, Mallein-Gerin F, Daga A, Cancedda R. and Cancedda FD. (2006). A common pathway in differentiation and inflammation: p38 mediates expression of the acute phase SIP24 iron binding lipocalin in chondrocytes. J Cell Physiol 206:728–737 [DOI] [PubMed] [Google Scholar]
- 65.Dowthwaite GP, Flannery CR, Flannelly J, Lewthwaite JC, Archer CW. and Pitsillides AA. (2003). A mechanism underlying the movement requirement for synovial joint cavitation. Matrix Biol 22:311–322 [DOI] [PubMed] [Google Scholar]
- 66.Kahn J, Shwartz Y, Blitz E, Krief S, Sharir A, Breitel DA, Rattenbach R, Relaix F, Maire P, et al. (2009). Muscle contraction is necessary to maintain joint progenitor cell fate. Dev Cell 16:734–743 [DOI] [PubMed] [Google Scholar]
- 67.Osborne AC, Lamb KJ, Lewthwaite JC, Dowthwaite GP. and Pitsillides AA. (2002). Short-term rigid and flaccid paralyses diminish growth of embryonic chick limbs and abrogate joint cavity formation but differentially preserve pre-cavitated joints. J Musculoskelet Neuronal Interact 2:448–456 [PubMed] [Google Scholar]
- 68.Roddy KA, Prendergast PJ. and Murphy P. (2011). Mechanical influences on morphogenesis of the knee joint revealed through morphological, molecular and computational analysis of immobilised embryos. PLoS One 6:e17526. [DOI] [PMC free article] [PubMed] [Google Scholar]
- 69.Iqbal J. and Zaidi M. (2005). Molecular regulation of mechanotransduction. Biochem Biophys Res Commun 328:751–755 [DOI] [PubMed] [Google Scholar]
- 70.Chowdhury TT, Salter DM, Bader DL. and Lee DA. (2008). Signal transduction pathways involving p38 MAPK, JNK, NFκB and AP-1 influences the response of chondrocytes cultured in agarose constructs to IL-1β and dynamic compression. Inflamm Res 57:306–313 [DOI] [PubMed] [Google Scholar]
- 71.Campo GM, Avenoso A, D'Ascola A, Scuruchi M, Prestipino V, Calatroni A. and Campo S. (2012). Hyaluronan in part mediates IL-1beta-induced inflammation in mouse chondrocytes by up-regulating CD44 receptors. Gene 494:24–35 [DOI] [PubMed] [Google Scholar]
- 72.Yoshioka Y, Kozawa E, Urakawa H, Arai E, Futamura N, Zhuo L, Kimata K, Ishiguro N. and Nishida Y. (2013). Suppression of hyaluronan synthesis alleviates inflammatory responses in murine arthritis and in human rheumatoid synovial fibroblasts. Arthritis Rheum 65:1160–1170 [DOI] [PubMed] [Google Scholar]
- 73.Longobardi L, Li T, Myers TJ, O'Rear L, Ozkan H, Li Y, Contaldo C. and Spagnoli A. (2012). TGF-β type II receptor/MCP-5 axis: at the crossroad between joint and growth plate development. Eur J Obstet Gynecol Reprod Biol 23:71–81 [DOI] [PMC free article] [PubMed] [Google Scholar]
Associated Data
This section collects any data citations, data availability statements, or supplementary materials included in this article.